Market Overview
| Study Period | 2021 - 2031 |
|---|---|
| Forecast Data Period | 2026 - 2031 |
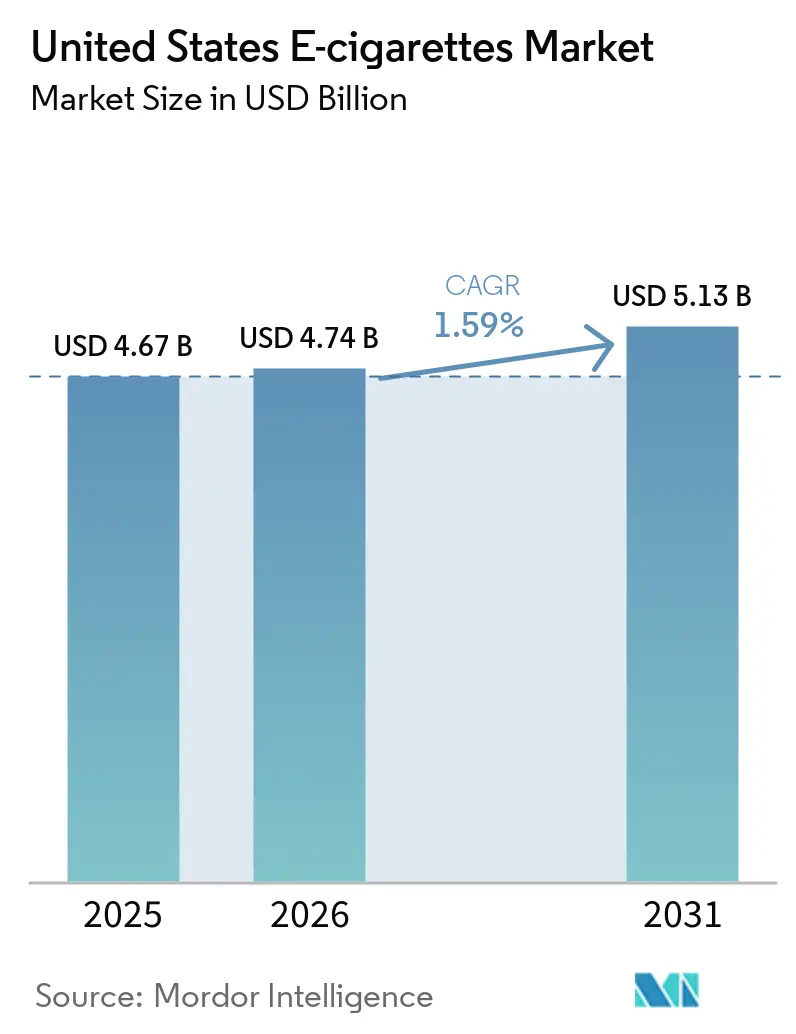
| Base Year Market Size (2025) | USD 4.67 Billion |
| Market Size (2026) | USD 4.74 Billion |
| Market Size (2031) | USD 5.13 Billion |
| Growth Rate (2026 - 2031) | 1.59% CAGR |
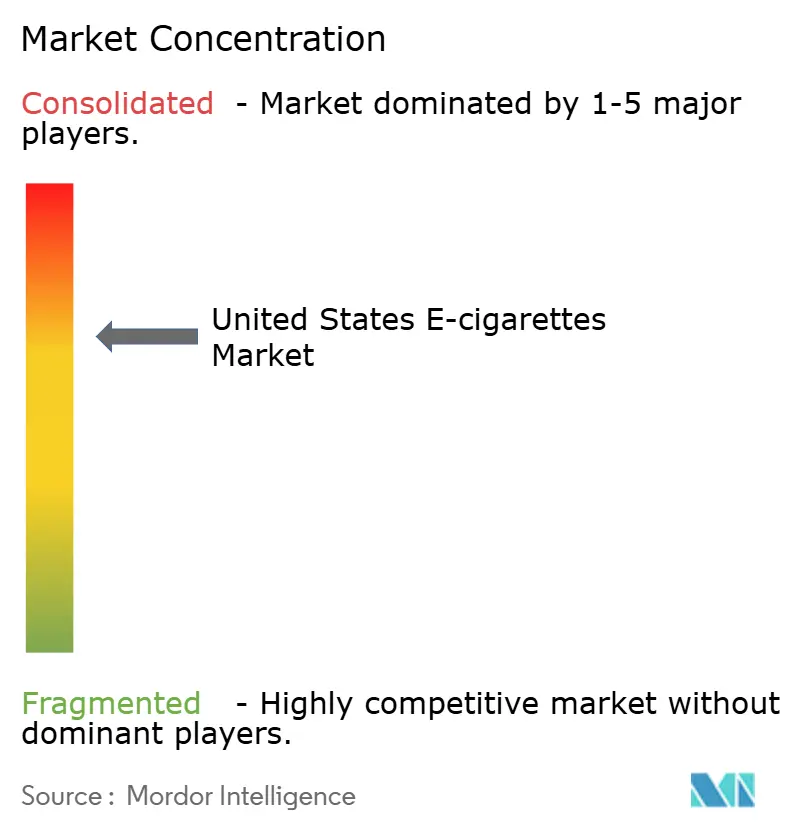
| Market Concentration | Medium |
Major Players
*Disclaimer: Major Players sorted in no particular order Image © Mordor Intelligence. Reuse requires attribution under CC BY 4.0. |
|
United States E-cigarettes Market Analysis by Mordor Intelligence
The United States e-cigarette market was valued at USD 4.67 billion in 2025 and estimated to grow from USD 4.74 billion in 2026 to reach USD 5.13 billion by 2031, registering a CAGR of 1.59% during the forecast period (2026-2031). This moderate growth reflects a significant restructuring influenced by the U.S. Food & Drug Administration's (FDA) premarket tobacco application process. The process, aimed at ensuring product safety and compliance, requires manufacturers to submit scientific data demonstrating that their products are appropriate for the protection of public health. In July 2025, JUUL Labs received authorization for tobacco and menthol-flavored products by the FDA, following years of regulatory uncertainty[1]Source: U.S. Food & Drug Administration, "FDA Authorizes Marketing of Tobacco- and Menthol-Flavored JUUL E-Cigarette Products", fda.gov. This authorization underscores the FDA's focus on evidence-based harm reduction, emphasizing the importance of scientific evaluation in regulating e-cigarette products.
Key Report Takeaways
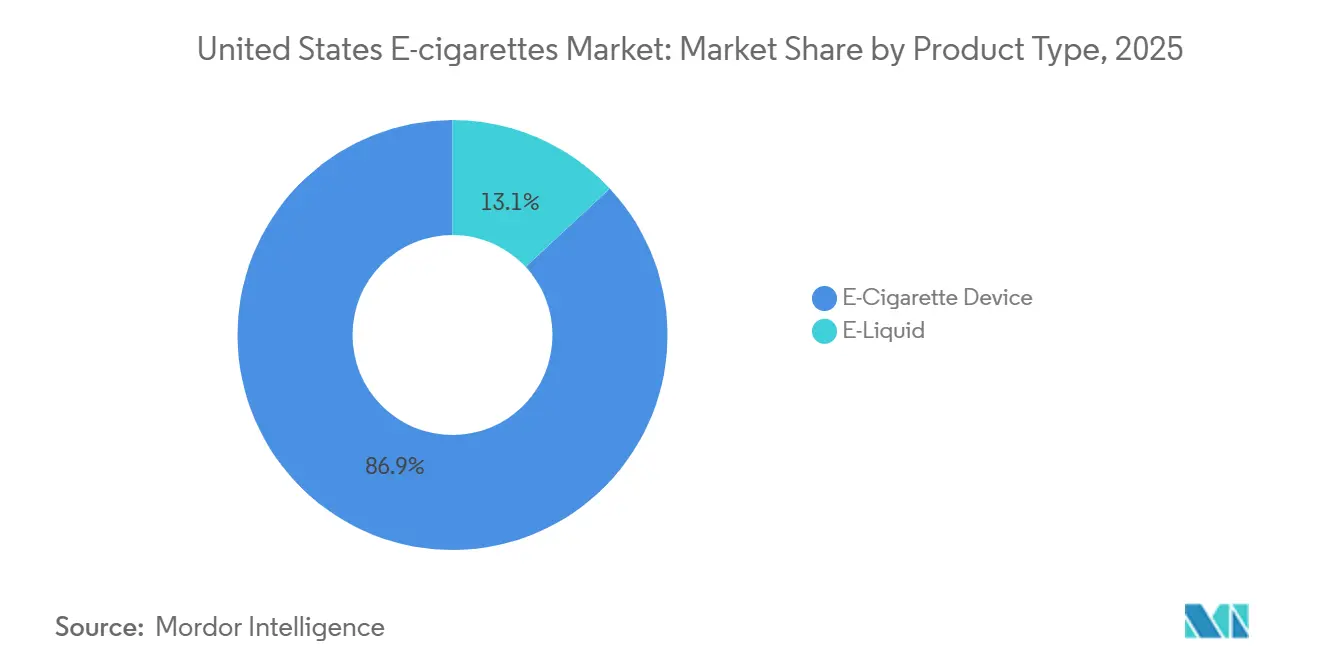
- By product type, e-cigarette devices held 86.93% of the United States e-cigarettes market share in 2025, while e-liquids are poised to grow at a 1.98% CAGR through 2031.
- By category, closed vaping systems commanded 82.62% revenue share in 2025; open vaping systems are forecast to expand at a 1.89% CAGR to 2031.
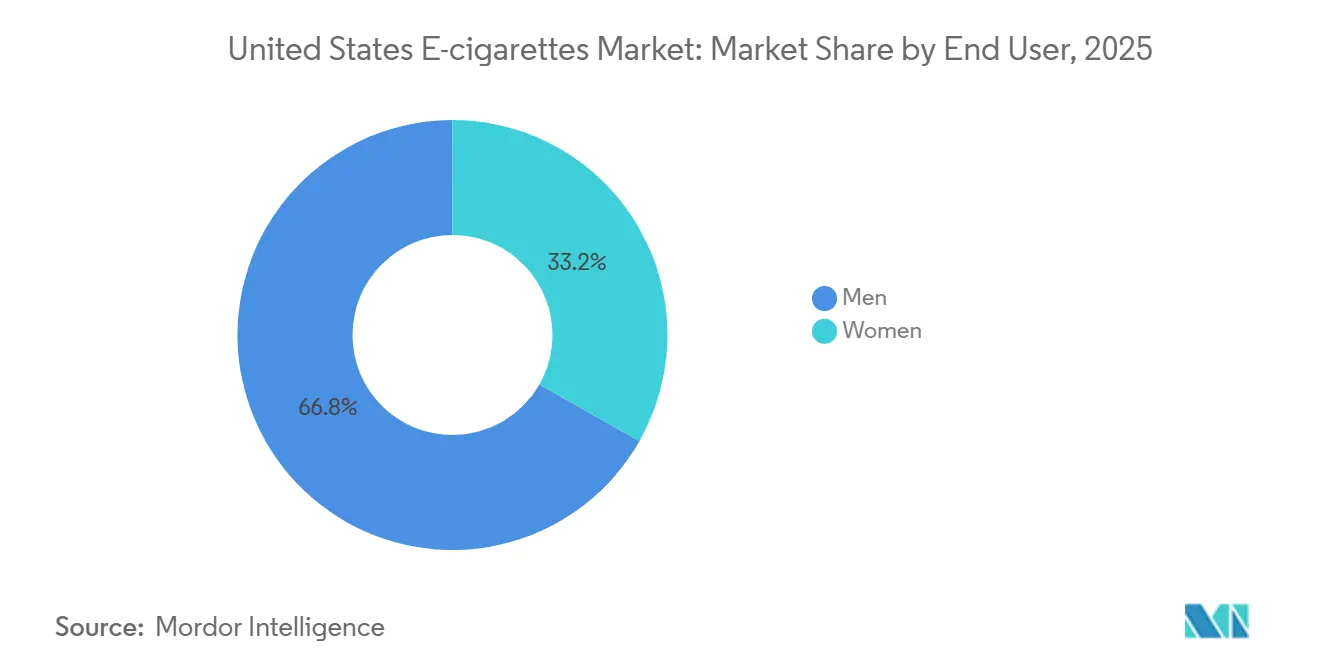
- By end user, men accounted for 66.77% of consumption in 2025, whereas the women’s segment is projected to record a 2.06% CAGR through 2031.
- By distribution channel, offline stores captured 87.06% in 2025, yet online stores are expected to advance at a 2.48% CAGR to 2031.
Note: Market size and forecast figures in this report are generated using Mordor Intelligence’s proprietary estimation framework, updated with the latest available data and insights as of January 2026.
United States E-cigarettes Market Trends and Insights
Drivers Impact Analysis*
| Driver | (~) % Impact on CAGR Forecast | Geographic Relevance | Impact Timeline |
|---|---|---|---|
| Rising health awareness and demand for smoking alternatives | +0.4% | National, strongest in states with tobacco control programs | Medium term (2-4 years) |
| Continuous innovation in vaping device technology | +0.3% | National, with early adoption in urban centers | Short term (≤ 2 years) |
| Wide range of flavor offerings boosting consumer appeal | +0.2% | National, except California, Massachusetts, New York with flavor bans | Medium term (2-4 years) |
| Growing social acceptance and changing cultural norms | +0.2% | National, accelerating in younger adult cohorts | Long term (≥ 4 years) |
| Strong influence of social media and influencer promotions | +0.1% | National, concentrated in digital-native demographics | Short term (≤ 2 years) |
| Increased customization across nicotine strengths and flavors | +0.2% | National, with premium segments in coastal markets | Medium term (2-4 years) |
| Source: Mordor Intelligence | |||
Rising health awareness and demand for smoking alternatives
Cigarette smoking among adults in the United States was 9.9% in 2024, as public health campaigns and clinical evidence highlighted e-cigarettes as a transitional tool[2]Source: Centers for Disease Control and Prevention, "Early Release of Selected Estimates Based on Data From the 2024 National Health Interview Survey", cdc.gov. A 2022 Cochrane systematic review concluded with moderate certainty that nicotine e-cigarettes improve quit rates compared to nicotine replacement therapy, supporting harm-reduction claims[3]Source: The Cochrane Collaboration, "Latest Cochrane Review finds high certainty evidence that nicotine e-cigarettes are more effective than traditional nicotine-replacement therapy (NRT) in helping people quit smoking", cochrane.org. The FDA's authorization of JUUL's tobacco and menthol products in July 2025 validated the premarket tobacco application pathway, indicating that manufacturers with comprehensive toxicology data can achieve market access. Dual users, individuals who use both vaping products and combustible cigarettes, present a potential market opportunity.
Continuous innovation in vaping device technology
Disposable e-cigarettes now offer over 5,000 puffs per unit, an increase from 2,000 puffs in 2022. This development extends replacement cycles and improves cost-per-use efficiency. Mesh coil atomizers, which have replaced traditional wire coils in premium devices, increase the surface area by 40%, resulting in denser vapor production and minimizing dry hits. USB-C charging ports became standard in rechargeable models, aligning with trends in consumer electronics and enabling faster charging. Nicotine salt formulations, with a pH buffer of 5.0-5.5, allow nicotine concentrations of up to 50 milligrams per milliliter without causing throat irritation. This advancement has significantly narrowed the satisfaction gap between e-cigarettes and combustible cigarettes. Moreover, ongoing product innovation focused on safety, efficiency, and user convenience is a key driver of the United States e-cigarettes market. For instance, in March 2024, British American Tobacco filed a patent for a rechargeable e-cigarette featuring a unique recharging mechanism. The device includes a battery, an external connector for recharging, and a mechanism designed to prevent overcharging, aiming to enhance both safety and efficiency in e-cigarette usage.
Wide range of flavor offerings boosting consumer appeal
Flavor variety remains the primary driver of trial and repeat purchase, with fruit, dessert, and menthol profiles accounting for 87.6% of youth consumption[4]Source: Centers for Disease Control and Prevention, "E-Cigarette Use Among Youth", cdc.gov. California's 2024 flavor ban exempted tobacco and menthol, creating a bifurcated market where authorized products compete against illicit imports from China that offer candy and beverage flavors. The FDA issued warning letters to retailers for selling unauthorized flavored disposables, yet enforcement remains reactive rather than preventive. Manufacturers responded by launching "tobacco-forward" blends infused with vanilla or caramel notes, which technically comply with flavor restrictions while delivering sensory complexity.
Growing social acceptance and changing cultural norms
The percentage of adults using electronic cigarettes rose from 4.5% in 2019 to 6.5% in 2023 in the United States. This increase highlights a growing acceptance and adoption of electronic cigarettes among adults over the years. Workplace policies have increasingly allowed vaping in designated outdoor areas, marking a shift from the comprehensive bans imposed on combustible cigarettes. This change reflects a differentiation in how vaping and traditional smoking are regulated in professional environments. The normalization paradox is reflected in youth data, where disposable usage among current users has grown. This suggests that those who vape, particularly among the youth, are engaging in more frequent and intensive vaping habits.
Restraints Impact Analysis*
| Restraint | (~) % Impact on CAGR Forecast | Geographic Relevance | Impact Timeline |
|---|---|---|---|
| Strict FDA regulations and complex PMTA approval process | -0.5% | National, with FDA jurisdiction over interstate commerce | Long term (≥ 4 years) |
| Supply chain disruptions and sourcing risks | -0.1% | National, concentrated in manufacturers reliant on Chinese components | Short term (≤ 2 years) |
| Presence of illegal and unregulated vaping products | -0.2% | National, acute in border states and online channels | Medium term (2-4 years) |
| Youth vaping concerns leading to tighter restrictions | -0.3% | National, with state-level variations in enforcement intensity | Medium term (2-4 years) |
| Source: Mordor Intelligence | |||
Strict FDA regulations and complex PMTA approval process
The U.S. Food and Drug Administration (FDA) has rejected the majority of premarket tobacco applications in recent years, approving only a limited number of products. This high rejection rate has led to the exit of many smaller manufacturers from the market. The application process is notably expensive, requiring comprehensive toxicology testing, behavioral studies, and detailed manufacturing protocols. These requirements create significant entry barriers, favoring larger, well-funded companies. Among the few approvals granted was JUUL, which had to provide extensive scientific data and agree to ongoing post-market monitoring, including regular audits to assess youth usage. Additionally, the FDA has proposed a rule to significantly reduce nicotine levels in combustible cigarettes. While this measure aims to encourage smokers to transition to alternatives like e-cigarettes, it is expected to face substantial legal opposition from tobacco companies. Compliance with the FDA’s manufacturing standards further increases production costs, as companies must implement batch testing and traceability systems, intensifying financial challenges for smaller industry participants.
Presence of illegal and unregulated vaping products
A significant portion of disposable vaping products in the United States is sourced from overseas manufacturers, frequently entering the market through indirect logistics channels. Although customs authorities continue to seize unauthorized devices, these efforts capture only a small percentage of the total inflow. These unregulated products bypass regulatory approval, are available in prohibited flavors, and are sold at prices considerably lower than those of authorized brands. Consequently, they establish a parallel market that disrupts legitimate businesses and diminishes lawful revenue. While regulators have issued warnings to retailers found selling unauthorized products, enforcement actions primarily focus on the retail level rather than addressing the wider supply chain.
*Our forecasts treat driver/restraint impacts as directional, not additive. The impact forecasts reflect baseline growth, mix effects, and variable interactions.
Segment Analysis
By Product Type: Device Dominance Faces E-Liquid Innovation
E-cigarette devices captured 86.93% of market value in 2025, reflecting the dominance of closed-system pods and disposables that bundle hardware and consumables into a single purchase. The e-liquid segment is expected to expand at 1.98% CAGR through 2031, as refillable systems gain traction among cost-conscious users and enthusiasts seeking flavor customization. Disposable e-cigarettes within the device category now feature over 5,000 puffs per unit, extending replacement cycles and improving economics for heavy users. Non-disposable devices, including rechargeable pods and mod systems, benefit from USB-C charging and mesh coil atomizers that increase vapor density significantly.
Nicotine salt formulations in e-liquids, which buffer pH to 5.0-5.5, enable concentrations up to 50 milligrams per milliliter without throat harshness, a breakthrough that closed the satisfaction gap with combustible cigarettes. The FDA's authorization of JUUL's tobacco and menthol products in July 2025 validated nicotine salt technology, providing a regulatory template for other manufacturers. E-liquid sales are being challenged by flavor restrictions in several major states, but manufacturers have adapted by introducing tobacco-oriented blends that meet regulatory requirements while still offering a nuanced sensory experience. Growth in this segment is also driven by experienced open-system users, who increasingly favor bulk e-liquid purchases over pre-filled pods, allowing them to lower their overall costs.


By Category: Closed Systems Dominate Despite Open-System Growth
Closed vaping systems held 82.62% market share in 2025, benefiting from brand loyalty, regulatory clarity, and retail convenience, while open systems will grow at 1.89% CAGR through 2031 as enthusiasts prioritize customization over simplicity. Closed systems, exemplified by JUUL, Vuse, and NJOY, integrate proprietary pods with device firmware, locking users into brand ecosystems and generating recurring consumable revenue. British American Tobacco's Vuse Alto, which received PMTA authorization in 2024, leverages this model by pairing its devices with proprietary pods, generating strong profitability through recurring consumable sales. The FDA's premarket process favors closed systems because manufacturers can demonstrate tighter quality control and age-verification at point-of-sale, reducing youth access risk.
Open vaping systems, which allow users to refill tanks with third-party e-liquids and adjust wattage, appeal to a smaller but more engaged cohort. These devices will capture incremental share as vapers seek to reduce costs and experiment with flavor blends. Innovations in open systems include temperature control chips that prevent dry hits and extend coil life by 50%, according to patents filed by SMOORE in 2024. However, open systems face regulatory scrutiny because users can modify nicotine concentrations and introduce non-compliant liquids, complicating enforcement. State-level flavor bans disproportionately impact open systems, as bulk e-liquid suppliers operate in gray zones where product registration requirements remain unclear.
By End User: Male Dominance Narrows as Female Adoption Climbs
Men represented 66.77% of e-cigarette users in 2025, yet the women's segment is expected to expand at 2.06% CAGR through 2031, driven by discreet device designs and fruit-forward flavor profiles. Female users prioritize aesthetics and portability, favoring slim, lightweight devices that fit in small purses and produce minimal visible vapor. Manufacturers responded with products like Vuse's "PRO" line, which features rose-gold finishes and significantly smaller form factors than standard pods. Gender differences are evident in nicotine preferences, with women generally showing lower dependence and greater sensitivity to throat hit compared to men.
Flavor choices also vary, as women tend to favor fruit or dessert profiles, while men lean more toward tobacco and menthol options. The female segment includes a larger share of dual users, those who combine vaping with traditional cigarettes, creating potential opportunities for harm-reduction messaging. At the same time, youth vaping trends complicate these dynamics, as usage rates are nearly equal between boys and girls, fueling political pressure for stricter regulations that could limit adult female adoption.
By Distribution Channel: Offline Retail Dominance Confronts Online Upswing
Offline stores commanded 87.06% of distribution in 2025, anchored by convenience stores, gas stations, and vape shops that offer immediate product access and in-person age verification, yet online channels will grow at 2.48% CAGR through 2031. Convenience stores and gas stations account for a significant share of offline volume, leveraging impulse purchase behavior and proximity to daily routines. These channels stock primarily closed-system pods and disposables, which generate higher per-transaction revenue than open-system components. Specialty vape shops cater to enthusiasts seeking open systems, bulk e-liquids, and customization advice, but face margin pressure from online competitors and regulatory compliance costs.
Online channels are increasingly adopting subscription models that provide pods on a 30-day cycle, minimizing friction and ensuring recurring revenue. These models allow brands to establish a predictable revenue stream while enhancing customer convenience. Brands are focusing on direct-to-consumer subscriptions, offering benefits such as discounts and free shipping to members who commit to quarterly purchases. This approach not only incentivizes customer loyalty but also reduces the likelihood of churn. However, age verification remains a significant challenge. The FDA issues warning letters to online retailers for insufficient identity verification, highlighting that compliance with regulatory requirements will play a crucial role in determining platform sustainability. Retailers must invest in robust age verification systems to ensure adherence to regulations and maintain their operations.
Geography Analysis
The United States e-cigarette market demonstrates notable geographical differences influenced by state regulations, consumer preferences, and demographic factors. States like California and New York, which enforce strict regulations on tobacco and nicotine products, have experienced slower market growth compared to states with more relaxed policies, such as Texas and Florida. For example, California's flavor ban on e-cigarettes has affected product availability, shaping consumer behavior and market trends. Conversely, states with fewer restrictions have seen higher adoption rates, especially among younger demographics, driven by a wider range of product options and marketing strategies aligned with local preferences.
Southern and Midwestern states, which do not have statewide flavor bans, account for a significant share of disposable e-cigarette consumption. These regions also exhibit higher rates of dual use, where adults combine vaping with combustible cigarettes, due to weaker tobacco control measures and lower cigarette taxes. The FDA’s enforcement of unauthorized products varies across regions, with Customs and Border Protection seizing substantial quantities of devices, particularly at major ports. Urban centers such as Los Angeles, New York City, and Chicago have the highest per-capita vaping adoption, influenced by younger populations and higher disposable incomes. However, these cities also experience the most stringent local enforcement, including retail license revocations and penalties for selling to minors.
Cultural and social factors play a crucial role in shaping the geographical distribution of the e-cigarette market in the United States. States with a strong smoking culture, such as Kentucky and West Virginia, are gradually transitioning toward e-cigarettes, which are perceived as a less harmful alternative to traditional tobacco products. This transition is further encouraged by public health campaigns and initiatives aimed at reducing smoking rates. Conversely, states that prioritize health-conscious lifestyles, such as Colorado and Oregon, have shown a preference for e-cigarettes positioned as wellness-oriented or organic products. These regional variations underscore the need to adapt marketing strategies and product offerings to the specific characteristics of each state to ensure consistent growth during the forecast period.
Competitive Landscape
The United States e-cigarette market is highly competitive, with numerous major players operating within it. The market exhibits moderate consolidation, reflecting oligopolistic characteristics. Leading tobacco companies leverage their expertise in regulatory compliance and extensive distribution networks to maintain their market positions. These strategies are particularly important as the industry encounters growing regulatory enforcement pressures. The market's consolidation is evident, with a few key players holding a substantial share, highlighting their influence in shaping the competitive landscape.
Key companies in the United States e-cigarette market include Imperial Brands PLC, Japan Tobacco Inc., Philip Morris International Inc., British American Tobacco PLC, and Juul Labs Inc. These companies utilize various strategies to enhance their market position and remain competitive. Prominent strategies include product innovation and mergers and acquisitions. Through innovation, these companies aim to meet shifting consumer preferences by introducing new and improved products. This strategy helps retain existing customers while attracting new ones, thereby strengthening their market presence.
Partnerships and acquisitions are integral to the growth strategies of these companies, complementing their focus on innovation. Such collaborations and acquisitions help expand geographical reach and diversify product portfolios, strengthening their market presence. These strategic actions enable key players to respond effectively to market dynamics and sustain their leadership positions. As the United States e-cigarette market evolves, the capacity of these companies to innovate and establish strategic alliances will be essential for addressing challenges and capitalizing on opportunities in this competitive environment.
United States E-cigarettes Industry Leaders
-
Philip Morris International Inc
-
Imperial Brands PLC
-
British American Tobacco PLC
-
Altria Group Inc.
-
Japan Tobacco Inc.
- *Disclaimer: Major Players sorted in no particular order

Recent Industry Developments
- June 2025: GEEKBAR introduced its latest e-cigarette, the GEEKBAR 2GO, offering up to 50,000 puffs across 13 flavors. The device features an interactive display screen and can automatically adjust nicotine concentration for a tailored vaping experience.
- May 2025: The WASPE 60000 disposable vape debuted in the United States market at a price of USD 6.45. Designed with a 3-in-1 format, it delivers up to 60,000 puffs and includes 12 flavor combinations, enabling users to switch between flavors and nicotine strengths.
- May 2025: Charlie’s Holdings launched PMTA registry-compliant 60ml e-liquids under its PACHAMAMA brand in select U.S. states with FDA certification requirements. The rollout includes five award-winning flavors, such as “Fuji” and “Mint,” and targets states like North Carolina, Kentucky, Oklahoma, Virginia, and Wisconsin with stricter vapor product regulations.


Research Methodology Framework and Report Scope
Market Definitions and Key Coverage
Our study defines the United States e-cigarette market as retail and wholesale sales of battery-powered devices that aerosolize nicotine-containing or nicotine-free e-liquids, including disposables, pod systems, and open-tank mods, but excluding heat-not-burn tobacco, cannabis vapes, and aftermarket parts. According to Mordor Intelligence, value is captured in USD at manufacturer gate and select channel mark-ups, then harmonized to 2024 exchange rates.
Scope Exclusion: DIY e-liquid concentrates and non-nicotine herbal vaporizers lie outside our frame.
Segmentation Overview
-
By Product Type
-
E-Cigarette Device
- Disposable E-Cigarette
- Non-Disposable E-Cigarette
- E-Liquid
-
E-Cigarette Device
-
By Category
- Open Vaping Systems
- Closed Vaping Systems
-
By End User
- Men
- Women
-
By Distribution Channel
- Offline Stores
- Online Stores
Detailed Research Methodology and Data Validation
Primary Research
Mordor analysts conducted structured calls with device makers, e-liquid bottlers, convenience-store buyers, and pulmonologists across the Midwest, South, and coastal states. Interviews validated typical wholesale pricing, flavor-mix shifts, and regulatory cost pass-throughs, ensuring model assumptions mirror on-the-ground realities.
Desk Research
We built the initial demand pool by stitching together public datasets such as CDC National Youth Tobacco Survey results, FDA PMTA authorization lists, U.S. Census smoking-prevalence tables, and import records from the U.S. International Trade Commission. Trade association briefs (Vapor Technology Association), patent counts sourced through Questel, and company 10-K filings strengthened benchmark volumes. Subscription tools, D&B Hoovers for financials and Dow Jones Factiva for deal news, filled remaining gaps. These sources illustrate but do not exhaust the materials reviewed.
Market-Sizing & Forecasting
A top-down build starts with CDC-reported adult and youth vaping incidence, multiplied by average annual spend per active vaper derived from retail scanner data, before being further filtered through FDA-authorized product share. Supplier roll-ups and sampled ASP × unit checks provide a bottom-up cross-check, and gaps are reconciled. Key drivers, nicotine-use prevalence, disposable-device penetration, PMTA approval cadence, unit price erosion, and state flavor-ban coverage, feed a multivariate regression that projects 2025-2030 values.
Data Validation & Update Cycle
Outputs undergo variance checks against shipment logs and Circana scan data; anomalies trigger re-interviews. A senior reviewer signs off, and figures are refreshed annually with rapid updates after material FDA rulings.
Why Our United States E-Cigarettes Baseline Commands Reliability
Published estimates diverge because firms pick different product mixes, channel breadth, and regulatory assumptions.
Primary gap drivers include: some studies fold heat-not-burn sticks into e-cigarettes, others assume full online and vape-shop capture despite sparse disclosure, and a few ignore downward price drift tied to disposable proliferation. Mordor's base year ties spend directly to verified FDA-authorized and gray-market volumes, refreshed every twelve months, giving decision-makers a steadier view.
Benchmark comparison
| Market Size | Anonymized source | Primary gap driver |
|---|---|---|
| USD 6.04 B (2025) | Mordor Intelligence | - |
| USD 11.19 B (2023) | Global Consultancy A | Includes vape pens and cannabis devices; broad online sales uplift |
| USD 13.98 B (2024) | Industry Association B | Aggregates heat-not-burn products and assumes uniform state legality |
| USD 0.50 B (2024) | Regional Consultancy C | Counts device hardware only, excludes e-liquid refills and disposables |
The comparison shows how scope stretch or contraction swings totals. By anchoring spend to clearly defined device classes and validated usage, Mordor delivers a balanced, reproducible baseline clients can trust for planning.


Key Questions Answered in the Report
What is the current value of the United States e-cigarettes market?
The United States e-cigarettes market stands at USD 4.74 billion in 2026 and is projected to reach USD 5.13 billion by 2031.
Which product category leads sales?
Closed-system devices command 82.62% of 2025 revenue, making them the dominant format.
How fast is the women’s user segment growing?
The women's segment is expected to record a 2.06% CAGR through 2031.
What share do offline stores hold in distribution?
Brick-and-mortar outlets captured 87.06% of sales value in 2025, led by convenience stores and gas stations.
Page last updated on:


