Trade Surveillance Systems Market Size and Share
Market Overview
| Study Period | 2020 - 2031 |
|---|---|
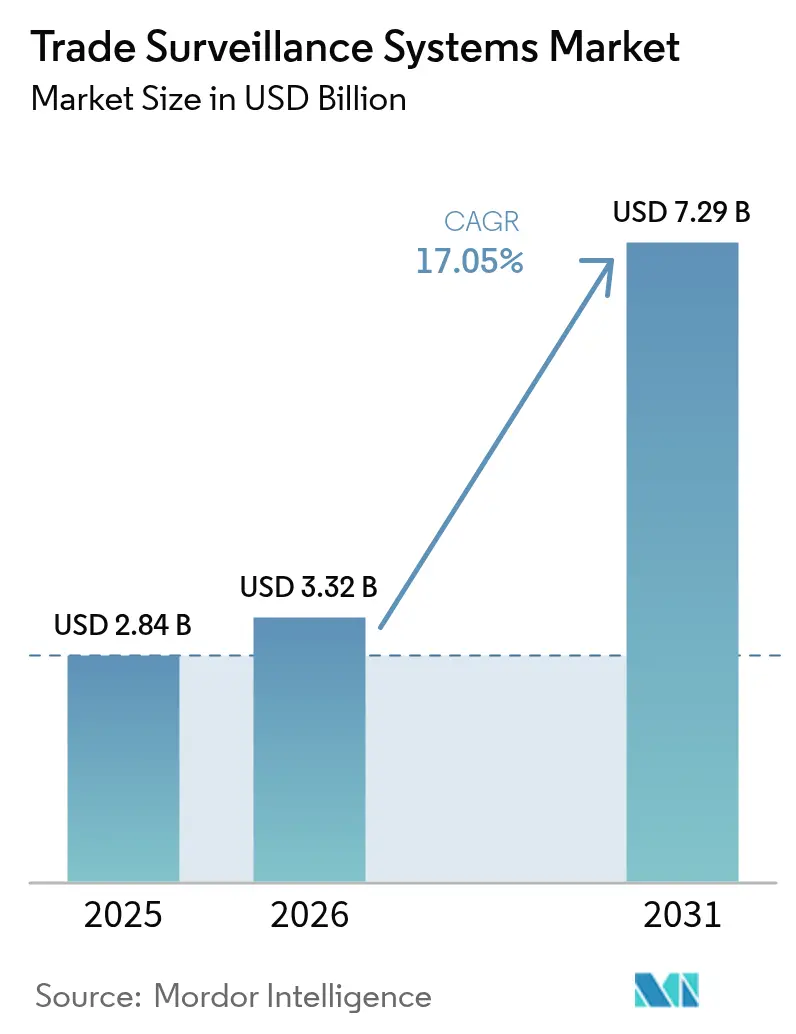
| Market Size (2026) | USD 3.32 Billion |
| Market Size (2031) | USD 7.29 Billion |
| Growth Rate (2026 - 2031) | 17.05% CAGR |
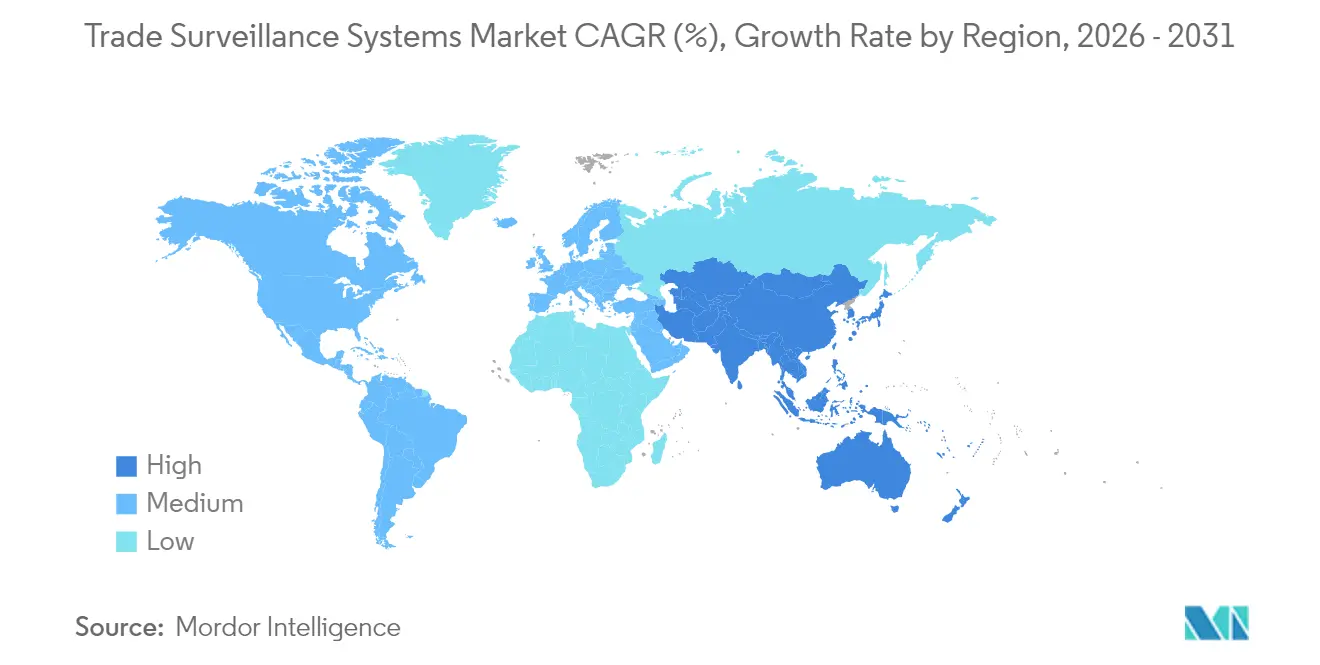
| Fastest Growing Market | Asia-Pacific |
| Largest Market | North America |
| Market Concentration | Medium |
Major Players *Disclaimer: Major Players sorted in no particular order Image © Mordor Intelligence. Reuse requires attribution under CC BY 4.0. | |
Trade Surveillance Systems Market Analysis by Mordor Intelligence
Trade Surveillance Systems market size in 2026 is estimated at USD 3.32 billion, growing from 2025 value of USD 2.84 billion with 2031 projections showing USD 7.29 billion, growing at 17.05% CAGR over 2026-2031. Heightened reporting mandates such as the United States’ Consolidated Audit Trail (CAT) and Europe’s evolving MiFID II framework are the core catalysts. Institutions now need near-real-time analytics that screen more than 150,000 transactions per second and spot suspicious patterns with 97.5% accuracy, pushing vendors toward high-performance, AI-driven architectures. Cloud deployment lowers upfront capital requirements, while hybrid models address data-sovereignty concerns. Rapid growth in crypto and tokenized assets adds complexity, forcing surveillance platforms to expand beyond traditional equities and derivatives.
Key Report Takeaways
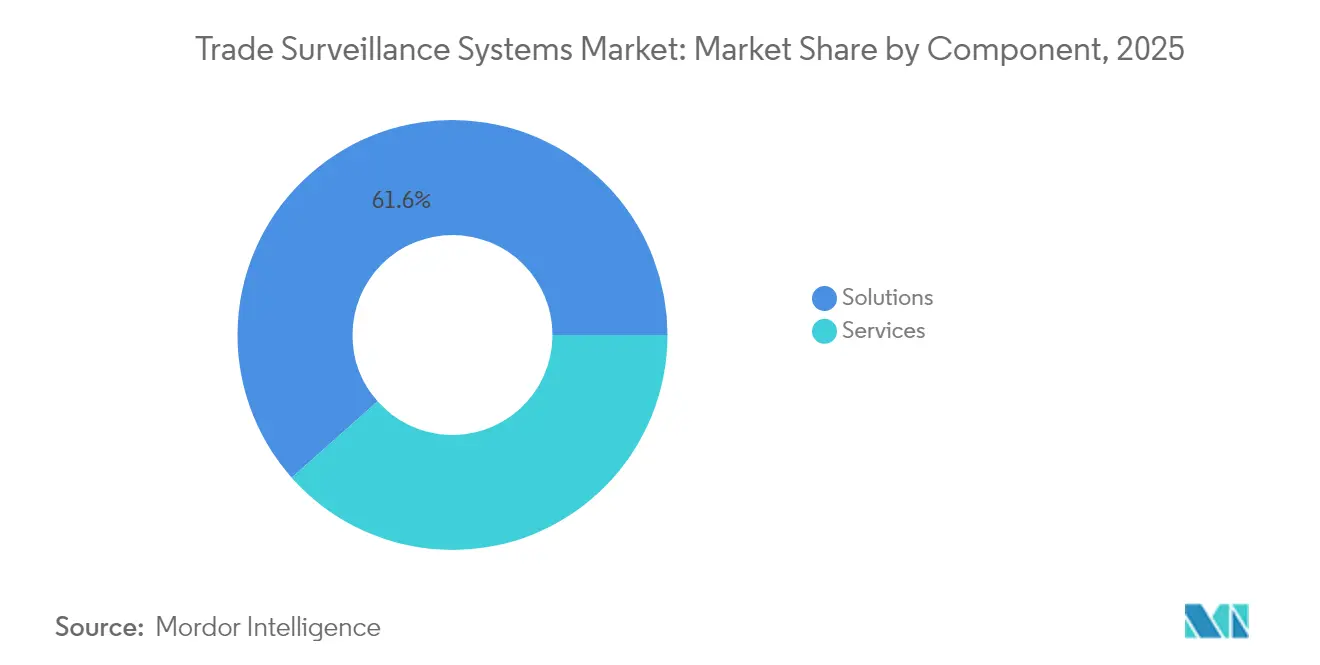
- By component, solutions led with 61.55% of the trade surveillance systems market share in 2025; services are projected to climb at an 18% CAGR through 2031.
- By deployment mode, on-premise held 54.15% share of the trade surveillance systems market size in 2025, while cloud is forecast to expand at 19.05% CAGR between 2026-2031.
- By trading type, equities accounted for a 32.10% share of the trade surveillance systems market size in 2025; digital assets are advancing at a 19.7% CAGR to 2031.
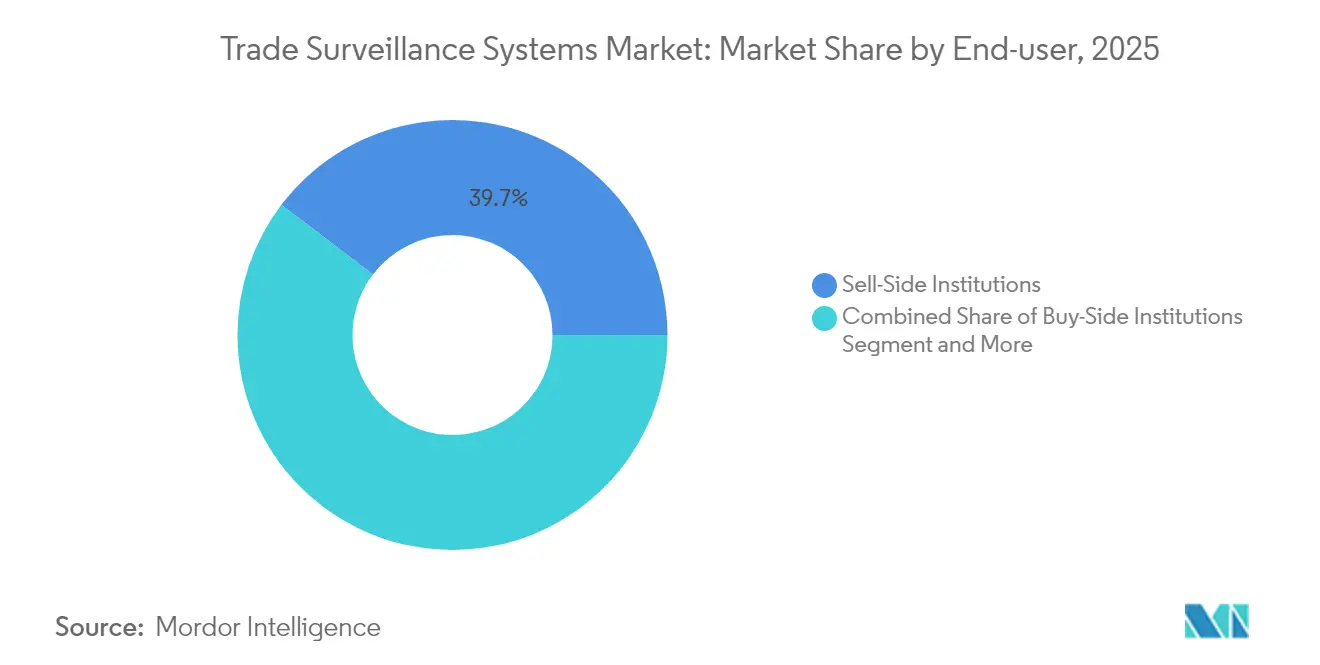
- By end-user, sell-side institutions captured 39.65% of the trade surveillance systems market share in 2025; buy-side firms record the highest projected CAGR at 18.2% through 2031.
- By organisation size, tier-1 global banks commanded 35.65% share of the trade surveillance systems market size in 2025, while FinTech and crypto exchanges are growing at 21.4% CAGR.
- By geography, North America led with a 33.92% share in 2025; Asia-Pacific exhibits the fastest regional CAGR of 17.6% to 2031.
Note: Market size and forecast figures in this report are generated using Mordor Intelligence’s proprietary estimation framework, updated with the latest available data and insights as of 2026.
Global Trade Surveillance Systems Market Trends and Insights
Drivers Impact Analysis*
| Driver | (~) % Impact on CAGR Forecast | Geographic Relevance | Impact Timeline |
|---|---|---|---|
| Rapid expansion of global multi-asset electronic trading venues | +3.2% | Global, with concentration in North America and EU | Medium term (2-4 years) |
| Mandatory consolidated audit trail (CAT) and other post-trade transparency mandates | +2.8% | North America primary, EU secondary | Short term (≤ 2 years) |
| AI/ML-powered anomaly detection reduces false positives and compliance costs | +4.1% | Global, led by APAC innovation hubs | Long term (≥ 4 years) |
| Cloud-native SaaS delivery lowering total cost of ownership | +3.5% | Global, accelerated in emerging markets | Medium term (2-4 years) |
| Growing adoption of crypto and digital-asset trading by regulated institutions | +2.2% | Global, with regulatory clarity in EU and Singapore | Medium term (2-4 years) |
| Tokenisation of real-world assets creating new surveillance blind spots | +1.9% | Global, early adoption in developed markets | Long term (≥ 4 years) |
| Source: Mordor Intelligence | |||
Rapid Expansion of Multi-Asset Electronic Trading Venues
High-frequency and algorithmic strategies now drive more than half of US equity volumes, creating surveillance blind spots that legacy rule sets struggle to cover. Firms must correlate order books across equities, fixed income, options, and commodities while accounting for millisecond latency gaps that enable cross-venue arbitrage. The shift from dealer models to fully automated order-driven venues in London illustrates how liquidity gains coexist with higher market-abuse risk. [1]Financial Conduct Authority, “Equity Market Structure Literature Review Part II: High Frequency Trading,” sec.gov Vendors respond by unifying data feeds and embedding venue-specific calibrations that flag spoofing and layering across fragmented markets.
Mandatory CAT and Other Post-Trade Transparency Mandates
The CAT regime obliges US brokers to report every equity and option event under one schema. A March 2025 amendment trimmed personal data fields yet preserved unique identifiers, saving firms USD 12 million yearly while keeping regulators fully informed. Similar pressure builds in Europe, where MiFIR 3 introduces digital-token identifiers and new effective-date tags, compelling upgrades to handle richer payloads. Institutions, therefore, treat surveillance as foundational compliance infrastructure rather than optional risk tooling.
AI/ML-Powered Anomaly Detection Reducing False Positives and Cost
Next-generation platforms move beyond static thresholds toward machine-learning models that learn trader behavior. Detection rates exceed 97% while false positives fall below 1%. Natural-language processing links voice and chat surveillance to trade data so that seemingly benign orders can be tied back to collusive communications. Regulators stress explainability: algorithms must log the features that triggered an alert so supervisors can audit decisions. As a result, vendors now embed transparent model-risk dashboards and human-in-the-loop workflows.
Cloud-Native SaaS Delivery Lowering Total Cost of Ownership
Financial firms increasingly offload compute-heavy analytics to cloud providers, scaling CPU and GPU capacity during volatile sessions without buying hardware. Elastic pricing cuts capital budgets while automatic patching eases cybersecurity burdens. Yet institutions must keep sensitive identifiers within national borders, driving hybrid models that retain raw data on-premise and burst anonymized data to the cloud for model training.
Restraints Impact Analysis*
| Restraint | (~) % Impact on CAGR Forecast | Geographic Relevance | Impact Timeline |
|---|---|---|---|
| High integration complexity with legacy front-, middle- and back-office systems | -2.1% | Global, acute in established financial centers | Medium term (2-4 years) |
| Shortage of trade-surveillance data-science talent | -1.8% | Global, severe in emerging markets | Long term (≥ 4 years) |
| Fragmented global rule sets leading to costly rule-mapping | -0.8% | EU and North America regulatory markets | Long term (≥ 4 years) |
| Rising privacy regulations limiting holistic surveillance data pooling | -0.6% | Global, with concentration in regulated industries | Medium term (2-4 years) |
| Source: Mordor Intelligence | |||
High Integration Complexity with Legacy Front-, Middle- and Back-Office Systems
Nearly 92% of UK institutions still rely on mainframes that batch-process trade files overnight, a cadence incompatible with second-by-second surveillance. Bridging message protocols, field taxonomies, and clock synchronisation requires multi-year roadmaps, often involving 50-plus internal teams. Disconnects cause incomplete data feeds and missed alerts, forcing parallel run periods where old and new platforms coexist until regulators certify data integrity.
Shortage of Trade-Surveillance Data-Science Talent
Demand for professionals who understand both capital-market microstructure and advanced statistics far outstrips supply. Industry studies highlight deficits across blockchain analytics, natural-language processing, and graph-network modelling. Vendors launch training academies to close the gap, but in the short term, banks lean on managed services that bundle model maintenance and regulatory updates, raising vendor-dependency risk for smaller firms.
*Our forecasts treat driver/restraint impacts as directional, not additive. The impact forecasts reflect baseline growth, mix effects, and variable interactions.
Segment Analysis
By Component: Solutions Drive Market Foundation
Solutions held 61.55% of the trade surveillance systems market share in 2025, underscoring the primacy of end-to-end platforms that integrate order, execution, and communications data. The segment benefits from high switching costs and continual rule updates, positioning vendors for recurring licensing revenue. The trade surveillance systems market size attached to solutions is projected to lift steadily as banks renew enterprise licences before key regulatory deadlines.
Services, though smaller, grow at 18% CAGR as institutions outsource model tuning and regulatory mapping. Managed-service contracts fill in-house talent gaps and provide 24-hour coverage across regions. Providers bundle implementation, behavioural-model calibration, and post-go-live testing, a package that mid-tier brokers consider more cost-effective than hiring specialised quants.


By Deployment Mode: Cloud Migration Accelerates
On-premise deployments retained a 54.15% share in 2025, reflecting data-sovereignty obligations and auditor preference for systems housed within firewalls. Yet the trade surveillance systems market size attributed to cloud offerings is set to rise fastest, expanding at 19.05% CAGR through 2031 as regulators issue clarifications that encrypted data may reside in approved jurisdictions.
Cloud providers offer elastic compute for back-testing millions of scenarios overnight, an ability that on-premise grids struggle to replicate without oversizing. Hybrid models gain traction because they keep personally identifiable information in local data centres while diverting de-identified trade records to cloud clusters for heavy analytics. Successful pilots in Singapore and Canada demonstrate that such architectures pass regulatory inspection when encryption keys remain client-controlled.
By Trading Type: Digital Assets Transform Surveillance
Equities, with 32.10% of the trade surveillance systems market share in 2025, remain the anchor segment thanks to decades-old reporting rules. Fixed income, derivatives, and FX each add layers of complexity, especially when OTC trades must be matched to exchange prints for full lifecycle visibility.
Digital assets represent the fastest-growing slice at 19.7% CAGR. Platforms must ingest blockchain events, map wallet addresses to legal entities, and detect cross-chain wash trading. Under MiCA, European service providers must show continuous monitoring of decentralised exchanges, driving demand for token-aware analytics that score smart contracts and flag suspicious liquidity pools. The trade surveillance systems market size tied to crypto monitoring could double by the decade’s end as tokenisation of real-world assets broadens the perimeter.
By End-user: Buy-Side Institutions Drive Growth
Sell-side firms controlled 39.65% of the trade surveillance systems market share in 2025, a legacy of long-standing best-execution and market-making obligations. Their complex order flows and proprietary trading desks require multi-layered alert logic and extensive audit trails.
Buy-side entities expand spending at an 18.2% CAGR. Asset managers see surveillance as proof of fiduciary duty and a safeguard against internal misuse of information. Pension funds and insurers integrate alerts into portfolio-management systems to catch crossing violations and unauthorised short selling. These firms previously relied on brokers’ controls, but regulatory guidance now emphasises direct oversight, fuelling vendor pipelines.
By Organisation Size: FinTech Exchanges Lead Innovation
Tier-1 global banks accounted for 35.65% of the trade surveillance systems market size in 2025 and continue to allocate nine-figure budgets to maintain enterprise licences, redundancy zones, and global support desks. Tier-2 and regional brokers typically adopt scaled-down versions, balancing compliance needs with budget limits.
FinTech and crypto exchanges grow revenue at 21.4% CAGR, propelled by venture funding and the race to win institutional crypto order flow. They require cloud-native, API-centric tools that integrate with decentralised protocols and deliver risk scores in seconds, supporting rapid asset listings and high throughput. Vendor blueprints often position these exchanges as launch customers for innovative features later backported to traditional markets.
Geography Analysis
Asia-Pacific records the fastest regional CAGR of 17.6%, moving from follower to front-runner in supervisory technology. Monetary Authority of Singapore pilots AI-based AML-CFT models that feed into trade-surveillance controls, creating reference implementations that other regulators monitor closely. Hong Kong mandates surveillance coverage for licensed virtual-asset operators, lifting spending among exchanges and prime brokers.
North America remains the largest contributor with a 33.92% share, driven by CAT and planned short-sale flags that take effect mid-2025. The United States benefits from vendor proximity to major equity and options venues, while Canada accelerates investment as cross-listing volumes climb.
Europe holds a mature adopter profile where MiFID II and EMIR already embed strict transaction reporting. Upcoming MiFIR 3 changes introduce digital-token identifiers that widen the regulatory perimeter. Continental banks upgrade systems to reconcile trade identifiers across business lines, and UK firms run parallel processes to manage post-Brexit divergence.

Competitive Landscape
The market shows moderate consolidation. A small cohort of global vendors supplies multi-asset coverage, AI libraries, and regulatory content updates on a rolling basis. NICE Ltd posted USD 2.7 billion in 2024 revenue, with cloud sales advancing 25% to USD 2 billion, signalling strong uptake of hosted surveillance. [3]NICE Ltd, “Annual Report 2024,” nice.com Nasdaq’s SMARTS platform covers more than 200 markets worldwide and ships pre-configured behaviours for spoofing, cross-product manipulation, and crypto wash trading. [4]Nasdaq, “Trade Surveillance & Market Abuse Software (SMARTS),” nasdaq.com
Strategic alliances between surveillance vendors and hyperscale clouds shorten deployment cycles and bundle encryption, key management, and compliance certifications. Patents rise in graph analytics and blockchain forensics, areas where start-ups such as Solidus Labs specialise in wallet risk scoring and cross-chain heuristics. M&A activity targets communication-surveillance specialists so that trade and voice data converge in one conduct-risk console. Nevertheless, new entrants leverage open-source big-data frameworks to undercut incumbents on price, keeping competitive intensity elevated.
Institutions increasingly demand explainability. Vendors now embed visual model interpretability, scenario replay, and policy-version control to satisfy audit queries. Product roadmaps emphasise SaaS subscription models and marketplace connectors that ingest unstructured data so compliance teams can pivot quickly when new products—such as tokenised bonds—launch.
Trade Surveillance Systems Industry Leaders
NICE Ltd.
Nasdaq Inc.
BAE Systems Digital Intelligence
Fidelity National Information Services Inc. (FIS)
Software AG
- *Disclaimer: Major Players sorted in no particular order

Recent Industry Developments
- March 2025: The SEC amended the National Market System Plan for CAT, removing customer names and addresses yet retaining unique identifiers, cutting annual compliance cost by USD 12 million while sustaining surveillance reach.
- February 2025: NICE Ltd reported 2024 revenue of USD 2.7 billion, a 15% gain year on year, with cloud revenue up 25% to USD 2 billion.
- February 2025: Synpulse highlighted Singapore’s AI-driven AML-CFT surveillance project and Hong Kong’s virtual-asset licensing as primary Asia-Pacific growth engines.
- January 2025: The European Commission adopted technical standards under MiCA, setting detailed procedures for preventing market abuse in crypto-asset markets.
- January 2025: Solidus Labs launched the Trade Surveillance Academy to address the global shortage of market-abuse specialists.
- December 2024: SCB 10X summarised FATF recommendations on the Travel Rule for virtual-asset service providers.
- November 2024: NICE Actimize was named a category leader in Chartis Research’s Communications Surveillance Solutions report.


Global Trade Surveillance Systems Market Report Scope
Trade surveillance is the process of setting up a surveillance system that watches and finds signs of market manipulation, fraud, behavioral patterning, and other things. This makes sure that abusive, manipulative, or illegal trading practices in the securities markets are stopped and looked into.
The trade surveillance systems market is segmented by component (solutions, services), deployment (cloud-based, on-premise), and geography (North America, Europe, Asia-Pacific, the Middle East and Africa, and Latin America). The study's scope also includes the impact of COVID-19 on the market and affected segments. Further, the disruption factors that will impact the market's growth in the near future have been covered in the study regarding drivers and restraints. The market sizes and forecasts are provided in terms of value (USD million) for all the above segments.
| Solutions |
| Services |
| On-Premise |
| Cloud |
| Equities |
| Fixed Income |
| Derivatives |
| Foreign Exchange |
| Commodities |
| Digital Assets |
| Sell-Side Institutions |
| Buy-Side Institutions |
| Market Venues and Exchanges |
| Regulators and SROs |
| Tier-1 Global Banks |
| Tier-2 and Mid-Sized Firms |
| Small FIs and Broker-Dealers |
| FinTech and Crypto Exchanges |
| North America | United States | |
| Canada | ||
| Mexico | ||
| South America | Brazil | |
| Argentina | ||
| Chile | ||
| Rest of South America | ||
| Europe | Germany | |
| United Kingdom | ||
| France | ||
| Italy | ||
| Spain | ||
| Russia | ||
| Rest of Europe | ||
| Asia-Pacific | China | |
| India | ||
| Japan | ||
| South Korea | ||
| Australia | ||
| Singapore | ||
| Malaysia | ||
| Rest of Asia-Pacific | ||
| Middle East and Africa | Middle East | United Arab Emirates |
| Saudi Arabia | ||
| Turkey | ||
| Rest of Middle East | ||
| Africa | South Africa | |
| Nigeria | ||
| Rest of Africa | ||
| By Component | Solutions | ||
| Services | |||
| By Deployment Mode | On-Premise | ||
| Cloud | |||
| By Trading Type | Equities | ||
| Fixed Income | |||
| Derivatives | |||
| Foreign Exchange | |||
| Commodities | |||
| Digital Assets | |||
| By End-user | Sell-Side Institutions | ||
| Buy-Side Institutions | |||
| Market Venues and Exchanges | |||
| Regulators and SROs | |||
| By Organisation Size | Tier-1 Global Banks | ||
| Tier-2 and Mid-Sized Firms | |||
| Small FIs and Broker-Dealers | |||
| FinTech and Crypto Exchanges | |||
| By Geography | North America | United States | |
| Canada | |||
| Mexico | |||
| South America | Brazil | ||
| Argentina | |||
| Chile | |||
| Rest of South America | |||
| Europe | Germany | ||
| United Kingdom | |||
| France | |||
| Italy | |||
| Spain | |||
| Russia | |||
| Rest of Europe | |||
| Asia-Pacific | China | ||
| India | |||
| Japan | |||
| South Korea | |||
| Australia | |||
| Singapore | |||
| Malaysia | |||
| Rest of Asia-Pacific | |||
| Middle East and Africa | Middle East | United Arab Emirates | |
| Saudi Arabia | |||
| Turkey | |||
| Rest of Middle East | |||
| Africa | South Africa | ||
| Nigeria | |||
| Rest of Africa | |||


Key Questions Answered in the Report
What is the current size of the trade surveillance systems market?
The trade surveillance systems market size stands at USD 3.32 billion in 2026 and is forecast to grow to USD 7.29 billion by 2031.
Which region leads the adoption of trade surveillance solutions?
North America holds the largest regional share at 33.92%, driven by the Consolidated Audit Trail and other transparency mandates.
Why are digital assets a key growth area for surveillance vendors?
Crypto-asset markets expand at 19.7% CAGR, and new regulations such as MiCA require exchanges to detect wash trading and cross-chain abuse.
How does cloud deployment benefit compliance teams?
Cloud-native architectures scale analytics capacity on demand, cut upfront hardware spend, and provide rapid access to AI services while supporting hybrid data-sovereignty models.
What is the main challenge when upgrading legacy surveillance platforms?
Integrating real-time analytics with batch-oriented mainframe systems demands complex data-mapping and clock-synchronisation work across multiple internal teams.
Is there a skills gap in trade surveillance?
Yes, firms struggle to hire specialists who combine market-structure knowledge with data-science expertise, which boosts demand for managed surveillance services.
Page last updated on:


