Electronic Article Surveillance (EAS) Market Size and Share
Market Overview
| Study Period | 2020 - 2031 |
|---|---|
| Market Size (2026) | USD 1.25 Billion |
| Market Size (2031) | USD 1.44 Billion |
| Growth Rate (2026 - 2031) | 2.87% CAGR |
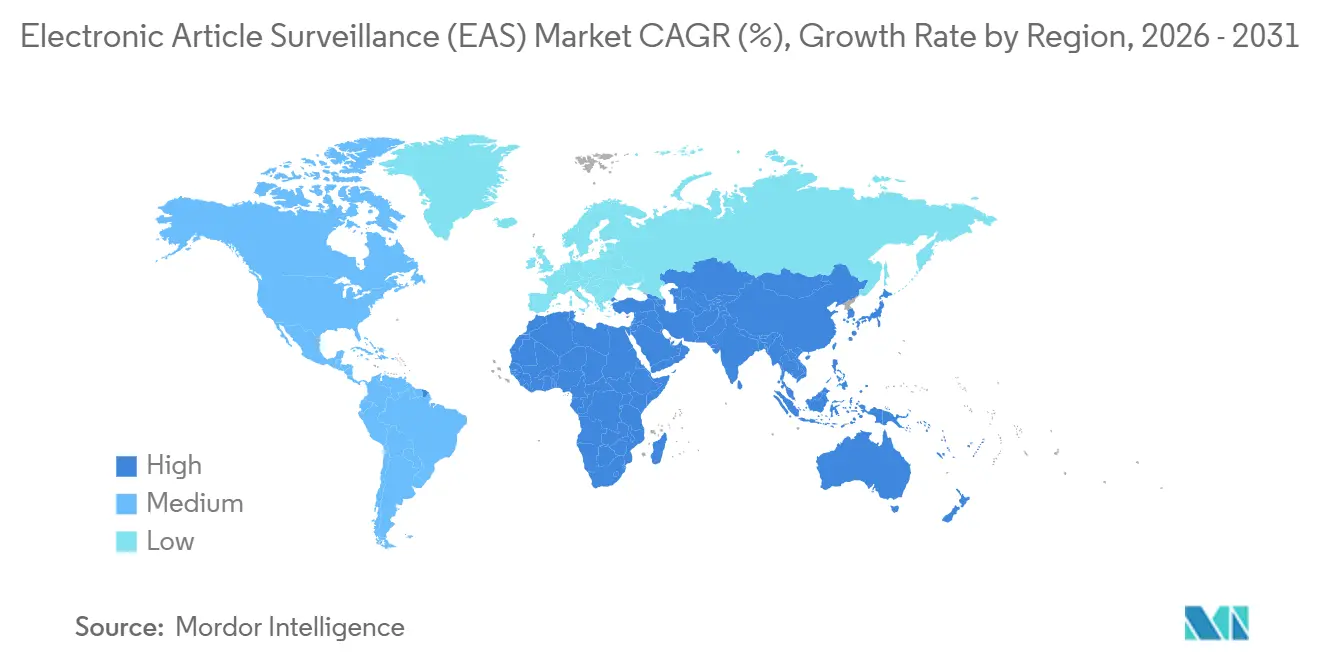
| Fastest Growing Market | Middle East |
| Largest Market | Asia Pacific |
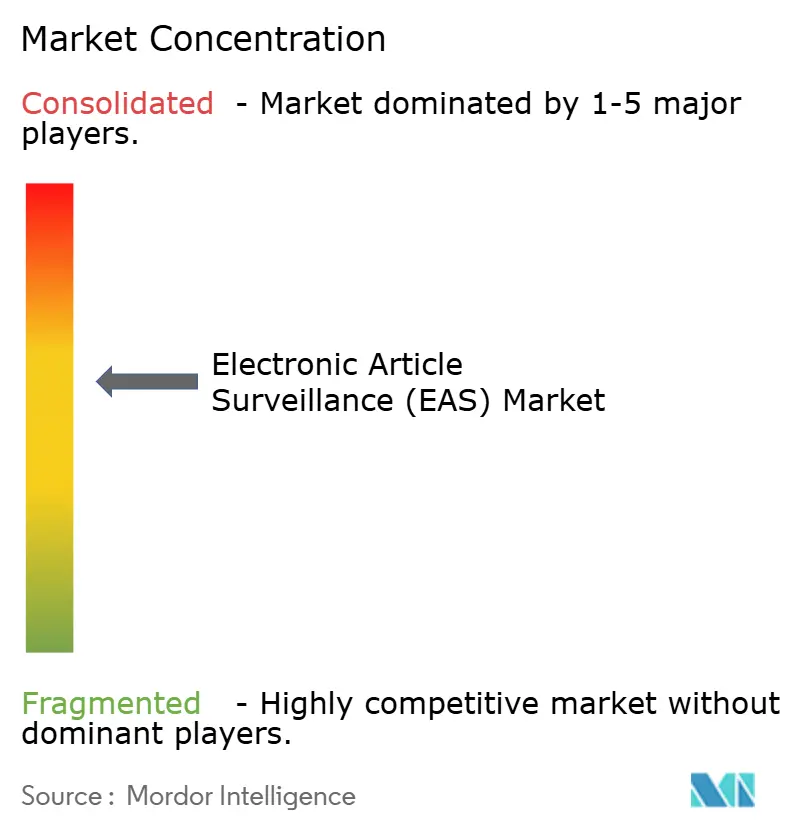
| Market Concentration | Medium |
Major Players*Disclaimer: Major Players sorted in no particular order Image © Mordor Intelligence. Reuse requires attribution under CC BY 4.0. | |
Electronic Article Surveillance (EAS) Market Analysis by Mordor Intelligence
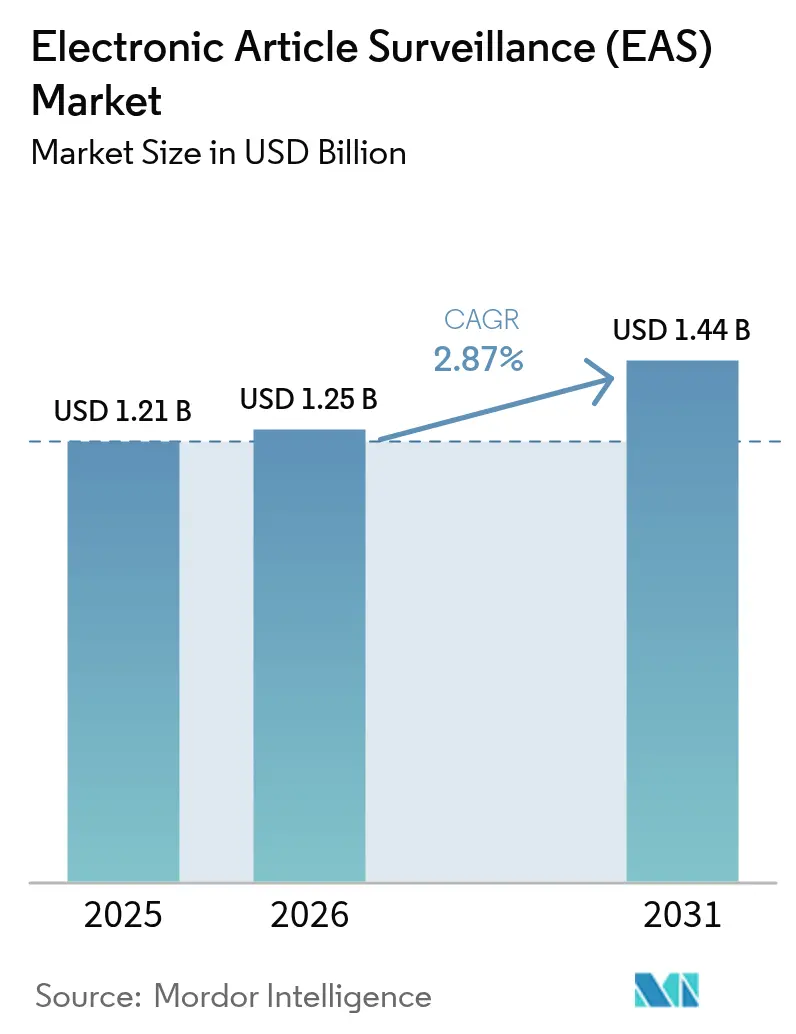
The Electronic Article Surveillance market size is projected to be USD 1.21 billion in 2025, USD 1.25 billion in 2026, and reach USD 1.44 billion by 2031, growing at a CAGR of 2.87% from 2026 to 2031. Shrink-control budgets are stabilizing after the pandemic, yet the shift from legacy electromagnetic hardware toward RFID-enabled hybrids continues to unlock incremental demand. Tier-1 retailers have started to view loss-prevention hardware as a data source for inventory accuracy rather than a stand-alone security tool, prompting upgrades that marry exit-gate protection with shelf-level visibility. At the same time, the capital required for item-level convergence restrains mid-tier adoption, which keeps the overall growth curve moderate. Competitive dynamics are changing as vendors pivot to subscription software, while sustainability regulations reward printable, battery-free labels that fit circular-packaging goals.
Key Report Takeaways
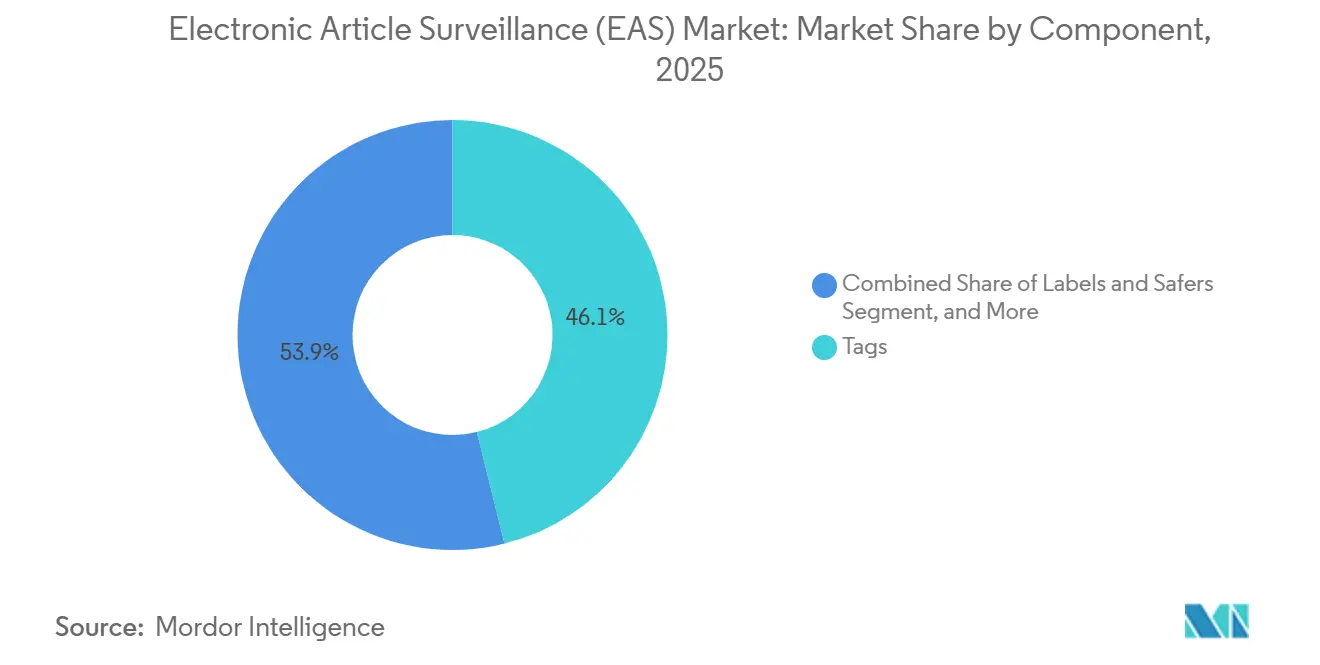
- By component, tags led with 46.11% of 2025 revenue, while labels and safers are projected to post the quickest expansion at a 3.65% CAGR through 2031.
- By technology, radio-frequency systems captured 55.37% of 2025 sales, whereas RFID-EAS hybrids are forecast to grow the fastest at a 3.22% CAGR over 2026-2031.
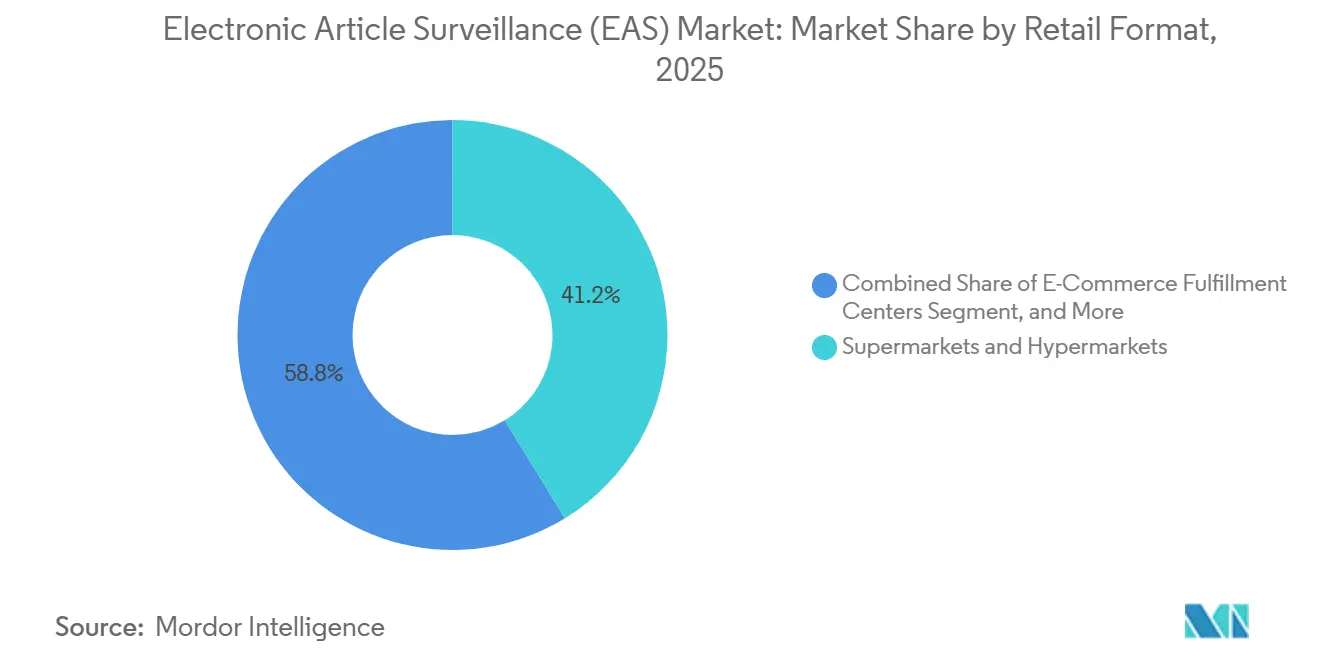
- By retail format, supermarkets and hypermarkets accounted for 41.23% of 2025 demand, yet e-commerce fulfillment centers are expected to advance at the highest 3.47% CAGR to 2031.
- By end-user, apparel and fashion accessories commanded 38.71% of 2025 spending, while cosmetics and pharmacies are poised to expand most rapidly at a 3.53% CAGR through 2031.
- By geography, Asia-Pacific generated the largest 34.58% share of 2025 revenue, whereas the Middle East is set to record the fastest regional growth at a 3.78% CAGR during the forecast period.
Note: Market size and forecast figures in this report are generated using Mordor Intelligence’s proprietary estimation framework, updated with the latest available data and insights as of 2026.
Global Electronic Article Surveillance (EAS) Market Trends and Insights
Drivers Impact Analysis*
| Driver | (~) % Impact on CAGR Forecast | Geographic Relevance | Impact Timeline |
|---|---|---|---|
| Continued Shrink-Control Focus Among Tier-1 Retailers | +0.80% | Global, with concentration in North America and Europe | Medium term (2-4 years) |
| Mandates for Source-Tagging by Consumer-Goods Brands | +0.60% | North America, Europe, APAC core markets | Medium term (2-4 years) |
| Migration From EM to RF/RFID Hybrid Systems | +0.50% | Global, led by North America and Asia-Pacific | Long term (≥ 4 years) |
| Post-Pandemic Surge in Self-Checkout Lanes | +0.40% | North America, Europe, select APAC urban centers | Short term (≤ 2 years) |
| AI-Assisted Smart Antenna Deployment in Micro-Format Stores | +0.30% | North America, Europe, Japan, South Korea | Medium term (2-4 years) |
| Battery-Free Printable RFID-EAS Labels Enabling Circular Packaging | +0.20% | Europe, North America, with spillover to APAC | Long term (≥ 4 years) |
| Source: Mordor Intelligence | |||


Continued Shrink-Control Focus Among Tier-1 Retailers
Organized retail-crime networks became more sophisticated during 2024 and 2025, pushing targets such as Target and Kroger to layer EAS pedestals with analytics that route real-time alerts to mobile devices. A steady 1.6% shrinkage rate equated to USD 112.1 billion in U.S. losses during 2022, and preliminary 2025 audits show minimal improvement despite higher spending.[1]National Retail Federation, “National Retail Security Survey 2023,” NRF.COM Management teams therefore prioritize systems that couple alarms with item-level data to pinpoint vulnerable SKUs. By feeding EAS events into enterprise resource-planning platforms, retailers generate heat maps of theft-prone aisles, a capability impossible with legacy electromagnetic gates. Federal law-enforcement support for multi-state task forces, rolled out in 2024, further underscores the strategic importance of shrink reduction.[2]Federal Bureau of Investigation, “Retail Crime Trends 2024,” FBI.GOV
Mandates for Source-Tagging by Consumer-Goods Brands
Walmart’s March 2025 requirement that suppliers embed RFID-EAS tags in home goods and electronics shifted tagging responsibilities upstream, accelerating adoption across manufacturing lines. Consumer-products leaders such as Procter and Gamble now fuse theft deterrence with Europe’s Digital Product Passport rules, encoding lifecycle data inside each tag.[3]European Commission, “Digital Product Passport Regulation,” EC.EUROPA.EU Source-tagging slashes in-store labor because merchandise arrives shelf-ready, while unique identifiers let brands detect gray-market diversion. Standards group GS1 launched a unified encoding guideline in 2025, curbing interoperability risk and smoothing expansion beyond North American anchors. As mandates ripple into Asia-Pacific supplier bases, economies of scale are driving per-tag costs below USD 0.05.
Migration From EM to RF and RFID Hybrid Systems
Radio-frequency and RFID hybrids now displace electromagnetic (EM) pedestals as retailers seek serialized data alongside alarm events. Avery Dennison disclosed an 18% jump in hybrid-label shipments in 2025, largely to apparel specialists that want single infrastructure for inventory and loss control. Standards work published in 2024 by the IEEE specifies interference-mitigation steps for dense wireless environments, eliminating a long-standing barrier to RF in urban malls.[4]Institute of Electrical and Electronics Engineers, “RF Interference Mitigation Standards for Retail,” IEEE.ORG Grocery chains still retain EM at checkout lanes where metal packaging hinders RF, but overhead readers supplement back-room accuracy. Early adopters report sub-24-month payback once labor savings from automated cycle counts are factored.
Post-Pandemic Surge in Self-Checkout Lanes
Labor shortages and contactless preferences boosted self-checkout kiosks between 2020 and 2023, but unattended lanes invite new theft vectors. Retailers now pair weight sensors, computer vision, and RFID tunnels to cross-reference scanned items with tagged inventory. Weis Markets cut scan-avoidance incidents by 23% within six months of deploying AI monitoring in 2024. Yet, backlash surfaced when Dollar General removed self-checkout from 12,000 stores in 2024 due to soaring shrink, illustrating divergent strategies. Vendors therefore emphasize modular platforms that function in both manned and unmanned environments, hedging against format-specific reversals.
Restraints Impact Analysis*
| Restraint | (~) % Impact on CAGR Forecast | Geographic Relevance | Impact Timeline |
|---|---|---|---|
| High CAPEX for True Item-Level RFID-EAS Convergence | -0.50% | Global, most acute in North America and Europe | Medium term (2-4 years) |
| Declining Mall Traffic in Western Markets | -0.30% | North America and Europe | Short term (≤ 2 years) |
| Limited Read-Range Reliability Around Metals and Liquids | -0.20% | Global, particularly supermarkets and hypermarkets | Long term (≥ 4 years) |
| Growing Pushback on Data-Privacy in Computer-Vision Backed EAS | -0.20% | Europe, North America, with emerging scrutiny in APAC | Medium term (2-4 years) |
| Source: Mordor Intelligence | |||
High CAPEX for True Item-Level RFID-EAS Convergence
Item-level infrastructure costs USD 500,000 to USD 1 million per big-box store, excluding ongoing tag expenses, which places the upgrade outside the reach of chains operating on sub-2% margins. Vendors have introduced leasing models, yet adoption clusters among cash-rich banners that can commit to multi-year terms. Smaller EAS specialists lack semiconductor design budgets, ceding chipset control to firms such as NXP and Impinj that prioritize supply-chain clients over retail security. Until hardware costs fall sharply, many mid-tier operators will remain on mixed EM and RF estates.
Declining Mall Traffic in Western Markets
U.S. and Western European mall visits were 12% below 2019 levels in 2025, compressing the addressable base for pedestal-centric installations. Specialty apparel tenants, once heavy users of EAS, are closing suburban stores and shifting inventory online, where fulfillment centers need conveyor-grade tunnels instead of doorway pedestals. Open-air lifestyle centers and luxury malls are bright spots, but they cannot offset the wider contraction. Vendors therefore reposition toward supermarkets, pharmacies, and convenience chains, all formats that spend less per door and temper overall growth.
*Our forecasts treat driver/restraint impacts as directional, not additive. The impact forecasts reflect baseline growth, mix effects, and variable interactions.
Segment Analysis
By Component: Labels and Safers Lead Innovation Cycle
Labels and safers accounted for the fastest growth trajectory despite tags owning 46.11% of 2025 revenue within the Electronic Article Surveillance market size. Printable, battery-free RFID-EAS labels, co-developed by Avery Dennison and Wiliot, align with European circular-economy rules and cut recycling labor. Asia-Pacific tag factories now undercut global pricing, accelerating uptake in India and Southeast Asia, where retailers operate on slim margins.
Antennas are migrating from fixed-frequency pedestals to software-defined arrays that can hop between RF, RFID, and Bluetooth, letting retailers run loss prevention and proximity marketing on the same hardware. Deactivator technology increasingly embeds inside point-of-sale scanners, freeing counter space and easing staff workflows, an approach Nedap piloted in European groceries during 2024. While reusable hard tags stay relevant in liquor and luxury fashion, disposable labels will keep eroding share as unit prices slide and sustainability pressure rises.


By Technology: RFID-EAS Hybrids Reshape Value Proposition
Radio-frequency systems captured 55.37% of 2025 revenue, yet RFID-EAS hybrids are set to post a 3.22% CAGR, the strongest momentum within the Electronic Article Surveillance market. Walmart’s supplier mandate embedded EPC Gen2 chips into RF-compatible labels, giving retailers exit-gate alarms plus perpetual-inventory data in one asset. Electromagnetic detection lingers in grocery aisles heavy with metal cans, but the lack of serialization restricts its role in omnichannel fulfillment. Chipless RFID alternatives, newly standardized by IEEE in 2024, promise USD 0.02 tags for fast-fashion SKUs yet remain constrained by short read ranges.
Retailers rarely execute a one-time migration. Many estates blend EM at the front end, RF gates in apparel, and overhead RFID in backrooms, requiring middleware that normalizes alerts across protocols. This complexity creates service revenue for vendors while lengthening replacement cycles because chains avoid single-vendor dependency.
By Retail Format: E-Commerce Fulfillment Centers Emerge as Growth Frontier
Supermarkets and hypermarkets led 41.23% of 2025 demand, but e-commerce fulfillment centers will record a 3.47% CAGR, the fastest among formats in the Electronic Article Surveillance market. Amazon’s disclosure of USD 1 billion annual shrink inside warehouses convinced operators to trial RFID tunnels able to scan 1,200 tags per minute. Discount stores represent 18% of revenue, yet capital scarcity forces selective deployments, mostly in urban hotspots with theft rates above 3%.
Specialty chains integrate EAS with clienteling apps that surface item location data to associates, reducing internal diversion. Convenience stores now use wireless pedestals that bolt to the floor without trenching, a 60% installation-cost saving introduced by Gunnebo Gateway in 2024. Format-specific alarm protocols, silent in grocery but audible in electronics, further drive software customization revenue.
By End-User: Cosmetics and Pharmacies Accelerate Amid Crime Surge
Apparel and accessories spent 38.71% of 2025 outlays, yet cosmetics and pharmacies will expand at 3.53% CAGR, shaping end-user momentum for the Electronic Article Surveillance market share. The FBI recorded a 34% jump in pharmacy theft during 2024, prompting CVS and Walgreens to tag products priced above USD 10. Miniaturized labels that bond on curved glass now protect lipsticks and fragrances without harming packaging aesthetics.
Consumer-electronics retailers pilot smartphone-based self-verification, an approach Best Buy tested in 2025 to marry convenience and security. Liquor outlets deploy premium hard tags with integrated age-verification logic, while supermarkets roll EAS into analytics dashboards that rank SKUs by shrink propensity. Managed loss-prevention-as-a-service contracts bundle hardware, monitoring, and analytics into operating expenses, shrinking the upgrade hurdle for smaller pharmacy chains.
Geography Analysis
Asia-Pacific generated 34.58% of 2025 revenue for the Electronic Article Surveillance market, underpinned by rapid store openings in China, India, and Southeast Asia. China’s USD 6.3 trillion 2024 retail turnover pairs with government digital-supply-chain priorities, pushing domestic brands toward RFID tags that satisfy traceability mandates. In India, organized retail penetration is below 15%, yet metro-area hypermarkets deploy EAS to guard high-ticket electronics as the Production-Linked Incentive scheme swells inventory values. Japan and South Korea, facing labor scarcity, accelerate EM-to-RFID conversions that free staff for sales roles. Indonesia, Thailand, and Vietnam remain early adopters but log double-digit growth as international operators bake loss prevention into greenfield builds.
The Middle East will be the fastest-growing region at 3.78% CAGR through 2031 thanks to Saudi Vision 2030 and the United Arab Emirates’ luxury-mall boom. Saudi Arabia’s Public Investment Fund earmarked USD 40 billion for retail tourism, ensuring hundreds of new stores will specify RFID-ready gates. Dubai malls surpassed pre-pandemic traffic in 2025, prompting premium boutiques to integrate EAS with VIP concierge analytics. Turkey upgrades legacy EM while inflation stabilizes, and Gulf duty-free formats trial Bluetooth-enabled tags that double as marketing beacons.
North America and Europe, with 28% and 22% of 2025 revenue respectively, rely on technology refresh cycles rather than store-count growth. EM-to-RF replacements and RFID overlays generate mid-single-digit expansion even as physical footprints plateau. South America and Africa together account for 16% of global sales, but affordability constraints confine adoption to urban premium stores. Brazilian retailers preserved loss-prevention budgets during 2024 contraction because theft rises in downturns. South Africa leads the continent, whereas Nigeria and Egypt remain nascent, hampered by informal retail dominance and weak certification frameworks.

Competitive Landscape
The Electronic Article Surveillance market remains moderately concentrated: Sensormatic Solutions, Checkpoint Systems, Nedap, and Avery Dennison control roughly 40% to 45% of global revenue, while the balance is split among regional or component-focused players. Incumbents are shifting from commoditized hardware toward software subscriptions; Sensormatic disclosed that services rose to 28% of retail revenue in 2025, up from 19% two years earlier. Patent velocity reflects the pivot: the U.S. Patent and Trademark Office granted 47 EAS-related patents in 2024, with filings on AI-driven antenna tuning and biodegradable substrates.
Cost-engineered offerings target discount chains and emerging markets, where theft growth finally justifies investment. Ketec and All-Tag market stripped-down RF labels priced under USD 0.03, sacrificing analytics hooks to meet razor-thin budgets. Semiconductor heavyweights such as NXP and Impinj integrate EAS, RFID, and NFC on single chips that support woven-textile tags, widening form-factor options. Computer-vision startups Veesion and Everseen position AI cameras as tag alternatives, but privacy constraints in Europe and California check scale.
Strategic alliances tighten the ecosystem. Avery Dennison partnered with Microsoft Azure in 2024 to feed EAS telemetry into cloud analytics that correlate shrink with promotions, weather, and staffing. Checkpoint acquired a European RFID-label plant in November 2025, adding 40% capacity to meet surging source-tagging orders. Nedap won a 1,200-store European grocery rollout in July 2025, its biggest RFID-EAS contract to date. Sensormatic launched an edge-AI smart-antenna suite in January 2026, promising 35% fewer false alarms, and plans a 500-store North American deployment this year.
Electronic Article Surveillance (EAS) Industry Leaders
Sensormatic Solutions (Johnson Controls International PLC)
Nedap NV
Avery Dennison Corporation
Ketec Inc.
Checkpoint Systems Inc. (CCL Industries Inc.)
- *Disclaimer: Major Players sorted in no particular order

Recent Industry Developments
- January 2026: Sensormatic Solutions unveiled an AI-powered smart-antenna platform with edge processing that trims false alarms by 35%, rolling out to 500 North American stores in H1 2026.
- November 2025: Checkpoint Systems bought a European RFID-label manufacturer, boosting output capacity by 40% amid component shortages.
- September 2025: Avery Dennison partnered with Wiliot to commercialize battery-free RFID-EAS labels harvesting ambient radio energy, with pilots across three apparel brands.
- July 2025: Nedap secured a contract to deploy RFID-EAS hybrids in 1,200 pan-European grocery stores, completion slated for 2027.


Global Electronic Article Surveillance (EAS) Market Report Scope
The Electronic Article Surveillance Market Report is Segmented by Component (Tags, Antennas, Deactivators/Detachers, Labels and Safers), Technology (Acousto-Magnetic, Electromagnetic, Radio-Frequency, RFID-EAS Hybrids, Microwave), Retail Format (Supermarkets and Hypermarkets, Discount Stores, Specialty Retailers, Convenience Stores, E-Commerce Fulfillment Centers), End-User (Apparel and Fashion, Cosmetics and Pharmacies, Supermarkets and Mass-Merchandisers, Consumer Electronics and DIY, Liquor and Specialty Retail), and Geography (North America, South America, Europe, Asia-Pacific, Middle East, Africa). The Market Forecasts are Provided in Terms of Value (USD).
| Tags |
| Antennas |
| Deactivators / Detachers |
| Labels and Safers |
| Acousto-Magnetic (AM) |
| Electromagnetic (EM) |
| Radio-Frequency (RF) |
| RFID-EAS Hybrids |
| Microwave and Other Niches |
| Supermarkets and Hypermarkets |
| Discount Stores and Dollar Stores |
| Specialty Retailers |
| Convenience Stores |
| E-Commerce Fulfillment Centers |
| Apparel and Fashion Accessories |
| Cosmetics and Pharmacies |
| Supermarkets, Hypermarkets and Mass-Merchandisers |
| Consumer Electronics and DIY Stores |
| Liquor and Specialty Retail |
| North America | United States |
| Canada | |
| Mexico | |
| South America | Brazil |
| Argentina | |
| Rest of South America | |
| Europe | Germany |
| United Kingdom | |
| France | |
| Italy | |
| Spain | |
| Rest of Europe | |
| Asia-Pacific | China |
| Japan | |
| India | |
| South Korea | |
| Southeast Asia | |
| Rest of Asia-Pacific | |
| Middle East | Saudi Arabia |
| United Arab Emirates | |
| Turkey | |
| Rest of Middle East | |
| Africa | South Africa |
| Nigeria | |
| Egypt | |
| Rest of Africa |
| By Component | Tags | |
| Antennas | ||
| Deactivators / Detachers | ||
| Labels and Safers | ||
| By Technology | Acousto-Magnetic (AM) | |
| Electromagnetic (EM) | ||
| Radio-Frequency (RF) | ||
| RFID-EAS Hybrids | ||
| Microwave and Other Niches | ||
| By Retail Format | Supermarkets and Hypermarkets | |
| Discount Stores and Dollar Stores | ||
| Specialty Retailers | ||
| Convenience Stores | ||
| E-Commerce Fulfillment Centers | ||
| By End-User | Apparel and Fashion Accessories | |
| Cosmetics and Pharmacies | ||
| Supermarkets, Hypermarkets and Mass-Merchandisers | ||
| Consumer Electronics and DIY Stores | ||
| Liquor and Specialty Retail | ||
| By Geography | North America | United States |
| Canada | ||
| Mexico | ||
| South America | Brazil | |
| Argentina | ||
| Rest of South America | ||
| Europe | Germany | |
| United Kingdom | ||
| France | ||
| Italy | ||
| Spain | ||
| Rest of Europe | ||
| Asia-Pacific | China | |
| Japan | ||
| India | ||
| South Korea | ||
| Southeast Asia | ||
| Rest of Asia-Pacific | ||
| Middle East | Saudi Arabia | |
| United Arab Emirates | ||
| Turkey | ||
| Rest of Middle East | ||
| Africa | South Africa | |
| Nigeria | ||
| Egypt | ||
| Rest of Africa | ||


Key Questions Answered in the Report
How fast is the Electronic Article Surveillance market expected to grow from 2026 to 2031?
It is projected to expand at a 2.87% CAGR, rising from USD 1.25 billion in 2026 to USD 1.44 billion by 2031.
Which component is witnessing the quickest adoption curve?
Labels and safers, supported by battery-free printable designs, are forecast to grow at 3.65% CAGR through 2031.
Why are RFID-EAS hybrids gaining traction over electromagnetic systems?
Hybrids provide both theft-deterrence alarms and serialized inventory data, yielding faster payback and supporting omnichannel fulfillment.
Which retail format is set to record the strongest growth?
E-commerce fulfillment centers will lead formats with a 3.47% CAGR as operators tackle warehouse pilferage.
What is the competitive concentration in this space?
The top four vendors hold about 40% to 45% of revenue, indicating a moderate concentration with ample room for niche innovators.
Page last updated on:


