Thermography / Infrared Testing Market Size and Share
Market Overview
| Study Period | 2019 - 2030 |
|---|---|
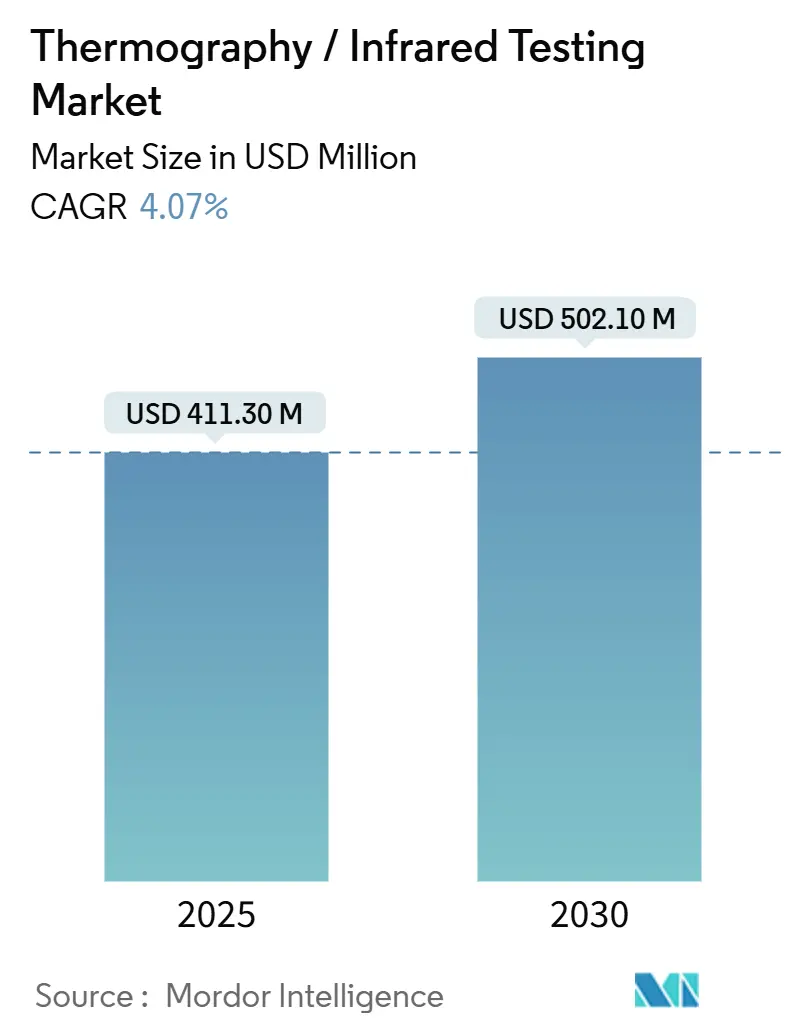
| Market Size (2025) | USD 411.30 Million |
| Market Size (2030) | USD 502.10 Million |
| Growth Rate (2025 - 2030) | 4.07% CAGR |
| Fastest Growing Market | Asia Pacific |
| Largest Market | Asia Pacific |
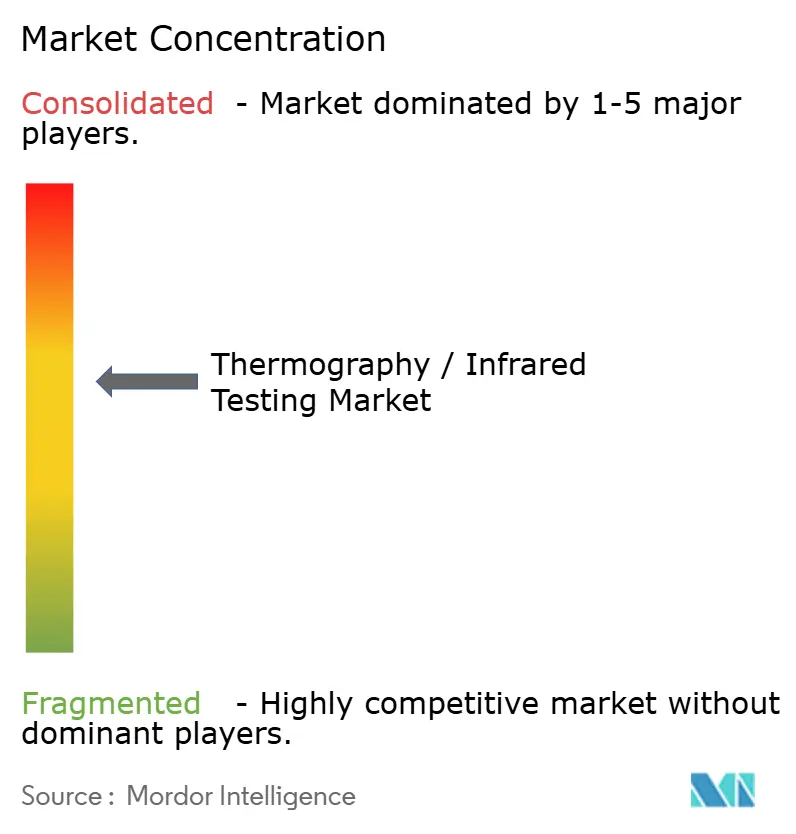
| Market Concentration | Medium |
Major Players *Disclaimer: Major Players sorted in no particular order Image © Mordor Intelligence. Reuse requires attribution under CC BY 4.0. | |
Thermography / Infrared Testing Market Analysis by Mordor Intelligence
The thermography market reached USD 411.3 million in 2025 and is forecast to register a 4.07% CAGR, achieving USD 502.1 million by 2030, underscoring steady expansion in both market size and profitability. Heightened investments in predictive maintenance, stricter industrial safety mandates, and declining hardware prices are driving mainstream adoption across energy, aerospace, and transportation operations. Vendors are layering edge AI algorithms onto portable imagers, transforming what were once standalone temperature-mapping tools into autonomous platforms for asset health. Competition has intensified as cost-aggressive Chinese suppliers narrow the performance gap with incumbents, forcing global leaders to pivot toward software-centric value propositions. Near-term growth could soften if the supply of gallium-based sensors remains constrained, yet regulatory pressure surrounding methane detection and renewable energy reliability continues to create sizable demand corridors for the thermography market.
Key Report Takeaways
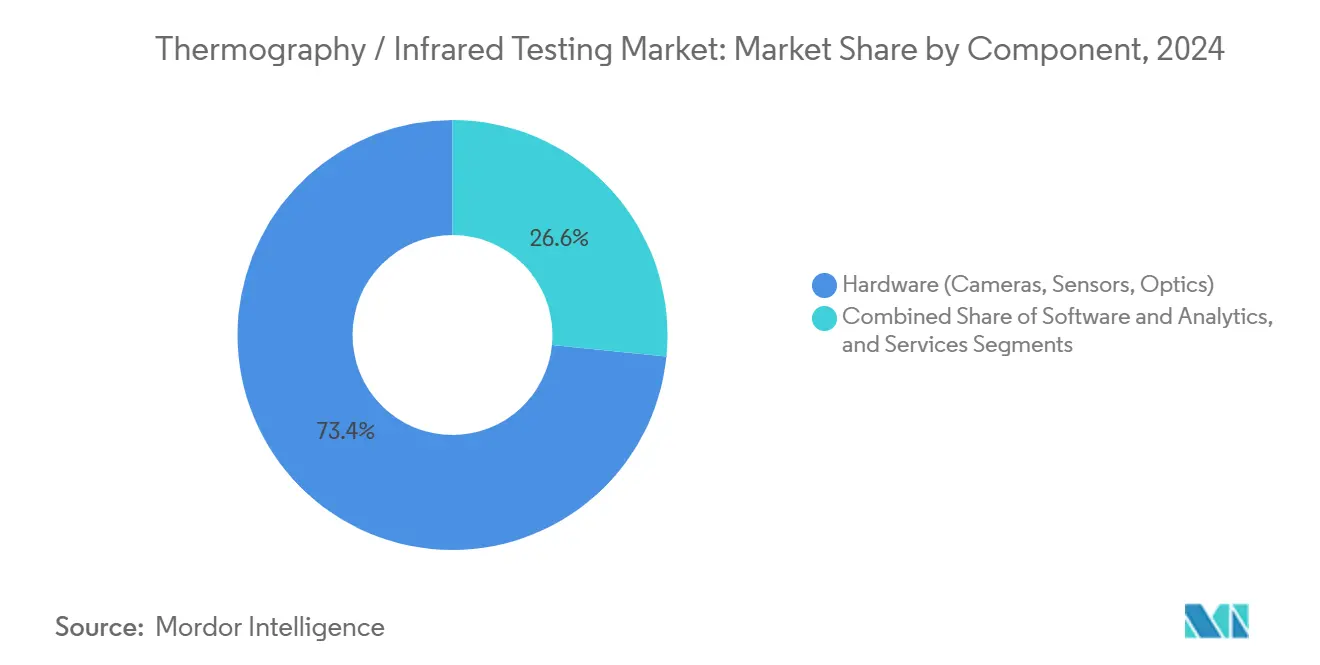
- By component, hardware accounted for 73.4% of the thermography market share in 2024, while software and analytics are projected to advance at a 9.8% CAGR through 2030.
- By technology, passive imaging led with 67.8% revenue share in 2024; active techniques are projected to rise at a 9.2% CAGR through 2030.
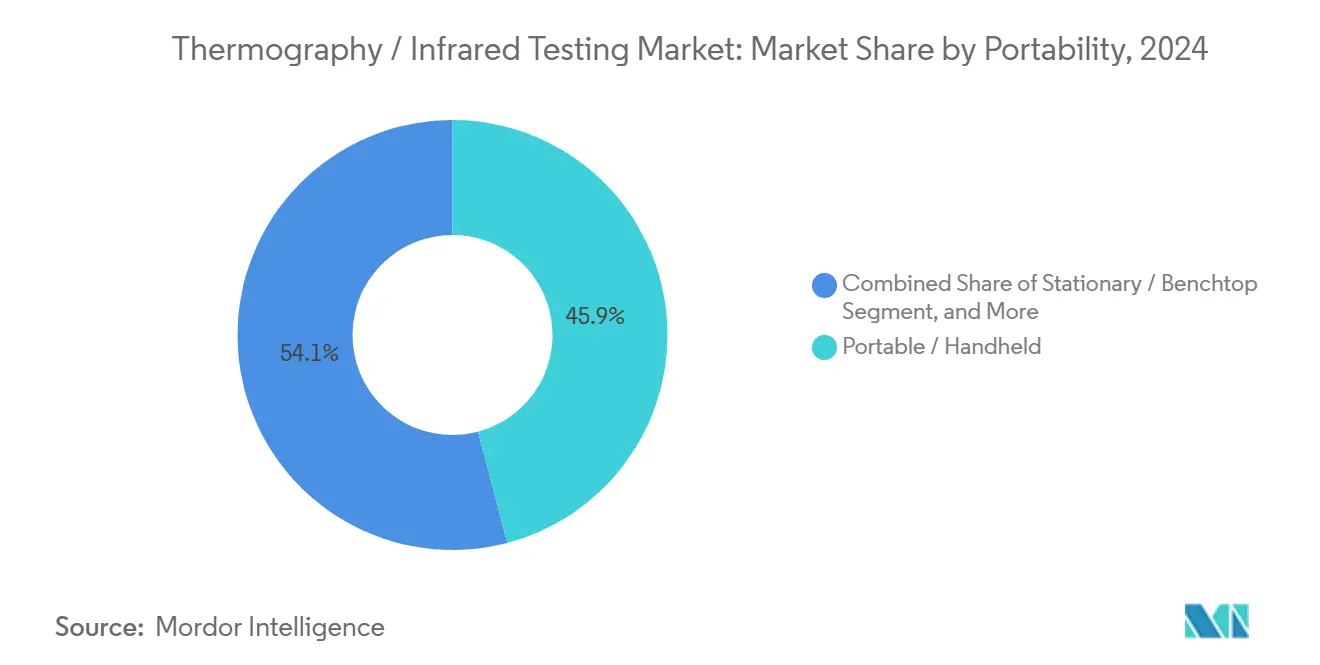
- By portability, handheld devices held 45.9% of the thermography market size in 2024, and automated robotic systems are expected to exhibit the fastest growth rate of 10.3% from 2024 to 2030.
- By end-user industry, the oil and gas sector accounted for a 26.8% share of the thermography market size in 2024, whereas the automotive and transportation sectors are projected to grow at a 10.1% CAGR through 2030.
- By geography, the Asia-Pacific region led the thermography market with a 35.7% share in 2024 and is expected to expand at a 6.4% CAGR between 2025 and 2030.
Note: Market size and forecast figures in this report are generated using Mordor Intelligence’s proprietary estimation framework, updated with the latest available data and insights as of January 2026.
Global Thermography / Infrared Testing Market Trends and Insights
Drivers Impact Analysis*
| Driver | (~) % Impact on CAGR Forecast | Geographic Relevance | Impact Timeline |
|---|---|---|---|
| Surging demand for predictive maintenance in critical infrastructure | +1.2% | Global – North America and Europe focus | Medium term (2-4 years) |
| Stricter industrial-safety mandates across energy and manufacturing | +0.8% | EU and North America | Short term (≤ 2 years) |
| Growing adoption of uncooled micro-bolometer cameras in portable devices | +0.6% | Asia-Pacific hubs | Medium term (2-4 years) |
| Edge-AI embedded thermal analytics enabling autonomous inspections | +0.5% | North America and Europe early, Asia-Pacific scaling | Long term (≥ 4 years) |
| Hybrid IR-ultrasound techniques boosting defect-detection accuracy | +0.4% | Aerospace and automotive in developed markets | Long term (≥ 4 years) |
| Carbon-leak monetization under methane-fee regulations | +0.3% | North America and the EU | Short term (≤ 2 years) |
| Source: Mordor Intelligence | |||
Surging Demand for Predictive Maintenance in Critical Infrastructure
Utilities, refineries, and chemical plants are replacing reactive repairs with data-driven maintenance strategies that rely on thermal imaging to find hot spots before failures occur. Unplanned outages cost industrial sites an average of USD 50,000 per hour, and thermography helps operators avoid these losses by flagging anomalies while equipment remains online.[1]Staff Writer, “Industrial Energy Efficiency and Predictive Maintenance,” U.S. DEPARTMENT OF ENERGY, energy.gov Large utilities, such as Exelon and Duke Energy, have integrated thermal cameras into their routine substation patrols, capturing actionable insights that improve grid stability amid rising renewable energy penetration. Machine-learning tools now forecast failure timelines with 85% accuracy, letting maintenance teams schedule interventions during planned shutdowns instead of emergency stoppages. The widespread rollout of cloud dashboards is further democratizing access to thermal insights, reinforcing momentum in the thermography market.
Stricter Industrial-Safety Mandates Across Energy and Manufacturing
Regulators have incorporated thermal inspections into safety codes, transforming voluntary best practices into a legal necessity. The European Union’s Industrial Emissions Directive instructs petrochemical sites to conduct periodic thermographic surveys of pressure vessels, furnaces, and electrical switchgear. In the United States, OSHA guidance now recommends quarterly infrared scans of energized panels in high-risk facilities. Compliance obligations extend to insurance carriers that offer reduced premiums to companies that document continuous thermal monitoring, thereby aligning safety compliance with financial incentives. As more jurisdictions adopt similar rules, demand surges for calibrated imagers, certified operators, and digital audit trails that prove adherence to inspection schedules.
Growing Adoption of Uncooled Micro-Bolometer Cameras in Portable Devices
Advances in uncooled microbolometer fabrication have reduced camera costs by approximately 40% since 2024, making thermography accessible to technicians beyond elite inspection teams.[2]Staff Writer, “Advances in Uncooled Infrared Technology,” SPIE, spie.orgModern units achieve < 50 mK sensitivity, suitable for the majority of preventive-maintenance workflows. Smartphone attachments and rugged tablet add-ons are proliferating, equipping electricians, HVAC contractors, and field engineers with on-the-spot thermal insight. Asian mass-production clusters have amplified scale economies, accelerating price deflation and pushing global installed bases higher. Portability is expanding use cases in mining shafts, ship engine rooms, and aerospace cabins, where bulky cooled imagers were previously impractical.
Edge-AI Embedded Thermal Analytics Enabling Autonomous Inspections
Vendors are embedding neural networks inside cameras, enabling real-time detection of abnormal heat signatures without streaming data to cloud servers.[3]Staff Writer, “Edge AI Computing for Inspection,” NVIDIA, nvidia.com Models distinguish benign temperature fluctuations from dangerous events, cutting false-alarm rates and easing the shortage of certified thermographers. Operators mount AI-enabled imagers on drones and crawlers that patrol pipelines, solar arrays, and high-voltage lines, sending exceptions to control rooms for review and analysis. Early adopters in North America report 92% diagnostic accuracy, demonstrating that edge inference can rival human interpretation in routine settings. Over the long term, this automation promises scalable inspection coverage across geographically dispersed assets, reinforcing growth prospects for the thermography market.
Restraints Impact Analysis*
| Restraint | (~) % Impact on CAGR Forecast | Geographic Relevance | Impact Timeline |
|---|---|---|---|
| High capital cost of high-resolution or cooled imagers | -0.7% | Global – emerging markets hardest hit | Medium term (2-4 years) |
| Shortage of certified thermographers for specialized NDT | -0.5% | North America and Europe acute | Long term (≥ 4 years) |
| Data-sovereignty concerns for cloud-based thermal analytics | -0.4% | Europe and Asia-Pacific | Medium term (2-4 years) |
| Sensor-grade gallium supply-chain volatility | -0.3% | Asia-focused manufacturing nodes | Short term (≤ 2 years) |
| Source: Mordor Intelligence | |||
High Capital Cost of High-Resolution or Cooled Imagers
Premium cooled detectors with sub-20 mK resolution cost above USD 100,000, deterring small enterprises from purchasing advanced systems. The price gulf between top-end cooled units and entry-level uncooled cameras often exceeds 10 times, creating a bifurcated customer base. Service firms investing in high-spec equipment face long payback cycles, pushing many to lease gear, which reduces availability during seasonal inspection peaks. Consequently, sophisticated applications in aerospace composites and petrochemical crack growth analysis remain limited to well-capitalized operators, capping the upside for the overall thermography market in the medium term.
Shortage of Certified Thermographers for Specialized NDT
The American Society for Nondestructive Testing reports a 25% deficit of Level II thermographers across North America, with similar shortfalls in Europe.[4]Staff Writer, “Thermography Certification Trends,” AMERICAN SOCIETY FOR NONDESTRUCTIVE TESTING, asnt.org Complex inspections, such as locating sub-surface delaminations in aircraft fuselages, demand experienced analysts who can correlate thermal patterns to structural flaws. Training pipelines take 6-12 months, and practical hours are irreplaceable, slowing workforce expansion. Rising wages, Level III specialists command more than USD 200 per hour, inflate inspection costs and deter price-sensitive industries from adopting advanced thermography workflows. Although online modules shorten coursework, the hands-on component prevents rapid scaling of talent.
*Our forecasts treat driver/restraint impacts as directional, not additive. The impact forecasts reflect baseline growth, mix effects, and variable interactions.
Segment Analysis
By Component – Hardware Dominance Faces Software Disruption
Hardware supplied 73.4% of 2024 revenue, reflecting the capital-intensive nature of cameras, optics, and sensors that underpin accuracy metrics. At a 9.8% CAGR, analytics platforms are outpacing physical components, signaling a pivot toward data-centric value creation. The thermography market size for software is projected to expand as cameras become standardized peripherals, and differentiation shifts to real-time pattern recognition, multi-sensor fusion, and predictive failure algorithms. Manufacturers now bundle lifetime cloud subscriptions with devices to secure recurring revenue and offset the commoditization of hardware. Inspection services continue to thrive because regulated sectors require third-party certification, ensuring stable margins for specialized consultancies.
In the future, open APIs and interoperability standards will enable operators to overlay thermal data with vibration, ultrasound, and electrical metrics, generating richer asset health models. Vendors that master seamless integration stand to capture disproportionate share even if hardware profits compress. Conversely, suppliers that cling to proprietary file formats risk being sidelined as enterprise customers demand unified dashboards for fleet-wide monitoring across equipment classes.


By Technology – Active Methods Challenge Passive Dominance
Passive imaging still accounts for 67.8% of sales, thanks to its simplicity and broad applicability; however, active techniques are accelerating at a 9.2% CAGR as industries seek deeper diagnostic insights. Active flash and lock-in methods introduce controlled heat pulses to reveal defects that are invisible to passive scans, thereby satisfying aerospace safety protocols that mandate quantitative flaw sizing for composites. The thermography market share for vibro-thermography is increasing in heavy machinery maintenance, where mechanical excitation detects early-stage fatigue cracks before they propagate.
While active systems cost more and require specialist operators, their superior sensitivity opens premium revenue niches. OEMs in automotive and aviation incorporate in-line active thermography stations to certify bond integrity during manufacturing. As AI-powered analysis lowers interpretation barriers, active modalities are likely to permeate mid-tier industries, expanding the addressable thermography market size without cannibalizing passive deployments.
By Portability – Automation Transforms Inspection Workflows
Handheld devices held a commanding 45.9% stake in 2024, indicating that field flexibility remains a paramount concern. Automated robotic platforms, however, are scaling fastest at 10.3% CAGR as factories and utilities push for unmanned inspections that minimize human exposure and standardize data collection. The thermography market size for stationary systems is stable in laboratories where measurement repeatability is paramount, but growth is limited.
Robotics-enabled imaging offers unique advantages, drones equipped with gimballed thermal cameras can map solar farms in minutes, and crawler robots can survey boiler tubes without shutdowns. By integrating edge AI, these platforms flag anomalies in real-time, routing exception clips to experts while discarding routine footage. Such efficiencies drive adoption even in cost-sensitive segments, suggesting that automation will capture an incremental share of the thermography market across the forecast horizon.
By End-User Industry – Energy Sectors Lead While Automotive Accelerates
Oil and gas generated 26.8% of 2024 revenue, underpinned by pipeline integrity and refinery safety mandates. The thermography market size within the automotive and transportation sector is growing at a 10.1% CAGR as electric-vehicle makers deploy infrared monitoring to prevent battery thermal runaway and validate autonomous sensor calibration. Power utilities remain consistent buyers, utilizing infrared audits to prevent switchgear failures that could lead to cascading blackouts.
Aerospace leverages high-precision active imaging to inspect composite wings and turbine blades, commanding premium service fees. Manufacturing and heavy engineering utilize thermography for analyzing conveyor belts and bearings, while construction firms evaluate building envelopes for energy efficiency retrofits. Although medical devices and electronics are smaller contributors, their demand for sub-micron thermal resolution encourages innovation that subsequently cascades to industrial segments, reinforcing technology diffusion throughout the thermography market.
Geography Analysis
Asia-Pacific controlled 35.7% of global revenue in 2024 and is advancing at a 6.4% CAGR, with China integrating thermography into electronics, automotive, and renewable-energy quality checks. Government programs on smart manufacturing and carbon neutrality dictate continuous thermal monitoring of high-energy equipment, sustaining demand. India’s push to modernize transmission grids and smart cities widens opportunities, while Japan and South Korea focus on semiconductor fabrication and shipbuilding inspections, respectively.
North America exhibits mature but resilient demand, rooted in stringent asset-integrity regulations across oil pipelines, power lines, and aerospace fleets. Aging infrastructure compels utilities to intensify infrared scanning frequencies, and methane fee legislation propels investment in long-range gas leak imagers. Canada’s hydro and oil-sands operations generate steady volumes, and Mexico’s automotive corridors increasingly adopt thermal audits for assembly quality.
Europe hinges on regulatory compliance—Industrial Emissions rules enforce thermal surveillance in chemical and petrochemical sites. Germany’s precision-manufacturing ethos drives the adoption of active thermography for composite bonding, and the United Kingdom’s offshore wind farms apply ruggedized imagers for blade erosion monitoring. France’s nuclear fleet requires high-resolution cooled cameras for reactor-core inspections, and Nordic nations extend usage to district-heating networks, collectively cementing a predictable revenue stream for vendors.


Competitive Landscape
Competition is moderate, with Teledyne FLIR, Fluke Corporation, and InfraTec GmbH leading the way through broad portfolios and global channels. Emerging Chinese manufacturers, such as HIKMICRO and Guide Sensmart, gain ground by offering cost-optimized uncooled cameras that meet entry-level requirements, forcing stalwarts to innovate beyond hardware. Most incumbents now bundle SaaS analytics and API layers to lock in enterprise workflows and defend margins.
Strategic moves highlight this pivot. Teledyne FLIR’s USD 45 million investment in Oregon adds capacity for AI-embedded modules that perform on-device analytics, and Fluke’s Ti401 PRO converges thermal, vibration, and ultrasonic sensing into a single handheld device, offering multi-physics diagnostics. Start-ups exploit niche edges, such as UAV-based wind-turbine inspection systems, smartphone thermal add-ons, and cloud orchestration software that aggregates data from multiple sites.
Horizontal partnerships flourish as chipmakers like NVIDIA supply edge AI accelerators and systems integrators incorporate thermal feeds into predictive maintenance dashboards. The net result is an ecosystem where software expertise weighs as heavily as optical performance. Although price erosion pressures persist, the thermography market retains profitable pockets in specialized aerospace, petrochemical, and utility verticals that demand certified, high-resolution solutions.
Thermography / Infrared Testing Industry Leaders
Teledyne FLIR LLC
Fluke Corporation
InfraTec GmbH
Testo SE and Co. KGaA
Guide Sensmart Tech Co. Ltd.
- *Disclaimer: Major Players sorted in no particular order

Recent Industry Developments
- September 2025: Teledyne FLIR announced a USD 45 million expansion of AI-embedded thermal-camera manufacturing in Oregon to support autonomous inspection deployments.
- August 2025: Fluke Corporation introduced the Ti401 PRO imager with integrated vibration and ultrasonic leak detection for comprehensive asset diagnostics.
- July 2025: HIKMICRO secured a USD 30 million contract with China State Grid Corporation for automated thermal monitoring of high-voltage lines.


Global Thermography / Infrared Testing Market Report Scope
| Hardware (Cameras, Sensors, Optics) |
| Software and Analytics |
| Services (Inspection, Training, Consulting) |
| Passive Thermography |
| Active Thermography (Flash, Lock-in, Vibro) |
| Portable / Handheld |
| Stationary / Benchtop |
| Automated / Robotic |
| Oil and Gas |
| Power Generation |
| Aerospace |
| Defense |
| Automotive and Transportation |
| Manufacturing and Heavy Engineering |
| Construction and Infrastructure |
| Chemical and Petrochemical |
| Marine and Ship Building |
| Electronics and Semiconductor |
| Mining |
| Medical Devices |
| Others |
| North America | United States | |
| Canada | ||
| Mexico | ||
| South America | Brazil | |
| Argentina | ||
| Rest of South America | ||
| Europe | Germany | |
| United Kingdom | ||
| France | ||
| Italy | ||
| Spain | ||
| Rest of Europe | ||
| Asia Pacific | China | |
| Japan | ||
| India | ||
| South Korea | ||
| South-East Asia | ||
| Rest of Asia Pacific | ||
| Middle East and Africa | Middle East | Saudi Arabia |
| United Arab Emirates | ||
| Turkey | ||
| Rest of Middle East | ||
| Africa | South Africa | |
| Nigeria | ||
| Rest of Africa | ||
| By Component | Hardware (Cameras, Sensors, Optics) | ||
| Software and Analytics | |||
| Services (Inspection, Training, Consulting) | |||
| By Technology | Passive Thermography | ||
| Active Thermography (Flash, Lock-in, Vibro) | |||
| By Portability | Portable / Handheld | ||
| Stationary / Benchtop | |||
| Automated / Robotic | |||
| By End-user Industry | Oil and Gas | ||
| Power Generation | |||
| Aerospace | |||
| Defense | |||
| Automotive and Transportation | |||
| Manufacturing and Heavy Engineering | |||
| Construction and Infrastructure | |||
| Chemical and Petrochemical | |||
| Marine and Ship Building | |||
| Electronics and Semiconductor | |||
| Mining | |||
| Medical Devices | |||
| Others | |||
| By Geography | North America | United States | |
| Canada | |||
| Mexico | |||
| South America | Brazil | ||
| Argentina | |||
| Rest of South America | |||
| Europe | Germany | ||
| United Kingdom | |||
| France | |||
| Italy | |||
| Spain | |||
| Rest of Europe | |||
| Asia Pacific | China | ||
| Japan | |||
| India | |||
| South Korea | |||
| South-East Asia | |||
| Rest of Asia Pacific | |||
| Middle East and Africa | Middle East | Saudi Arabia | |
| United Arab Emirates | |||
| Turkey | |||
| Rest of Middle East | |||
| Africa | South Africa | ||
| Nigeria | |||
| Rest of Africa | |||


Key Questions Answered in the Report
What is the expected value of the global thermography market by 2030?
The market is projected to reach USD 502.1 million by 2030, growing at a 4.07% CAGR.
Which component category is expanding fastest within thermography solutions?
Software and analytics lead growth, posting a 9.8% CAGR through 2030 as AI-driven insights gain traction.
Why is Asia-Pacific leading the adoption of thermographic technology?
China’s large-scale manufacturing, along with energy-efficiency mandates across emerging economies, drives the region’s 35.7% revenue share and 6.4% CAGR.
What major regulation is spurring demand for industrial thermography in Europe?
The European Union’s Industrial Emissions Directive requires regular thermal inspections of critical equipment, promoting continuous upgrades and maintenance services for equipment.
How are edge-AI capabilities changing the thermography landscape?
Embedding machine-learning models inside cameras enables autonomous anomaly detection, reduces interpretive labor, and supports large-scale, continuous monitoring deployments.
Page last updated on:


