Radiography Test Equipment Market Size and Share
Market Overview
| Study Period | 2020 - 2031 |
|---|---|
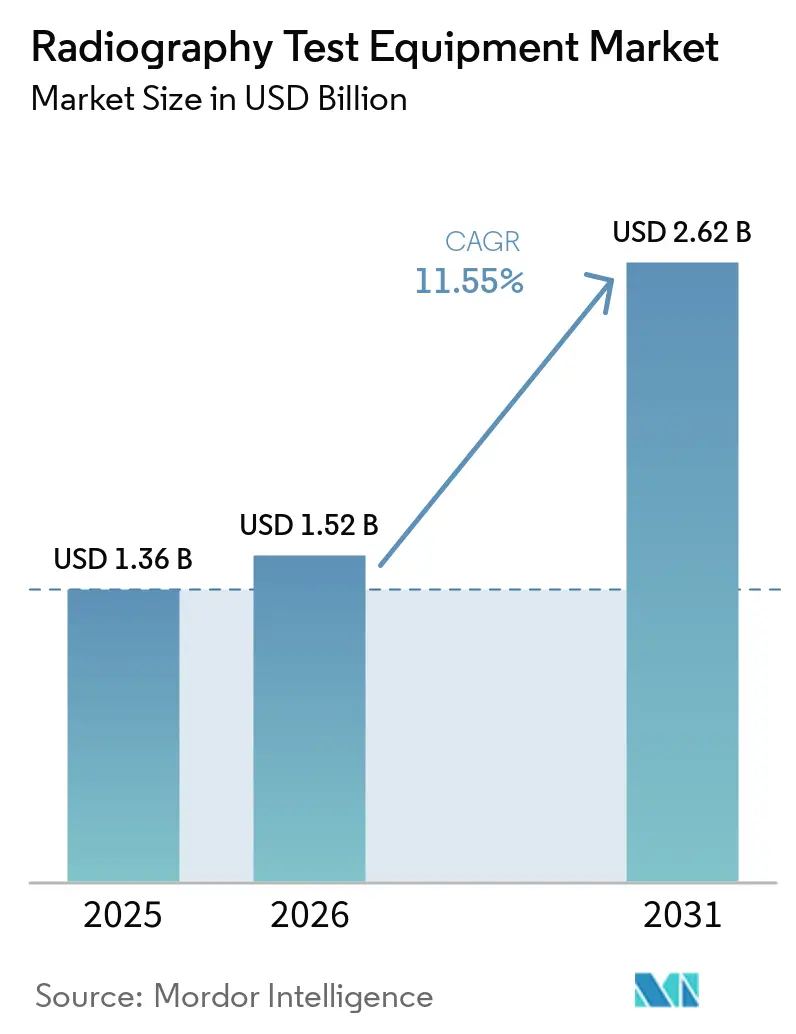
| Market Size (2026) | USD 1.52 Billion |
| Market Size (2031) | USD 2.62 Billion |
| Growth Rate (2026 - 2031) | 11.55% CAGR |
| Fastest Growing Market | North America |
| Largest Market | Asia Pacific |
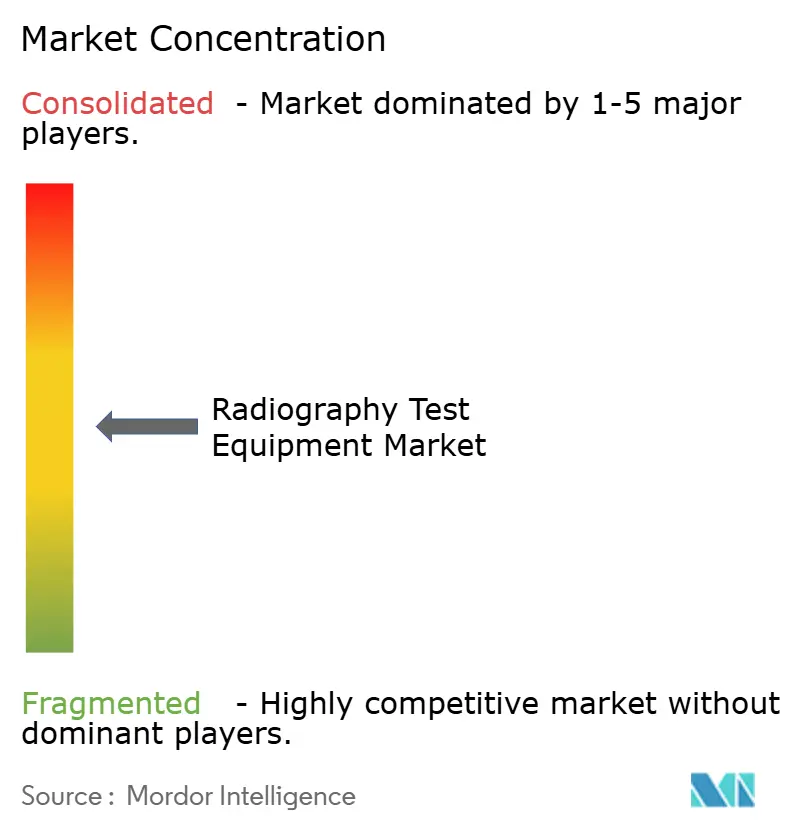
| Market Concentration | Medium |
Major Players
*Disclaimer: Major Players sorted in no particular order Image © Mordor Intelligence. Reuse requires attribution under CC BY 4.0. |
|
Radiography Test Equipment Market Analysis by Mordor Intelligence
radiography test equipment market size in 2026 is estimated at USD 1.52 billion, growing from 2025 value of USD 1.36 billion with 2031 projections showing USD 2.62 billion, growing at 11.55% CAGR over 2026-2031. Sustained regulatory pressure on pipeline integrity, the retirement-age profile of global energy assets, and the rapid uptake of digital inspection platforms are moving both asset owners and testing service providers toward intelligent, network-ready systems that merge high-resolution imaging with AI-based defect recognition. North America currently leads with 38.92% of global revenues, reflecting rigid federal safety statutes, while Asia-Pacific outpaces all regions at a 12.76% CAGR, driven by unprecedented infrastructure capex programs and accelerating aerospace supply chains. Direct Radiography remains the workhorse technology with a 45.73% share, yet Computed Tomography’s 12.56% CAGR signals a decisive pivot toward 3-D volumetric analysis for complex geometries. Across applications, weld inspection preserves its 37.94% revenue lead, whereas composite-material inspection expands fastest at 12.34% CAGR on the back of next-generation aircraft and reusable launch vehicles.
Key Report Takeaways
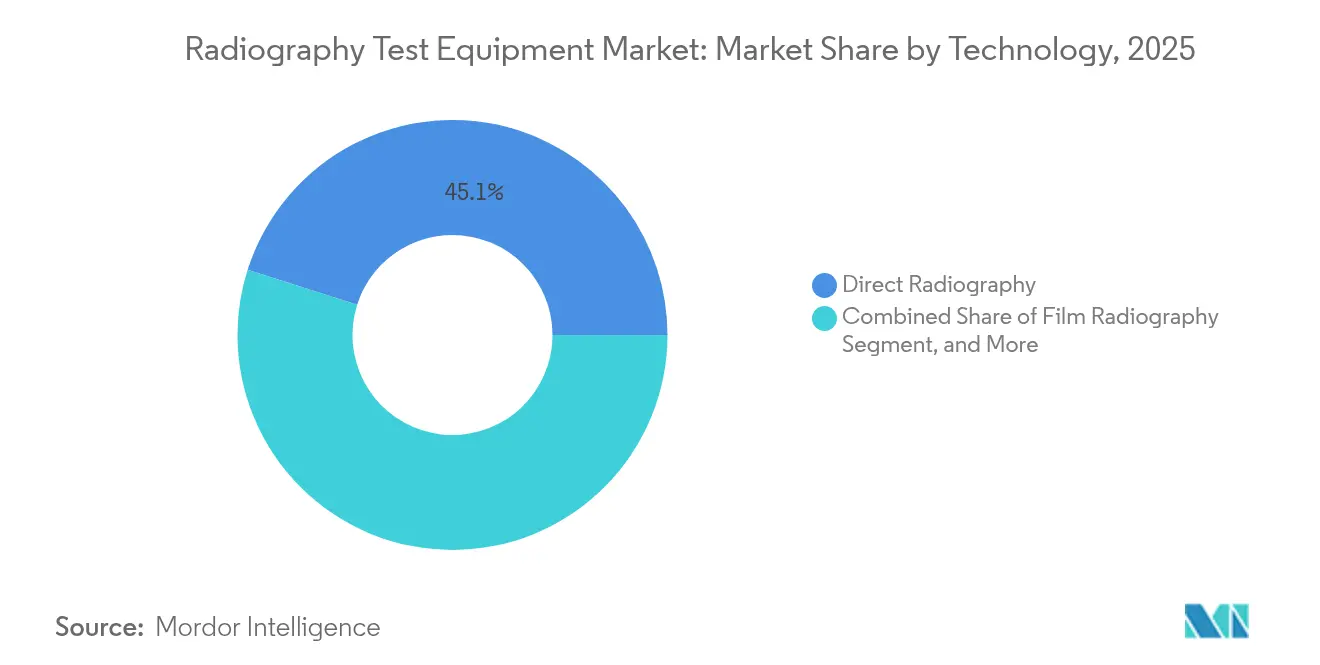
- By technology, direct radiography held 45.10% of radiography test equipment market share in 2025. computed tomography is forecast to grow at 12.18% CAGR to 2031.
- By component, hardware captured 48.40% of the radiography test equipment market size in 2025. software is advancing at 12.05% CAGR through 2031.
- By application, weld inspection commanded 37.40% of 2025 revenues in the radiography test equipment market. composite inspection is expected to expand at 11.95% CAGR between 2026-2031.
- By end-user, oil and gas led with 30.10% revenue share in 2025 in the radiography test equipment market, while aerospace and defense posts the highest 11.78% CAGR to 2031.
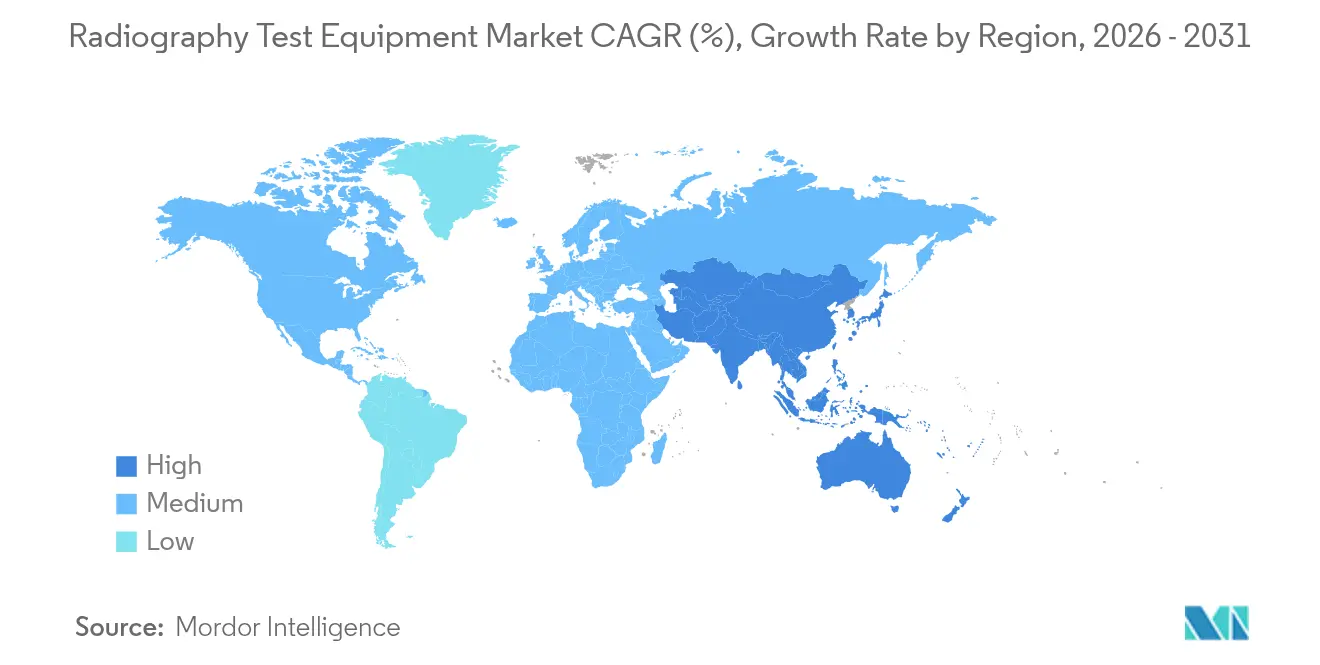
- By region, North America maintained 38.50% radiography test equipment market share in 2025; Asia-Pacific is projected to climb at 12.30% CAGR through 2031.
Note: Market size and forecast figures in this report are generated using Mordor Intelligence’s proprietary estimation framework, updated with the latest available data and insights as of 2026.
Global Radiography Test Equipment Market Trends and Insights
Drivers Impact Analysis*
| Driver | (~) % Impact on CAGR Forecast | Geographic Relevance | Impact Timeline |
|---|---|---|---|
| Growing adoption of portable digital RT systems | +2.8% | Global, with early adoption in North America and EU | Medium term (2-4 years) |
| Surge in aerospace composite-materials inspection volumes | +2.1% | North America and EU core, expanding to APAC | Long term (≥ 4 years) |
| Regulatory mandates for weld integrity across oil and gas pipelines | +1.9% | Global, with strongest impact in North America | Short term (≤ 2 years) |
| Aging global energy infrastructure demanding life-extension NDT | +2.3% | North America and EU primary, emerging in APAC | Long term (≥ 4 years) |
| AI-driven defect-recognition software bundled with RT hardware | +1.7% | Global, technology leaders in North America and EU | Medium term (2-4 years) |
| SpaceX-type private launch programs spawning new RT use cases | +0.9% | North America primary, expanding globally | Long term (≥ 4 years) |
| Source: Mordor Intelligence | |||
Growing Adoption of Portable Digital RT Systems
Portable digital radiography is overturning field inspection economics by replacing hours-long film processing with immediate, high-contrast images that expose micro-cracks on site.[1]“Advances in Portable Digital Radiography Systems,” Materials Evaluation, asnt.org Advanced flat-panel detectors now pair wireless connectivity with ruggedized housings, letting pipeline crews or offshore technicians validate weld integrity in minutes and upload encrypted results to a cloud server for centralized review. Eliminating darkrooms also removes hazardous chemical disposal, lowering total compliance cost and aligning with net-zero mandates. Capital payback periods are shortening to fewer than 24 months for high-duty users, making portable systems an easy upgrade for contractors chasing tight project schedules. As component prices fall and detector sensitivity rises, adoption spreads from early North American and European users to Latin American and Southeast Asian energy corridors where logistical hurdles are greatest.
Surge in Aerospace Composite-Materials Inspection Volumes
Private launch providers and commercial aircraft OEMs have standardized computed-tomography scanning for primary load-bearing carbon-fiber parts, raising total scan hours per airframe to record levels.[2]"Composite Material Inspection Requirements for Space Applications,” NASA Technical Reports Server, nasa.gov Multi-layer lay-ups, variable wall thicknesses, and metal-mesh lightning strike protections demand 3-D datasets capable of isolating sub-millimeter voids. Portable CT gantries equipped with 450 kV sources now move directly to assembly bays, sidestepping schedule bottlenecks at overbooked fixed installations. The resulting acceleration in first-article inspection throughput gives OEMs confidence to scale novel material systems that cut 20% structural weight without sacrificing safety margins. Asia-Pacific’s burgeoning composite supply chain is quickly adopting these same standards to win Tier-1 fuselage and engine nacelle contracts.
Regulatory Mandates for Weld Integrity Across Oil and Gas Pipelines
The Pipeline and Hazardous Materials Safety Administration now demands 100% radiographic coverage for girth welds in high-consequence areas, and major operators are extending the policy network-wide to eliminate certification ambiguity.[3]PHMSA, “Enhanced Pipeline Inspection Requirements,” phmsa.dot.gov In Canada, analogous directives from the Canadian Energy Regulator dovetail with EPA methane-emission rules, making flawless welds both a safety and climate priority. Portable digital radiography shortens weld verification cycles, cutting rework risk and avoiding multi-million-dollar startup delays. Contractors that bundle AI-based defect recognition software win bid premiums by guaranteeing actionable reports in real time.
Aging Global Energy Infrastructure Demanding Life-Extension NDT
More than 45% of the world’s operating nuclear reactors entered service before 1990 and now rely on enhanced NDT regimens to extend licenses beyond 60 years.[4]NRC, “Radiographic Inspection Requirements for Nuclear Facilities,” nrc.gov Radiography remains indispensable for mapping embrittlement in reactor pressure vessels, detecting stress-corrosion cracking in steam generator tubes, and validating weld overlays on turbine rotors. Because many components sit inside high-radiation fields, remote-controlled manipulators paired with radiation-hardened detectors are essential. Utilities view advanced RT equipment as an economical hedge against the multibillion-dollar cost of new-build plants, ensuring long-term demand regardless of fresh capacity additions.
Restraints Impact Analysis*
| Restraint | (~) % Impact on CAGR Forecast | Geographic Relevance | Impact Timeline |
|---|---|---|---|
| High ownership cost, particularly for CT scanners | -1.8% | Global, most pronounced in emerging markets | Short term (≤ 2 years) |
| Radiation exposure risk and tightening safety clearances | -1.2% | Global, with strictest enforcement in EU and North America | Medium term (2-4 years) |
| Deficit of certified Level-III RT personnel | -1.1% | Global, acute shortage in North America and EU | Long term (≥ 4 years) |
| Cyber-security vulnerabilities in networked RT systems | -0.7% | Global, highest concern in critical infrastructure sectors | Medium term (2-4 years) |
| Source: Mordor Intelligence | |||
High Ownership Cost, Particularly for CT Scanners
High-energy industrial CT units routinely top USD 500,000, and shielding, calibration, and skilled labor can double that outlay over ten years. Smaller inspection houses in Southeast Asia and Africa prefer contract labs or mobile service providers, slowing the direct-purchase curve. Leasing models and pay-per-scan platforms are partially bridging the affordability gap but not yet at scale. Vendors that bundle hardware with subscription-based AI analytics are shifting cash-flow profiles, but financiers still perceive residual-value uncertainty for bespoke CT cabinets. Consequently, many mid-tier users postpone upgrades until depreciation cycles free capital.
Radiation Exposure Risk and Tightening Safety Clearances
Recent IAEA guidelines mandate stricter personal dosimetry, real-time area monitoring, and credential checks for radiographic technicians. Mobile field work now requires collapsible barrier systems and remote firing circuits that inflate job-site complexity. In urban retrofit projects, obtaining local permits for high-kV sources can delay schedules, pushing contractors toward ultrasound or phased-array alternatives when defect morphology allows. Equipment makers are responding with lower-dose photon counting detectors and real-time scatter-shielding analytics, yet the administrative burden continues to deter some first-time adopters, trimming near-term sales potential.
*Our forecasts treat driver/restraint impacts as directional, not additive. The impact forecasts reflect baseline growth, mix effects, and variable interactions.
Segment Analysis
By Technology: CT Systems Gain Traction Despite Direct Radiography Dominance
Direct Radiography accounted for 45.10% of the radiography test equipment market size in 2025, underscoring its entrenched role in routine weld verification and corrosion mapping. Computed Tomography, however, is accelerating at 12.18% CAGR, capturing projects that require complete volumetric datasets rather than 2-D projections. The radiography test equipment market is therefore experiencing a dual-track evolution where cost-efficient DR fulfills baseline compliance while CT unlocks high-value inspections for aerospace, additive manufacturing, and complex castings. Migration from film to digital remains pivotal; film units now represent less than 15% of new sales and are largely confined to legacy defense depots.
Portable CT innovations are dissolving historical barriers tied to fixed, lead-lined enclosures. Units integrating 450 kV sources, carbon-fiber support frames, and vibration-isolated turntables are operating from ISO containers at launch sites and pipeline rights-of-way. As resolution climbs to sub-50 micron voxel grids, CT also assumes metrology duties, validating additively manufactured titanium parts against CAD models. These capabilities help OEMs close first-article inspection loops within 24 hours, reducing costly iteration cycles. Consequently, CT’s share of the radiography test equipment market is expected to break the 20% threshold before 2031, with most gains drawn from retiring film installations.


By Component: Software Innovation Drives Hardware Integration
Hardware captured 48.40% of 2025 revenues, reflecting the capital intensity of X-ray sources, manipulators, and detectors essential for any inspection cell. Yet software revenues are advancing faster at 12.05% CAGR as AI engines transform raw image stacks into quantified flaw assessments, cutting interpretive labor up to 60%. Service contracts, ranging from annual calibration to on-demand evaluation of CT datasets, sustain a stable mid-single-digit growth, especially among manufacturers lacking in-house analysts.
The radiography test equipment industry is converging around integrated ecosystems where detectors, control electronics, and analytics share a common firmware layer. Vendors bundle subscription-based algorithms that classify porosity, lack of fusion, or wall-thickness deviations, delivering dashboard-ready outputs to quality managers in real time. This tight coupling increases switching costs and elevates lifetime value. Over the forecast period, software is expected to account for nearly one-third of incremental dollar growth, underlining its strategic weight in future procurement cycles.
By Application: Composite Inspection Accelerates Beyond Traditional Weld Testing
Weld inspection retained 37.40% of 2025 demand, reaffirming its central role in safeguarding pipeline, pressure-vessel, and structural-steel assets. Composite inspection, however, is forecast to log 11.95% CAGR, reflecting aerospace’s pivot toward carbon-fiber airframes and reusable launch vehicles that demand flawless laminate quality. The radiography test equipment market size associated with composite inspection is projected to more than double by 2030, powered by CT’s ability to detect delamination, resin voids, and fiber wrinkling invisible to 2-D radiographs.
Casting and forging inspection also benefits from CT’s adoption, unveiling entrapped gas and shrinkage porosity that threaten fatigue life. In the electronics arena, micro-focus X-ray validates solder-ball integrity in high-density interconnects, a use case that grew sharply amid electric-vehicle power-electronics ramp-ups. Together, these emerging niches diversify end-market exposure and buffer suppliers against cyclical swings in oil-and-gas capex.

By End-User Industry: Aerospace Growth Outpaces Oil and Gas Leadership
Oil and gas commanded 30.10% of global turnover in 2025, supported by over 800,000 km of new transmission pipeline either under construction or sanctioned worldwide, reinforcing oil and gas TIC demand. Nevertheless, aerospace and defense is expanding at 11.78% CAGR, propelled by surging build rates for single-aisle jets and proliferating private-launch manifests. The radiography test equipment market share accruing to aerospace is set to breach 17.85% by 2031 as composite usage per aircraft continues to climb.
Energy-and-power generation users, notably nuclear operators, maintain consistent replacement cycles, while renewables introduce fresh inspection demand for wind-turbine castings and high-power converter modules. Automotive electrification also contributes, as die-cast battery housings and thin-wall aluminum parts require void-free integrity for crash-safety compliance.
Geography Analysis
North America held 38.50% of 2025 revenues, anchored by the world’s densest pipeline network and a dominant share of global composite aircraft production capacity. The radiography test equipment market size in the region is expected to reach USD 1.12 billion by 2031, expanding steadily on the back of FAA-mandated composite airframe inspections and life-extension programs for aging nuclear assets. Canada’s oil-sands expansions and Mexico’s reform-driven midstream investments add incremental pull.
Asia-Pacific is the fastest-growing theater, charting a 12.30% CAGR amid China’s multi-trillion-dollar infrastructure pipeline and India’s surge in thermal-plant upgrades. Local aerospace clusters in Tianjin, Bengaluru, and Nagoya are installing CT bays to win Tier-1 positions on global airframe programs. Government incentives in South Korea and Singapore further drive adoption through tax credits linked to Industry 4.0 modernization.
Europe exhibits balanced drivers: renewable-energy rollouts, particularly offshore wind, necessitate large-component RT, while extending the operational life of 100-plus nuclear reactors secures base-load demand. Stringent Euratom radiation standards push users toward digital dose-reduction technologies, creating technology-upgrade pull rather than pure volume growth. Middle East and Africa leverage hydrocarbon megaprojects, though adoption rates trail due to CT’s capital intensity. South America, led by Brazil’s deepwater initiatives, is a rising but still niche revenue pool.

Competitive Landscape
The radiography test equipment market is moderately consolidated, with the top five vendors accounting for roughly 55% of 2024 revenue. Baker Hughes (Waygate), GE Vernova, Canon, and Comet AG lead by virtue of broad product lines and field-service footprints. Recent strategies center on software tuck-in acquisitions, GE Vernova’s 2024 purchase of Advanced Imaging Analytics being a flagship example, to strengthen AI portfolios and lock in recurring license income. Canon’s CR-X3000 roll-out exemplifies incremental innovation targeting pipeline contractors craving instant image uploads.
New entrants differentiate through edge-computing modules that process data locally, sharply reducing satellite or 5G uplink costs for remote sites. Patent filings cluster around photon-counting detectors and reinforcement-learning defect classifiers, with USPTO applications up 18% year-over-year. Service-oriented disruptors leverage mobile CT trucks to undercut capital barriers in emerging markets, often partnering with OEMs for equipment leasing. Given persistent mid-single digit price erosion on hardware, profitability increasingly hinges on high-margin analytics and multi-year maintenance contracts.
Radiography Test Equipment Industry Leaders
-
Hitachi Ltd
-
Canon Inc.
-
Hamamatsu Photonics KK
-
Nikon Metrology Inc.
-
Olympus Corporation
- *Disclaimer: Major Players sorted in no particular order

Recent Industry Developments
- April 2025: Carestream Non-Destructive Testing (NDT) unveiled its innovative HPX-ARC 1043. This 4x17" bendable digital radiography (DR) system is set to revolutionize imaging workflows, offering unmatched versatility. With its state-of-the-art features, the HPX-ARC 1043 promises to enhance flexibility, speed, and efficiency for NDT professionals.
- October 2024: The Board of Radiation and Isotope Technology (BRIT), under the Department of Atomic Energy (DAE), introduced "ROTEX-I" in October 2024. As India's inaugural homegrown Industrial Radiography Device, the ROTEX-I is engineered for a capacity of 2.40 TBq (65 Ci) of Iridium-192, positioning it for broad adoption in the NDT industry.
- September 2024: Baker Hughes committed USD 75 million to develop portable micron-level CT for aerospace composites.
- August 2024: GE Vernova acquired Advanced Imaging Analytics for USD 45 million to embed ML-driven defect recognition across its RT fleet.


Global Radiography Test Equipment Market Report Scope
Radiography uses X-rays or gamma rays to inspect components without causing damage, revealing their internal structures. Unlike other non-destructive techniques, radiography stands out for its high repeatability and versatility, making it suitable for a diverse array of materials. Equipment designed for radiography tests can evaluate the material content in substances such as cement, asphalt, and bituminous rocks. This safe radiography method identifies internal flaws, such as fissures, in materials. Additionally, by applying ultrasonic waves to the material, this approach eliminates the necessity for invasive destructive testing.
The study tracks the revenue accrued through the sale of radiography test equipment offerings by various players globally. The study also tracks the key market parameters, underlying growth influencers, and major vendors operating in the industry, which supports the market estimations and growth rates over the forecast period. The study further analyses the overall impact of macroeconomic factors on the market. The report's scope encompasses market sizing and forecasts for the various market segments.
The radiography test equipment market is segmented by technology (film Radiography, computed radiography, direct radiography, and computed tomography), end-user vertical (aerospace and defense, energy and power, construction, oil and gas, automotive, manufacturing, and other end-users), and geography (North America, Europe, Asia-Pacific, Latin America and Middle East and Africa). The market sizes and forecasts are provided in terms of value (USD) for all the above segments.
| Film Radiography |
| Computed Radiography |
| Direct Radiography |
| Computed Tomography |
| Hardware/Equipment |
| Software |
| Services |
| Weld Inspection |
| Corrosion and Erosion Monitoring |
| Casting and Forging Inspection |
| Composite Material Inspection |
| Other Applications |
| Aerospace and Defense |
| Energy and Power |
| Oil and Gas |
| Automotive |
| Construction and Infrastructure |
| Manufacturing and Heavy Engineering |
| Other End-User Industries |
| North America | United States | |
| Canada | ||
| Mexico | ||
| South America | Brazil | |
| Argentina | ||
| Chile | ||
| Rest of South America | ||
| Europe | Germany | |
| United Kingdom | ||
| France | ||
| Italy | ||
| Netherlands | ||
| Rest of Europe | ||
| Asia-Pacific | China | |
| India | ||
| Japan | ||
| South Korea | ||
| Rest of Asia-Pacific | ||
| Middle East and Africa | Middle East | Saudi Arabia |
| United Arab Emirates | ||
| Turkey | ||
| Rest of Middle East | ||
| Africa | South Africa | |
| Nigeria | ||
| Rest of Africa | ||
| By Technology | Film Radiography | ||
| Computed Radiography | |||
| Direct Radiography | |||
| Computed Tomography | |||
| By Component | Hardware/Equipment | ||
| Software | |||
| Services | |||
| By Application | Weld Inspection | ||
| Corrosion and Erosion Monitoring | |||
| Casting and Forging Inspection | |||
| Composite Material Inspection | |||
| Other Applications | |||
| By End-user Industry | Aerospace and Defense | ||
| Energy and Power | |||
| Oil and Gas | |||
| Automotive | |||
| Construction and Infrastructure | |||
| Manufacturing and Heavy Engineering | |||
| Other End-User Industries | |||
| By Geography | North America | United States | |
| Canada | |||
| Mexico | |||
| South America | Brazil | ||
| Argentina | |||
| Chile | |||
| Rest of South America | |||
| Europe | Germany | ||
| United Kingdom | |||
| France | |||
| Italy | |||
| Netherlands | |||
| Rest of Europe | |||
| Asia-Pacific | China | ||
| India | |||
| Japan | |||
| South Korea | |||
| Rest of Asia-Pacific | |||
| Middle East and Africa | Middle East | Saudi Arabia | |
| United Arab Emirates | |||
| Turkey | |||
| Rest of Middle East | |||
| Africa | South Africa | ||
| Nigeria | |||
| Rest of Africa | |||


Key Questions Answered in the Report
What is the current value of the radiography test equipment market?
The radiography test equipment market size stands at USD 1.52 billion in 2026.
How fast is the market expected to grow?
Revenues are forecast to reach USD 2.62 billion by 2031, reflecting an 11.55% CAGR.
Which region is expanding the quickest?
Asia-Pacific is projected to log a 12.30% CAGR through 2031, the fastest worldwide.
What technology segment is growing fastest?
Computed Tomography is advancing at 12.18% CAGR due to demand for full 3-D inspection.
Which application offers the highest growth upside?
Composite-material inspection leads with a 11.95% CAGR driven by aerospace adoption.
Page last updated on:


