Thermal Scanners Market Size and Share
Market Overview
| Study Period | 2019 - 2030 |
|---|---|
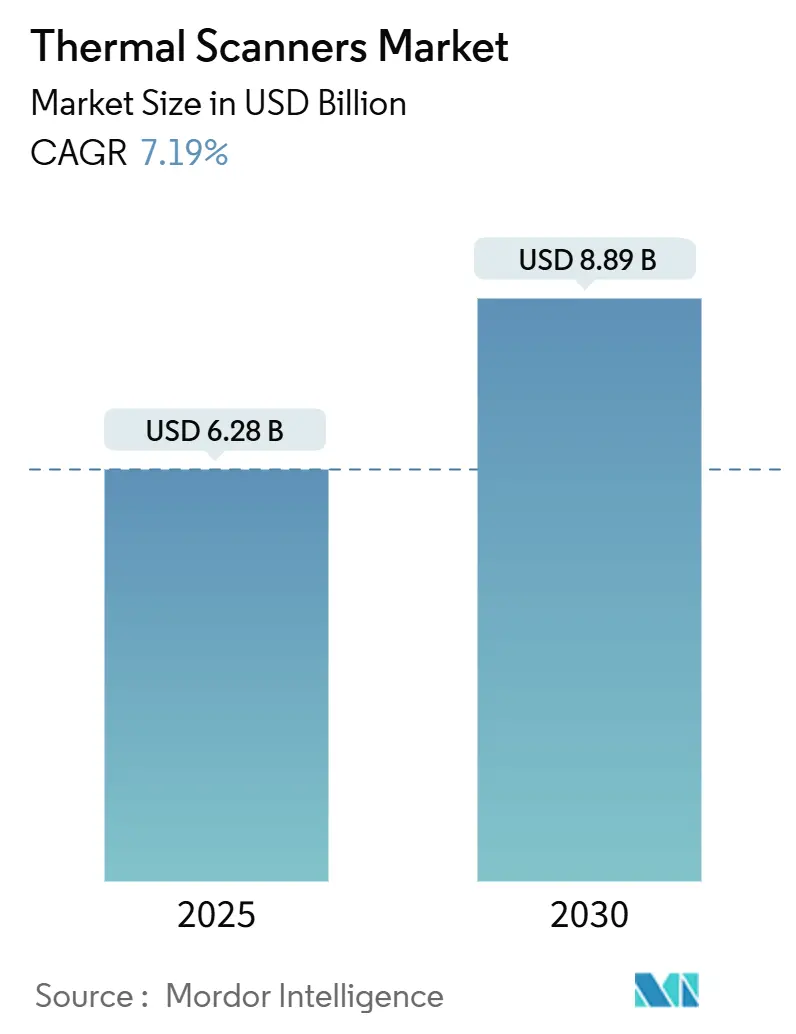
| Market Size (2025) | USD 6.28 Billion |
| Market Size (2030) | USD 8.89 Billion |
| Growth Rate (2025 - 2030) | 7.19% CAGR |
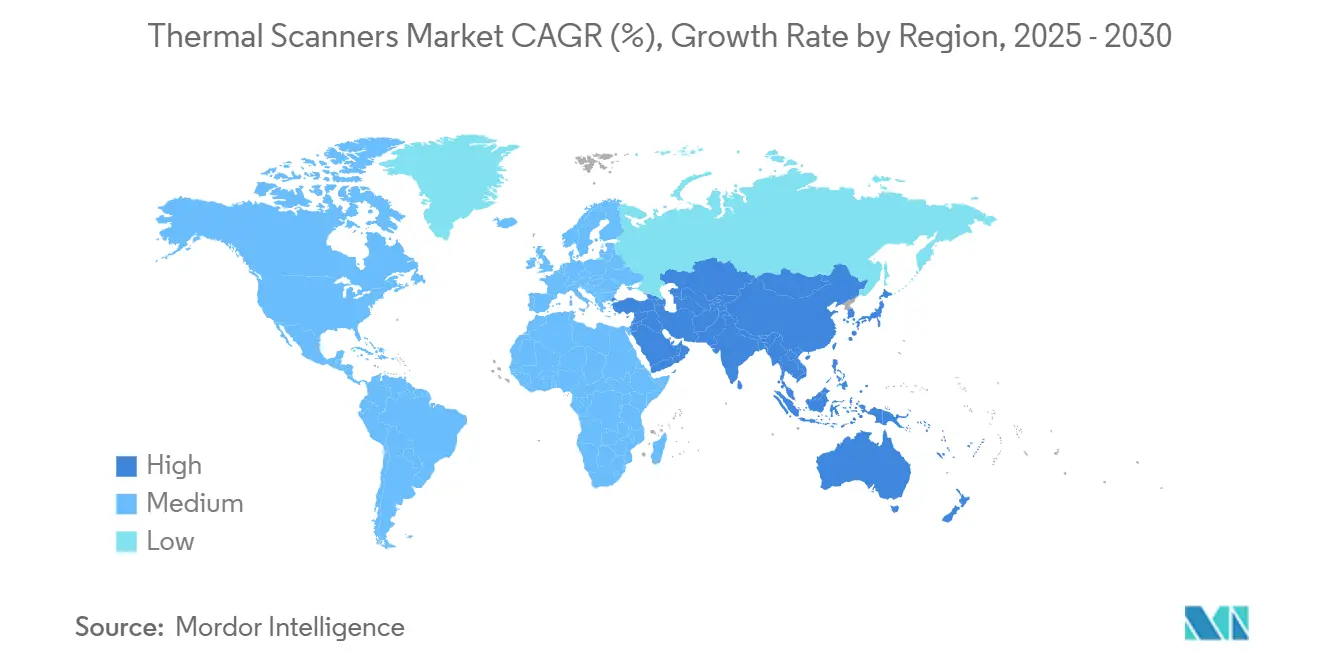
| Fastest Growing Market | Asia Pacific |
| Largest Market | North America |
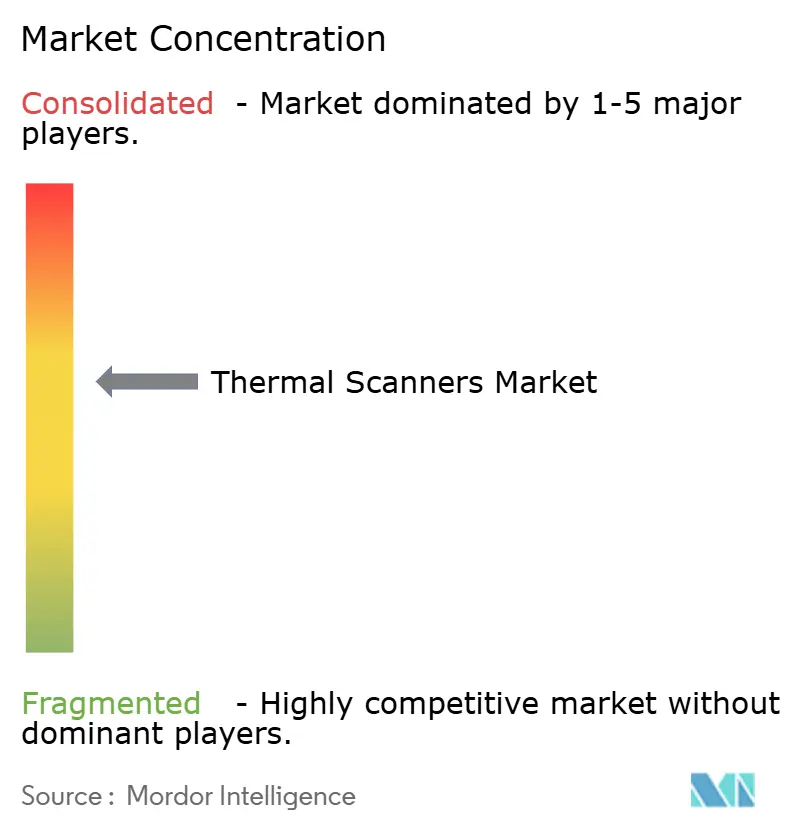
| Market Concentration | Medium |
Major Players *Disclaimer: Major Players sorted in no particular order Image © Mordor Intelligence. Reuse requires attribution under CC BY 4.0. | |
Thermal Scanners Market Analysis by Mordor Intelligence
The thermal scanner market size stood at USD 6.28 billion in 2025 and is expected to reach USD 8.89 billion by 2030, reflecting a 7.20% CAGR. Heightened perimeter-security programs at critical infrastructure, mandatory thermal inspections for utility-scale renewables, and the roll-out of AI-based multi-sensor fusion across defense, industrial, and healthcare domains have collectively supported that trajectory. Supply chain pressures-especially limited availability of high-purity quartz and export restrictions on advanced infrared detectors-kept component costs elevated during 2024 and the first half of 2025, yet demand resilience offset those headwinds as end-users prioritized uptime and compliance. Technology convergence has continued, with analytics chips now embedded directly on camera boards, shortening decision latency and enabling after-sales software revenue streams. Regional growth patterns have remained uneven: North America held the lead because of defense spending and cybersecurity mandates, while Asia Pacific delivered the fastest expansion as smart-city and automotive-safety investments accelerated.
Key Report Takeaways
- By product type, fixed and mounted platforms led with 45.89% of thermal scanner market share in 2024; handheld models posted the highest projected CAGR at 8.93% through 2030.
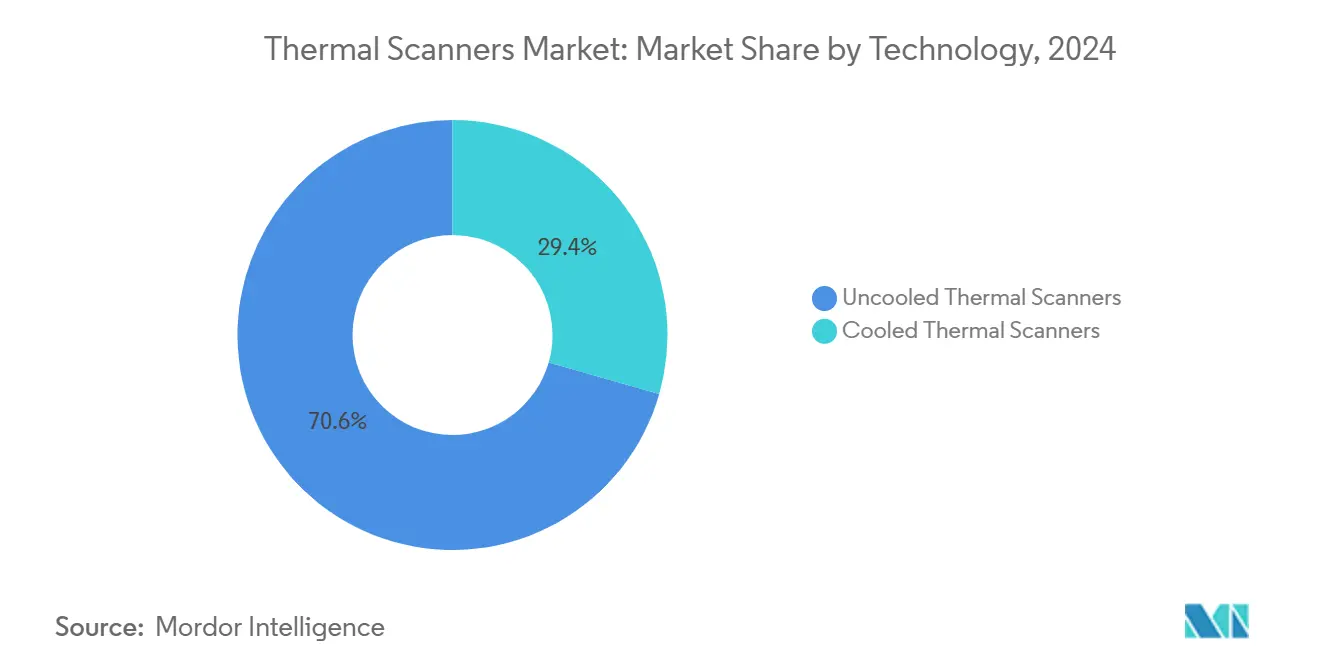
- By technology, uncooled devices accounted for 70.57% share of the thermal scanner market size in 2024, whereas cooled systems are forecast to advance at 9.12% CAGR to 2030.
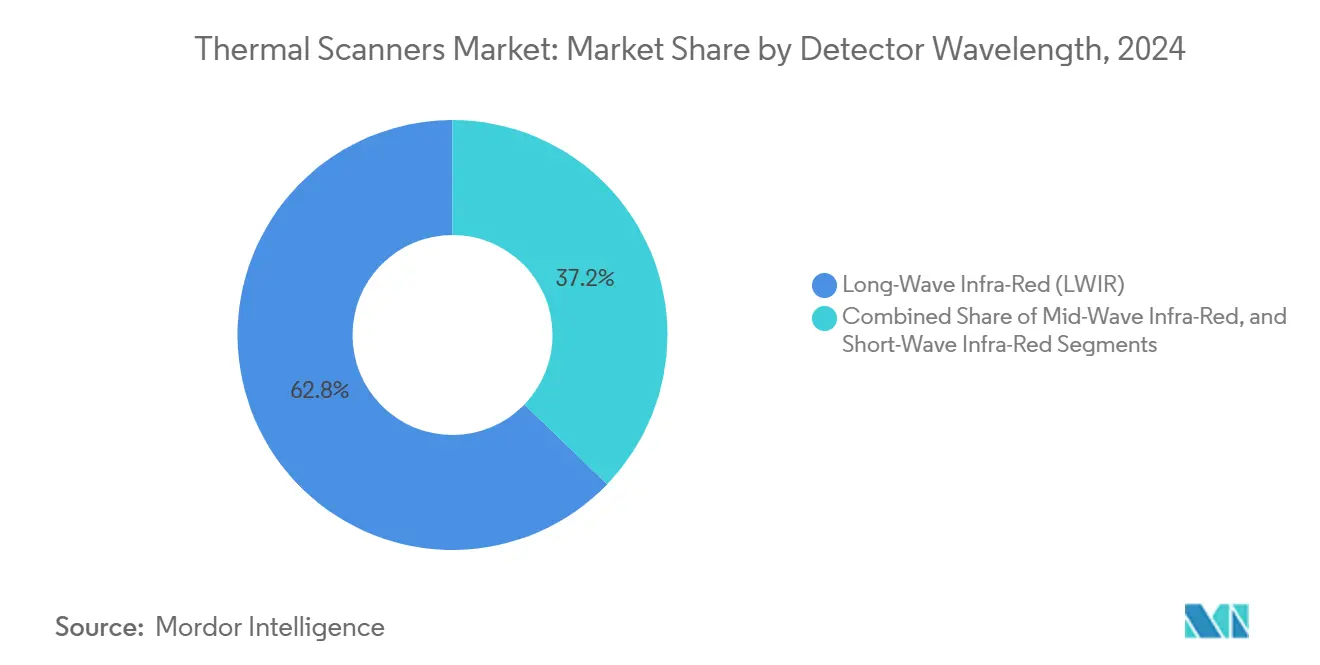
- By detector wavelength, LWIR held the largest market share of 62.78% in 2024, while SWIR is expected to grow at the fastest CAGR of 8.56% during the forecast period.
- By end-use industry, aerospace and defense accounted for 30.78% of the market share in 2024, with healthcare and life sciences projected to grow at a CAGR of 9.23% through 2030.
- By application, security and surveillance led with a 41.47% share in 2024, whereas human temperature screening is anticipated to grow at a CAGR of 8.74% by 2030.
- By geography, North America dominated with 32.73% revenue share in 2024; Asia Pacific is set to expand at an 8.83% CAGR through 2030.
Global Thermal Scanners Market Trends and Insights
Drivers Impact Analysis*
| Driver | (~) % Impact on CAGR Forecast | Geographic Relevance | Impact Timeline |
|---|---|---|---|
| Accelerated perimeter-security spending at critical infrastructure | +1.2% | Global, with concentration in North America and Europe | Medium term (2-4 years) |
| Mandatory thermal safety inspections in renewables (utility-scale solar, wind) | +0.8% | Global, with early adoption in Europe and Asia Pacific | Long term (≥ 4 years) |
| Growth of "touch-less" fever screening protocols in travel hubs | +0.6% | Global, with emphasis on Asia Pacific travel corridors | Short term (≤ 2 years) |
| Rapid price decline of uncooled micro-bolometer cores | +1.1% | Global manufacturing impact | Medium term (2-4 years) |
| AI-enabled multi-sensor fusion improving ROI of thermal deployments | +0.9% | North America and Europe leading, Asia Pacific following | Long term (≥ 4 years) |
| On-board thermal analytics chips opening after-sales service revenue | +0.4% | Global, concentrated in industrial markets | Long term (≥ 4 years) |
| Source: Mordor Intelligence | |||
Accelerated Perimeter-Security Spending at Critical Infrastructure
Thermal scanners became core elements of layered security architectures as operators upgraded detection ranges and analytics accuracy. Edge-processed dual-spectrum cameras identified humans beyond 10 miles and reduced false alarms during rain or fog, which had previously overwhelmed control centers. Data-center operators added 24/7 monitoring to meet zero-trust rules, while power utilities deployed combined visible and thermal systems to cut incident response times and lower patrol costs. Edge analytics also slashed bandwidth needs, helping remote substations keep operational costs flat despite higher video retention requirements.
Mandatory Thermal Safety Inspections in Renewables
Regulators enforced aerial thermography for solar farms under IEC TS 62446-3:2017, turning periodic scans into contractual obligations and enlarging demand for drone-mounted scanners. Blade-inspection routines on wind farms adopted YOLO v8/9 image-classification models, exposing micro-cracks and delaminations that erode turbine efficiency. Combining LiDAR with thermal imagery allowed detection of subsurface defects, protecting warranty coverage and rate-base returns. Solar-plant operators additionally matched thermal signatures to serial-number databases to confirm component authenticity, mitigating counterfeit-related power losses.
AI-Enabled Multi-Sensor Fusion Improving ROI
Neural-network-based Heat-Assisted Detection and Ranging (HADAR) filtered atmospheric noise to provide thermal images approaching daylight clarity while yielding depth maps for autonomous vehicles.[1]Science, “AI Brings Clarity to Fuzzy Night-Vision Images,” science.org Semantic-aware fusion networks joined super-resolution, fusion, and segmentation in one pipeline, boosting the accuracy of object recognition for defense perimeter systems. Automotive suppliers validated thermal-fused pedestrian emergency-braking modules that passed U.S. safety tests, demonstrating superior night detection compared with visible-only cameras.
Rapid Price Decline of Uncooled Micro-Bolometer Cores
Silicon-CMOS compatible processes cut packaging steps and slashed die costs, enabling new consumer-price thermal modules. Meridian Innovation secured USD 12.5 million to scale wafer-level vacuum packaging, lowering entry prices for smart-home and IoT devices. Nitrogen-doped amorphous SiGe membranes achieved noise-equivalent temperature differences of 22.35 mK without cooling, narrowing the performance gap with mid-wave sensors. Himax and Calumino integrated ultralow-power AI cores with uncooled imagers, opening route-to-volume in building-automation contracts.
Restraints Impact Analysis*
| Restraint | (~) % Impact on CAGR Forecast | Geographic Relevance | Impact Timeline |
|---|---|---|---|
| Export-control limitations on advanced infrared detectors | -0.8% | Global, with primary impact on US-China trade | Medium term (2-4 years) |
| Persistently high ASPs for cooled systems in scientific imaging | -0.5% | Global, concentrated in research institutions | Long term (≥ 4 years) |
| Low availability of thermography-trained workforce | -0.6% | Global, acute in North America and Europe | Long term (≥ 4 years) |
| Cyber-security concerns over network-connected thermal cameras | -0.4% | Global, with regulatory focus in Europe and North America | Short term (≤ 2 years) |
| Source: Mordor Intelligence | |||
Export-Control Limitations on Advanced Infrared Detectors
The U.S. Commerce Department required exporters to file detailed reports once shipments exceeded 100 units, while license reviews for detectors above specified sensitivities delayed deliveries to most destinations outside key allies.[2]ECFR, “15 CFR § 743.3 – Thermal Imaging Camera Reporting,” ecfr.gov China’s retaliatory quotas on gallium and germanium forced optics firms to redesign glass formulations and ramp recycling lines, raising lead times for mid-wave lenses. Such bilateral restrictions caused integrators to dual-source or localize assembly, tempering volume forecasts during 2025-2027.
Low Availability of Thermography-Trained Workforce
Certification demand outpaced course capacity as installations multiplied across utilities, aviation, and healthcare. The 20-hour sUAS Thermography Level 1 program drew higher enrollments yet still left many drone operators uncertified for IEC audits. HVAC contractors flagged gaps in trade-school curricula, prompting industry groups to pilot recruitment and micro-credential schemes. NFPA 70B 2023 expanded documentation requirements, adding reporting burdens that inexperienced technicians struggled to meet.[3]IR Info, “NFPA 70B 2023 Reporting Requirements,” irinfo.org
*Our forecasts treat driver/restraint impacts as directional, not additive. The impact forecasts reflect baseline growth, mix effects, and variable interactions.
Segment Analysis
By Technology: Growing Sophistication in Both Cooled and Uncooled Lines
Uncooled devices held 70.57% of thermal scanners market share in 2024, underscoring their suitability for mass adoption in buildings, drones, and predictive-maintenance programs. Their elimination of cryogenic equipment lowered capex and facilitated battery-powered field kits. The segment nevertheless advanced through software: edge AI compensated for lower signal-to-noise ratios, extending usability to applications once limited to mid-wave or long-wave cooled arrays. Cooled platforms, while smaller in volume, grew at a 9.12% CAGR as researchers, semiconductor fabs, and defense primes demanded sub-20 mK sensitivity and broader spectral reach. As a result, cooled lines captured larger margins despite representing less than one-third of units in the thermal scanners market size.
Crossover is emerging as uncooled membranes achieve below-25 mK thresholds, compressing conventional performance tiers. Vendors have started bundling hybrid packages, inserting a cooled core only when the scene’s dynamic range requires elevated detectivity. That architecture allows integrators to standardize mechanical housings and software across product families, simplifying life-cycle support contracts.


By Product Type: Fixed Installations Anchor Revenues as Portables Drive Incremental Demand
Fixed and mounted systems remained backbone solutions for utilities, data centers, and border agencies, representing 45.89% of 2024 revenue. Their hard-wired power supply enabled 24/7 operation, and enclosure ratings withstood extreme climates. Handheld thermal scanners, though accounting for a smaller base, delivered an 8.93% CAGR as solar technicians, first responders, and insurance adjusters required rapid on-site diagnostics. Multi-modal portables that merged thermal, RGB, and laser range-finding in palm-sized casings unlocked new revenue in structural-inspection contracts after building-code updates in several U.S. states.
Vehicle-mounted rotary systems filled wide-area surveillance roles at airports and coastlines, while integrated imaging platforms gained traction in automotive advanced driver-assistance systems (ADAS). Pedestrian-detection mandates effective 2029 in North America will position integrated modules for double-digit unit growth once automakers finalize Tier 1 sourcing agreements.
By End-Use Industry: Defense Retains Lead, Healthcare Rises
Aerospace and Defense accounted for 30.78% revenue because long-range surveillance and targeting remain core demand drivers. Programs such as the U.S. Army’s next-generation infrared weapon sight created multi-year backlogs for cooled detector suppliers.
Healthcare proceeded from pandemic-era screening toward broader diagnostic imaging and patient-monitoring use cases, giving the segment a 9.23% CAGR. Industrial maintenance sustained momentum: Nordic Sugar reported unscheduled downtime cuts of 80% after embedding AI models on steam-dryer thermal data. Automotive OEMs explored obligatory thermal-fused pedestrian detection, bringing prospective volumes that could rival current defense shipments post-2028.
By Detector Wavelength: LWIR Dominates, Yet SWIR Accelerates
Long-wave infrared remained the workhorse band, taking 62.78% share because its 8–14 µm sensitivity aligned with ambient-temperature targets found in most industrial and security scenes. Fever screening lanes maintained LWIR volumes, though traffic management and gas-leak detection widened adoption in 2024.
Short-wave infrared posted the fastest 8.56% CAGR as its lower atmospheric absorption facilitated imaging through smoke, mist, and glass, enabling high-temperature furnace monitoring and better material-sorting on recycling lines. Multispectral cameras that span SWIR, MWIR, and LWIR simultaneously entered pilot phases in 2025, promising single-payload solutions for complex analytical tasks.

By Application: Security Commands Spend, Screening Grows Fastest
Security and surveillance seized 41.47% of 2024 turnover because 24/7 monitoring fits thermal scanners’ core advantage of light-independent detection. Analytics upgrades reduced false positives by correlating thermal signatures with radar cues.
Human-temperature screening, though maturing, still expanded at 8.74% CAGR as airports converted temporary lanes into permanent infrastructure and hospitals added triage stations. Predictive-maintenance contracts bundled thermal sensing into subscription analytics, with AI models lowering maintenance cost bases by up to 40% according to case studies. Search-and-rescue drones employing thermal imagers and multimodal large language models trimmed detection errors in pilot tests.
Geography Analysis
North America retained 32.73% share of the thermal scanners market in 2024, buoyed by Department of Defense outlays and critical-infrastructure rules that required detection redundancy. Leonardo DRS posted 16% revenue growth in Q1 2025 on robust infrared orders, pushing its backlog beyond USD 8.6 billion. Hurricane Helene’s strike on Spruce Pine’s quartz mine disrupted optics supply, exposing regional dependencies that could temper shipments into 2026.
Asia Pacific generated the highest 8.83% CAGR, propelled by smart-factory programs, rising defense budgets, and automotive-safety mandates. China increased domestic output dramatically, moving from 15% to 63% box-level share between 2019 and 2020, though export controls limited foreign sales opportunities. South Korea authorized full airport rollouts of bird-strike prevention thermal systems starting March 2025. Singapore-based startups advanced wafer-level uncooled cores, positioning the country as a design hub.
Europe kept stable demand under safety and energy-efficiency regulations. Utilities integrated thermal inspections within predictive-maintenance frameworks to meet greenhouse-gas targets. Middle East and Africa began pilot perimeter projects protecting oil pipelines, while South America’s adoption followed industrial-production cycles, particularly in mining and pulp sectors.

Competitive Landscape
The market remained moderately consolidated. Teledyne FLIR, Leonardo DRS, and L3Harris secured multi-year defense contracts while broadening industrial portfolios. Leonardo DRS delivered 20% year-over-year revenue growth in Q2 2024, reflecting strength across electro-optical sensors. Motorola Solutions’ acquisition of Silent Sentinel extended its reach into 20-mile long-range camera niches.
Emerging entrants attacked price points: Meridian Innovation’s CMOS-compatible thermal dies cut bill-of-materials costs for IoT modules, while Himax-Calumino’s WiseEye processor bundled occupancy analytics into sub-USD 20 per-unit hardware. Traditional incumbents countered by embedding AI licences and API subscriptions, converting one-time hardware deals into recurring ARR. Automotive qualification represented a new battleground as Tier 1 suppliers raced to meet 2029 emergency-braking standards, potentially shifting volume leadership away from defense toward mobility.
Thermal Scanners Industry Leaders
Teledyne FLIR LLC
Leonardo DRS Inc.
L3Harris Technologies Inc.
Zhejiang Dahua Technology Co., Ltd.
Hikvision Digital Technology Co., Ltd.
- *Disclaimer: Major Players sorted in no particular order

Recent Industry Developments
- July 2025: THEON International invested in Baltic Photonics to localize Image Intensifier Tube component manufacturing.
- June 2025: Leonardo DRS won a USD 94 million U.S. Army contract for next-gen infrared weapon sights.
- March 2025: Teledyne FLIR secured order for Lightweight Vehicle Surveillance Systems integrating TacFLIR 380HD cameras.
- January 2025: Himax and Calumino introduced CMOS optical thermal sensor at CES 2025.


Global Thermal Scanners Market Report Scope
| Cooled Thermal Scanners |
| Uncooled Thermal Scanners |
| Hand-Held Thermal Scanners |
| Fixed / Mounted Thermal Scanners |
| Pan-Tilt / Rotary Systems |
| Integrated Imaging Platforms |
| Aerospace and Defense |
| Industrial Manufacturing |
| Commercial and Residential Building |
| Healthcare and Life-Sciences |
| Law-Enforcement and Public Safety |
| Other End-use Industries(Energy and Utilities, Automotive and Mobility) |
| Short-Wave Infra-Red (SWIR) |
| Mid-Wave Infra-Red (MWIR) |
| Long-Wave Infra-Red (LWIR) |
| Security and Surveillance |
| Condition Monitoring and Predictive Maintenance |
| Human Temperature Screening |
| Search and Rescue and Firefighting |
| Research and Development Imaging |
| North America | United States | |
| Canada | ||
| Mexico | ||
| South America | Brazil | |
| Argentina | ||
| Rest of South America | ||
| Europe | Germany | |
| United Kingdom | ||
| France | ||
| Italy | ||
| Spain | ||
| Rest of Europe | ||
| Asia-Pacific | China | |
| Japan | ||
| India | ||
| South Korea | ||
| Australia and New Zealand | ||
| Rest of Asia-Pacific | ||
| Middle East and Africa | Middle East | Saudi Arabia |
| United Arab Emirates | ||
| Turkey | ||
| Rest of Middle East | ||
| Africa | South Africa | |
| Nigeria | ||
| Rest of Africa | ||
| By Technology | Cooled Thermal Scanners | ||
| Uncooled Thermal Scanners | |||
| By Product Type | Hand-Held Thermal Scanners | ||
| Fixed / Mounted Thermal Scanners | |||
| Pan-Tilt / Rotary Systems | |||
| Integrated Imaging Platforms | |||
| By End-Use Industry | Aerospace and Defense | ||
| Industrial Manufacturing | |||
| Commercial and Residential Building | |||
| Healthcare and Life-Sciences | |||
| Law-Enforcement and Public Safety | |||
| Other End-use Industries(Energy and Utilities, Automotive and Mobility) | |||
| By Detector Wavelength | Short-Wave Infra-Red (SWIR) | ||
| Mid-Wave Infra-Red (MWIR) | |||
| Long-Wave Infra-Red (LWIR) | |||
| By Application | Security and Surveillance | ||
| Condition Monitoring and Predictive Maintenance | |||
| Human Temperature Screening | |||
| Search and Rescue and Firefighting | |||
| Research and Development Imaging | |||
| By Geography | North America | United States | |
| Canada | |||
| Mexico | |||
| South America | Brazil | ||
| Argentina | |||
| Rest of South America | |||
| Europe | Germany | ||
| United Kingdom | |||
| France | |||
| Italy | |||
| Spain | |||
| Rest of Europe | |||
| Asia-Pacific | China | ||
| Japan | |||
| India | |||
| South Korea | |||
| Australia and New Zealand | |||
| Rest of Asia-Pacific | |||
| Middle East and Africa | Middle East | Saudi Arabia | |
| United Arab Emirates | |||
| Turkey | |||
| Rest of Middle East | |||
| Africa | South Africa | ||
| Nigeria | |||
| Rest of Africa | |||


Key Questions Answered in the Report
How big was global demand for thermal scanners in 2025?
The thermal scanners market size reached USD 6.28 billion in 2025.
What growth rate is forecast for thermal scanners between 2025 and 2030?
Revenue is projected to climb at a 7.19% CAGR through 2030.
Which region is expanding the quickest?
Asia Pacific is expected to post an 8.83% CAGR to 2030, ahead of all other geographies.
Why are uncooled scanners so dominant?
With 70.57% market share in 2024, uncooled units win on lower cost, compact design, and elimination of cryogenic cooling.
What is the biggest end-use sector today?
Aerospace and Defense applications led revenue, accounting for 30.78% of 2024 sales.
Page last updated on:


