Near-infrared Spectroscopy Market Size and Share
Market Overview
| Study Period | 2019 - 2030 |
|---|---|
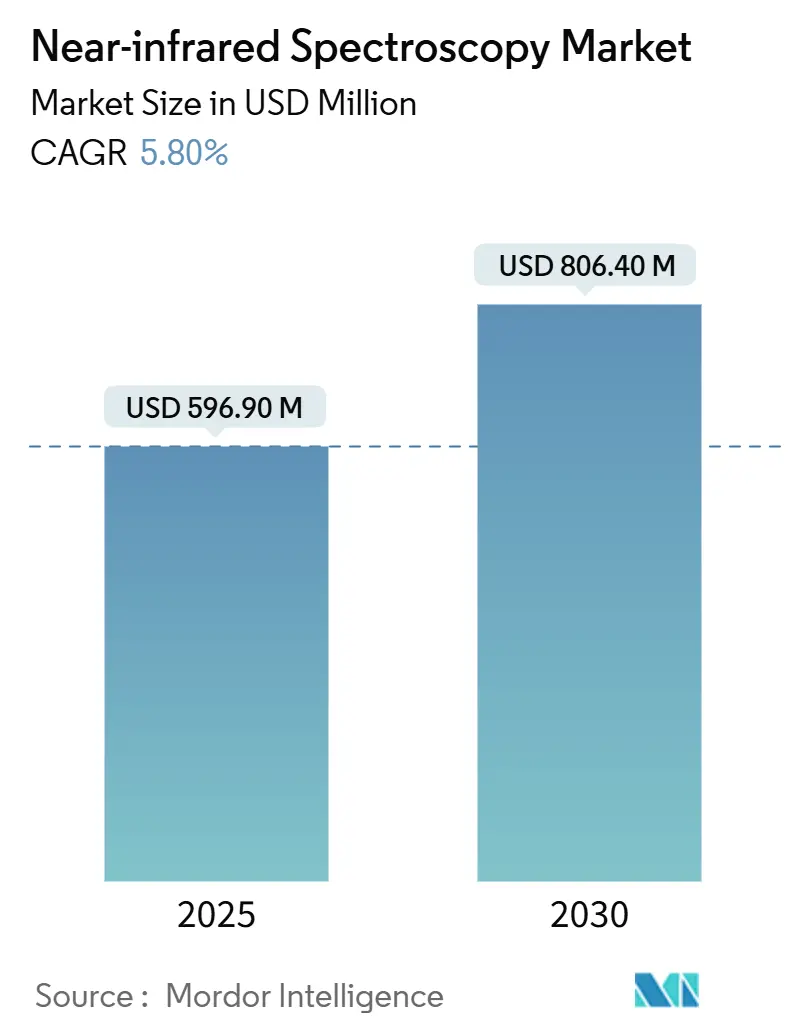
| Market Size (2025) | USD 596.90 Million |
| Market Size (2030) | USD 806.40 Million |
| Growth Rate (2025 - 2030) | 5.80% CAGR |
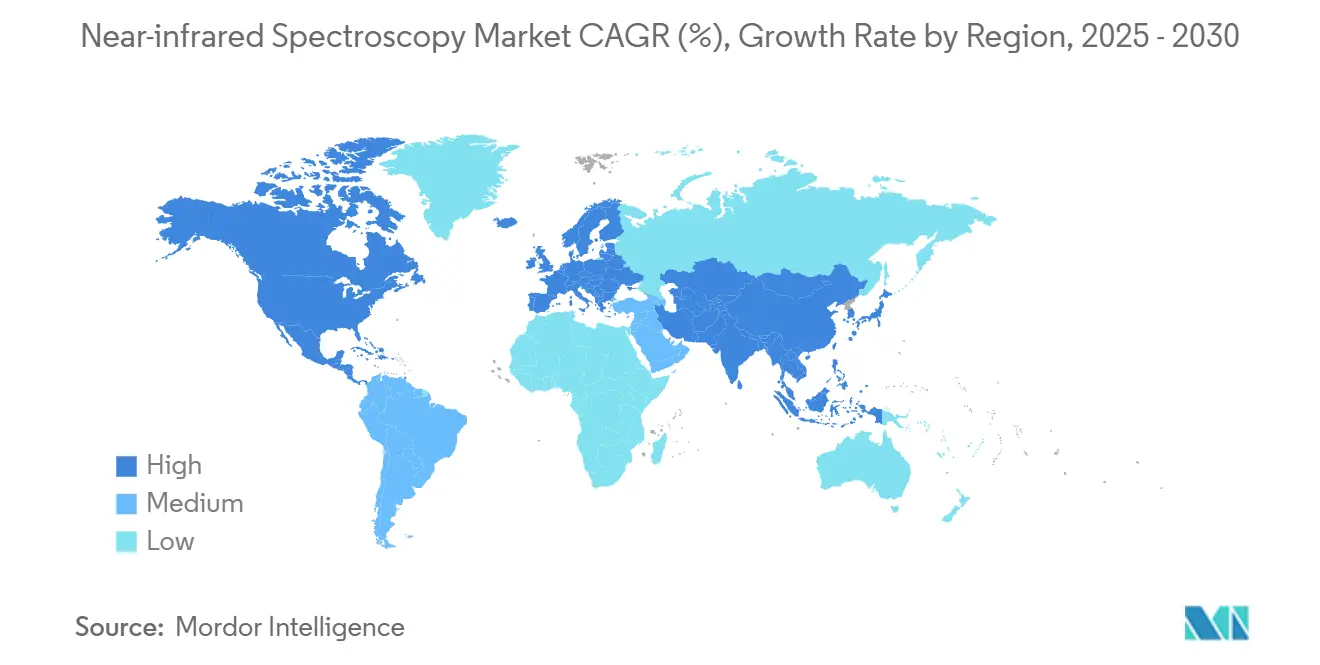
| Fastest Growing Market | Asia Pacific |
| Largest Market | North America |
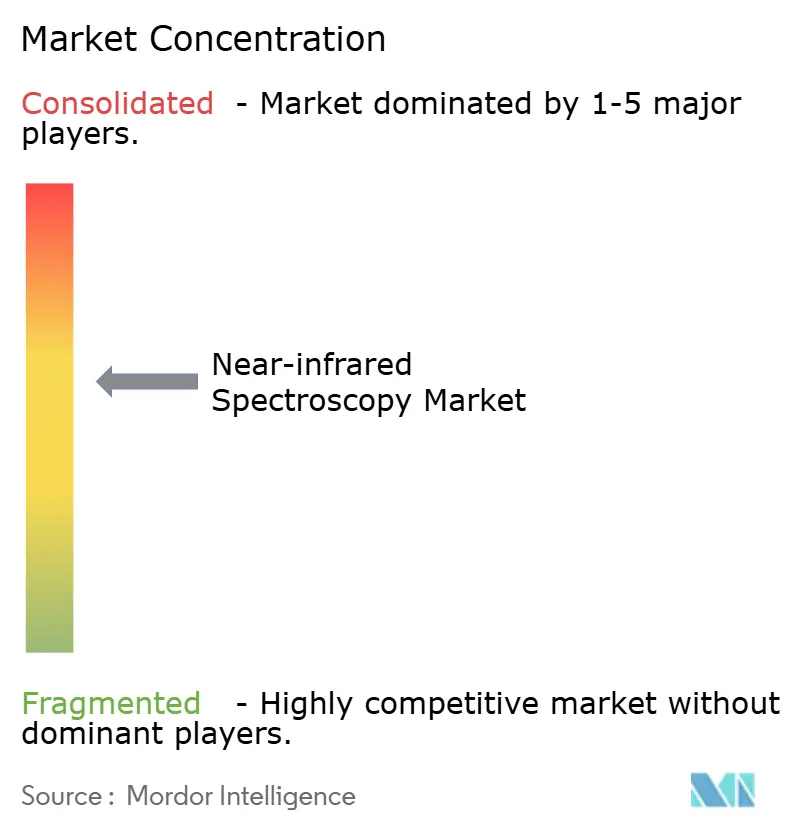
| Market Concentration | Medium |
Major Players *Disclaimer: Major Players sorted in no particular order Image © Mordor Intelligence. Reuse requires attribution under CC BY 4.0. | |
Near-infrared Spectroscopy Market Analysis by Mordor Intelligence
The near-infrared spectroscopy market size stands at USD 596.9 million in 2025 and is projected to expand at a 5.8% CAGR to reach USD 806.4 million by 2030. Strong pharmaceutical demand for real-time release testing, tighter food-safety rules, and miniaturized sensor innovation underpin this trajectory. Over the past year, the U.S. FDA clarified validation pathways for NIR analytical procedures, giving manufacturers the regulatory certainty needed to embed the technique in continuous-manufacturing lines. North America remains the revenue leader thanks to its advanced pharma base. Yet, Asia Pacific is registering the fastest unit additions as production migrates to lower-cost hubs and governments fund modern quality-control technology. Meanwhile, MEMS-based micro-spectrometers are compressing instrument footprints to the point where smartphone and IoT integration is commercially feasible, expanding addressable demand beyond classical laboratories.
Key Report Takeaways
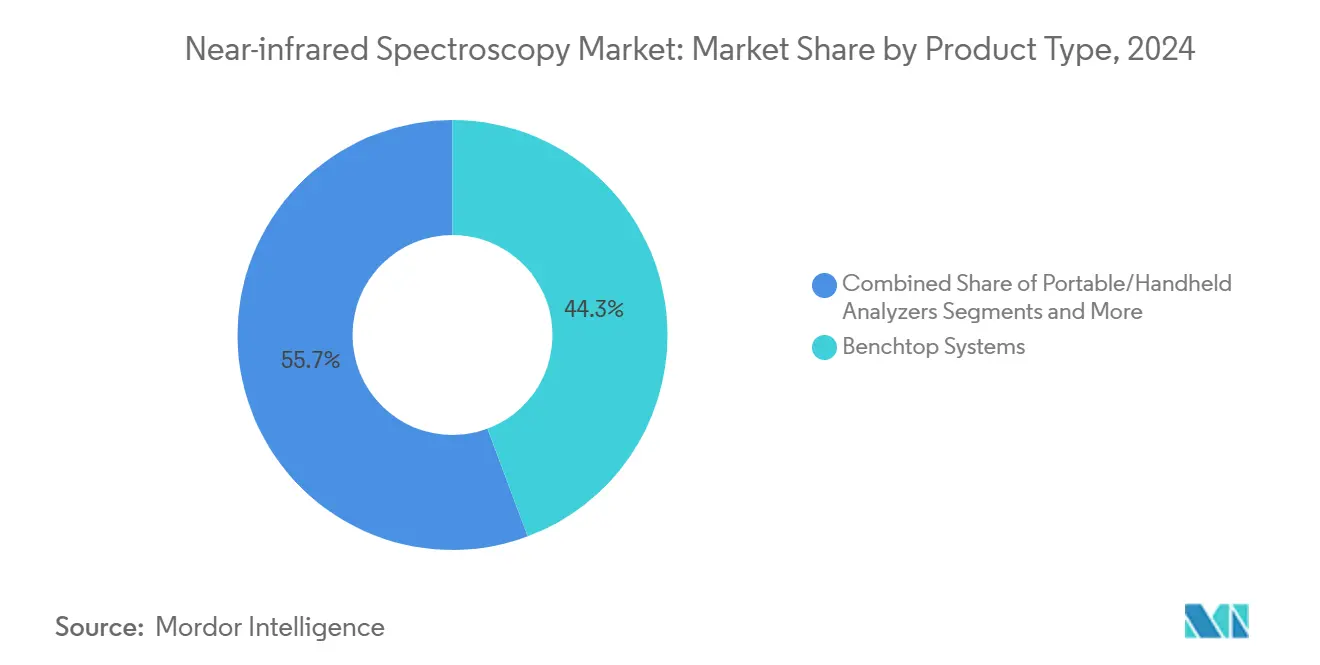
- By product type, benchtop systems led with 44.0% revenue share in 2024, while portable/handheld analyzers are tracking the highest projected 6.8% CAGR through 2030.
- By technology, FT-NIR captured 57.0% of the near-infrared spectroscopy market share in 2024, whereas MEMS micro-spectrometers are forecast to post the strongest 7.5% CAGR out to 2030.
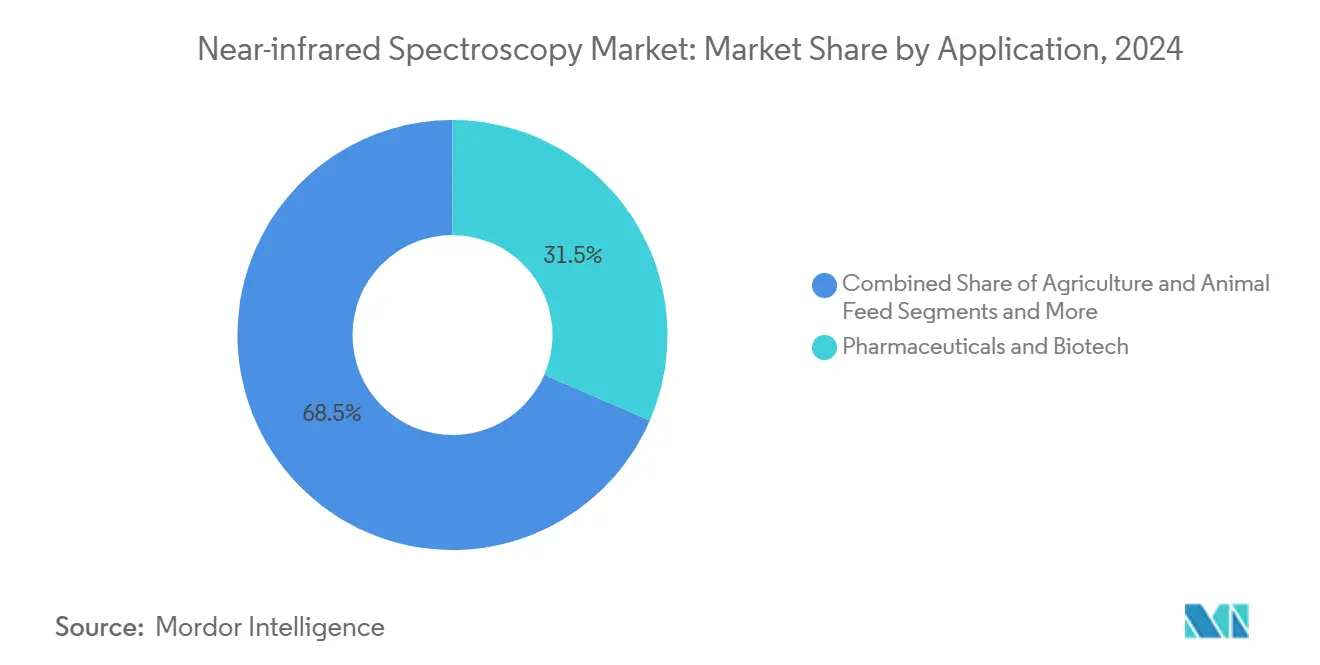
- By application, pharmaceuticals and biotechnology accounted for 31.5% of the near-infrared spectroscopy market size in 2024, with agriculture and feed applications expanding at a 5.9% CAGR through 2030.
- By end-user, industrial manufacturing held a 38.2% share in 2024, while hospitals and clinics are expected to rise at a 5.5% CAGR over the same period.
- By geography, North America commanded 35.8% of revenue in 2024, and Asia Pacific is set to grow at a 6.3% CAGR through 2030.
Global Near-infrared Spectroscopy Market Trends and Insights
Drivers Impact Analysis*
| Driver | (~) % Impact on CAGR Forecast | Geographic Relevance | Impact Timeline |
|---|---|---|---|
| Rising demand for real-time quality control in pharma manufacturing | +1.20% | North America, EU, global pharmacopeias | Medium term (2-4 years) |
| Stringent food-safety regulations boosting adoption | +0.90% | North America, EU, Asia Pacific | Short term (≤ 2 years) |
| Expansion of PAT in chemicals and oil & gas | +0.80% | North America & EU core; APAC spillover | Medium term (2-4 years) |
| Need for rapid, non-destructive analysis in agriculture & feed | +0.70% | APAC & North America | Short term (≤ 2 years) |
| Integration of MEMS NIR sensors in consumer IoT devices | +0.60% | APAC first movers; global rollout | Long term (≥ 4 years) |
| AI-enhanced chemometrics enabling predictive maintenance | +0.50% | Early adoption in developed markets | Medium term (2-4 years) |
| Source: Mordor Intelligence | |||
Rising Demand for Real-Time Quality Control in Pharma Manufacturing
NIR spectroscopy now anchors continuous-manufacturing lines because it can measure critical quality attributes every few seconds without destroying product, satisfying FDA PAT guidance requirements.[1]U.S. Department of Health and Human Services, “Development and Submission of Near Infrared Analytical Procedures,” fda.gov Major producers report cutting batch-failure rates by double-digit percentages after installing in-line NIR probes that monitor coating thickness and moisture content during tablet compression, eliminating costly end-of-run rework. The 2024 update to FDA guidance shortened validation cycles, leading to a surge in capital orders for FT-NIR platforms with integrated chemometric software. Predictive models trained on historical batches routinely achieve ≥ 98% identification accuracy, giving compliance teams the confidence to migrate from grab-sample HPLC to continuous NIR testing. Pharma corporations are also pairing NIR datasets with digital twins that forecast deviations hours in advance, sharpening OEE metrics and freeing laboratory resources for higher-value analytical work.
Stringent Food-Safety Regulations Boosting Adoption
Implementation of the Food Safety Modernization Act’s traceability rule is prompting processors to install rapid authenticity checks that fit within production takt times. Handheld NIR devices can flag 0.1% melamine adulteration in dairy powders in under 30 seconds, meeting new thresholds without sacrificing throughput.[2]Dolores Pérez-Marín, “NIR Sensing for Fraud Detection in Nuts,” mdpi.com Poultry-feed producers have started scanning incoming soybean meal for microplastic contamination, a process that previously required 24-hour lab cycles; early pilots show 96.3% detection accuracy, preventing tainted feed from entering bins. European Union Green Deal proposals mandating tighter pesticide-residue limits are likewise stimulating demand for high-resolution FT-NIR systems in fruit-sorting lines. Collectively, these compliance pressures add roughly 0.9 percentage points to the forecast CAGR for the near-infrared spectroscopy market.
Expansion of Process Analytical Technology in Chemicals & Oil & Gas
Refiners are deploying online NIR cells in crude-distillation overheads to track aromatics content, enabling furnace control loops that cut energy consumption by up to 2%.[3]lsevier Editorial Team, “Process Analytical Technology — An Overview,” ScienceDirect, sciencedirect.com Petrochemical crackers use the same instruments to monitor ethylene purity, reducing off-spec shipments and associated penalties. In dyes and specialty-chemicals production, NIR coupled with digital-twin simulators can predict optimal residence times, lifting yield by 3-5% in field trials. Regulatory momentum is also supportive; the EU’s Industrial Emissions Directive encourages adoption of continuous emissions monitoring technologies, where fiber-coupled NIR heads provide real-time VOC profiles. Vendors are reacting with ruggedized housings rated to IP67 and ambient temperatures to 200 °C, broadening applicability in harsh process areas.
Need for Rapid, Non-Destructive Analysis in Agriculture & Feed
Precision-agriculture programs incentivized by APAC governments equip farmers with portable NIR meters that report soil organic-carbon levels within minutes, letting agronomists fine-tune fertilizer prescriptions and reduce runoff. Maize traders employing hyperspectral NIR imaging detect aflatoxin B1 in silage before bulk storage, protecting feed-lot operators from costly recalls. Machine-learning classifiers embedded in cloud dashboards classify grain protein content with > 95% accuracy, feeding dynamic pricing algorithms that reward growers for higher quality. Drone-mounted NIR cameras add aerial vigor indices to the decision mix, facilitating variable-rate irrigation schedules in drought-prone regions. The adoption wave is particularly pronounced in China, India, and Australia, where large-scale commodity producers gain high ROI from real-time quality data.
Restraints Impact Analysis*
| Restraint | (~) % Impact on CAGR Forecast | Geographic Relevance | Impact Timeline |
|---|---|---|---|
| High instrument & maintenance cost for SMEs | -0.80% | Emerging markets hardest hit | Short term (≤ 2 years) |
| Limited wavelength penetration depth | -0.60% | Global; dense-sample industries | Medium term (2-4 years) |
| Data-standardization hurdles for cloud model sharing | -0.40% | Developed markets first | Medium term (2-4 years) |
| Competition from mid-IR quantum-cascade laser systems | -0.50% | North America & EU core | Long term (≥ 4 years) |
| Source: Mordor Intelligence | |||
High Instrument & Maintenance Cost for SMEs
Traditional benchtop NIR units often exceed USD 50,000, a sum that outstrips the cap-ex budgets of many small food processors and nutraceutical startups. Annual service contracts typically add 10-15% of the purchase price, while calibration and chemometric model development demand specialized staff. Although cloud-hosted model libraries reduce expertise barriers, recurring subscription fees can negate savings. MEMS sensors offer a cheaper entry point, yet their narrower spectral range limits deployment to basic moisture or protein assays. Consequently, SMEs in Latin America and Africa defer adoption, attenuating global growth by an estimated 0.8 percentage points during the early forecast window.
Limited Wavelength Penetration Depth
NIR photons penetrate only 1–2 mm into dense matrices, curtailing applicability for bulk or subsurface analysis. Thick cheese wheels, multilayer polymer sheets, and certain pharmaceutical pellets remain difficult to characterize non-destructively, forcing reliance on destructive sampling. Multibounce ATR accessories partially mitigate the issue but add optical complexity and cost. Mid-IR quantum-cascade lasers deliver higher specificity at greater depths, prompting some petrochemical users to cross-grade systems where process streams are opaque. Vendors respond with hybrid instruments combining NIR for broad screening and mid-IR for deep dives, yet the compromise raises price tags and lengthens ROI.
*Our forecasts treat driver/restraint impacts as directional, not additive. The impact forecasts reflect baseline growth, mix effects, and variable interactions.
Segment Analysis
By Product Type: Benchtop Systems Remain the Analytical Workhorse
Benchtop platforms generated 44.0% of 2024 revenue as laboratories prioritized high signal-to-noise ratios and regulatory familiarity. These units support full-spectrum scanning and robust chemometric packages, making them indispensable for pharmaceutical method validation and academic research. Over the forecast horizon, incremental improvements—auto-dry-purge optics, motor-free interferometers, and remote-diagnostic firmware—aim to keep benchtops relevant even as field devices gain traction. Portable and handheld analyzers, growing at 6.8% CAGR, capitalize on demand for point-of-use screening in meats, grains, and industrial polymers. Their lithium-ion battery runtimes now exceed 10 hours, pleasing agronomists who sample crops across large acreages.
Process and on-line analyzers integrate directly with manufacturing lines to deliver second-by-second readings to PLCs, reinforcing just-in-time quality strategies. Feature convergence is evident: some OEMs now offer modular casings that accept either a diffuse-reflectance head for powders or a transflectance probe for liquids, maximizing asset utilization. Functional near-infrared (fNIRS) imaging devices, though niche, tap clinical budgets for brain-function monitoring and neonatal research, offering hospitals non-invasive insight without radiation exposure.


By Technology: FT-NIR Holds Court as MEMS Chips Challenge the Throne
Fourier-transform technology secured 57.0% revenue in 2024, buoyed by its reproducibility and pharmacopeial recognition. Its Michelson interferometer design captures complete spectral information in less than one second, an advantage for high-throughput solid-dose testing. Firmware advances now correct for moving-mirror drift in real time, extending calibration stability beyond 12 months. Yet MEMS-based scanning filters are rewriting the cost-performance curve, matching picometer precision in a package smaller than a postage stamp. Early commercial adopters report 2× instrument-per-technician productivity gains when MEMS heads replace centralized benchtops in multisite field operations.
Dispersive designs occupy mid-tier price points, serving feed mills and polymer compounding facilities that value ruggedness over ultimate resolution. Acousto-optic tunable filters deliver millisecond wavelength switching, catering to research setups exploring dynamic reaction kinetics. Hadamard Transform variants cater to specialists needing enhanced signal-to-noise in photon-starved scenarios, such as trace moisture in lyophilized vaccines. Overall, the near-infrared spectroscopy market is on a bifurcated trajectory: FT-NIR will dominate pharma, while MEMS unlocks consumer and IoT realms, expanding total addressable demand well beyond legacy laboratory confines.
By Application: Pharma Dominates but Agri-Feed Surges
With 31.5% revenue share in 2024, pharmaceutical and biotech labs deploy NIR for blend uniformity, coating thickness, and moisture profiling to satisfy real-time-release guidelines. The near-infrared spectroscopy market share for pharma could inch up as continuous manufacturing adoption deepens, yet its unit growth slows relative to agricultural demand. Agri-feed users, growing at 5.9% CAGR, increasingly scan incoming grains for protein and mycotoxins, driven by feed-safety regulations and margin pressures. Portable spectrometers reduce lab backlog and enable dockside reject decisions, cutting logistic costs.
Food and beverage processors rely on NIR’s rapid, non-destructive nature to authenticate coffee origin or measure fat in meat emulsions. Chemical and petrochemical users benefit from on-line NIR for reaction monitoring, although mid-IR competition is intensifying. Environmental and clinical diagnostics remain emergent niches; research labs have demonstrated 98.8% accurate non-invasive glucose readings, hinting at future consumer health devices. Cumulatively, diversification across sectors insulates the near-infrared spectroscopy market against cyclical downturns in any single vertical.
By End-User: Industrial Manufacturing Sits Atop a Diverging Demand Curve
Industrial plants represented 38.2% of 2024 spend, positioning NIR as a linchpin of Industry 4.0 quality loops. Automotive paint shops, snack-food lines, and polymer extrusion halls all leverage real-time moisture or color data to adjust process parameters on the fly. Hospitals and clinics, although currently under 10% of revenue, are projected to rise at a 5.5% CAGR as portable NIR devices screen respiratory infections and monitor tissue oxygenation in surgical suites. Research institutes remain core customers for high-spec FT-NIR rigs that serve multi-disciplinary studies, from plant phenotyping to battery-electrolyte research.
Contract testing laboratories capitalize on outsourcing trends among SME food producers that cannot justify in-house instruments. Government agencies deploy NIR vans for roadside fuel adulteration checks and customs inspections, expanding the technology's visibility across regulatory landscapes. As subscription chemistry databases and AI models proliferate, even small laboratories can offer sophisticated NIR assays, driving a virtuous adoption cycle.
Geography Analysis
North America retains its lead status because FDA oversight prompts early technology adoption in the pharma and food sectors. Public-private investment programs, such as the U.S. Bioindustrial Initiative, channel grants toward PAT tools, directly boosting instrument placements. Academic-industry consortia headquartered in Illinois and Massachusetts accelerate method development, ensuring a deep talent pool.
Asia Pacific’s momentum arises from expanding chemical parks and agri-food processing zones. State-backed agritech funds in China underwrite precision-nutrient projects, resulting in bulk purchases of handheld NIR meters. In India, dairy cooperatives leverage micro-spectrometers to verify milk solids at village collection centers, shortening payment cycles and reducing adulteration incidents.
Europe’s compliance-driven demand stabilizes around modernization of legacy FT-NIR fleets to support lower detection limits mandated by the Farm-to-Fork strategy. Adoption of HyperNIR for environmental surveillance opens adjunct revenue lanes, particularly in Germany and the Netherlands where industrial wastewater monitoring is tightly regulated.

Competitive Landscape
The market structure is moderately fragmented: the top five players collectively command roughly 45% of revenue, while dozens of regional integrators tackle niche verticals. Incumbents—Thermo Fisher, Bruker, and PerkinElmer—prioritize portfolio breadth, coupling FT-NIR benchtops with rugged on-line probes. Bruker’s 14.6% 2024 revenue jump underscores the efficacy of bolt-on acquisitions that fill spectral-software gaps. Strategics funnel R&D into AI chemometrics and instrument self-diagnostics to defend margins.
Disruptors operate on two fronts. MEMS-sensor start-ups such as Si-Ware monetize manufacturing scale in semiconductor fabs to slash the cost per spectral channel. Analytics-as-a-service firms bundle model libraries with cloud dashboards, positioning themselves as vendor-agnostic overlays that erode OEM lock-in. IP filings reveal a shift toward multi-modal instruments blending Raman, mid-IR, and NIR in a single chassis, reflecting customer appetite for holistic molecular fingerprints.
Partnership activity is brisk. Instrument vendors pair with ERP providers to integrate quality data into plant MES layers, while smartphone OEMs license spectral engines to differentiate wellness features. Venture funding chases medical-diagnostic spin-outs exploring optical biopsy and metabolic monitoring, foreshadowing new entrants outside classical instrumentation circles.
Near-infrared Spectroscopy Industry Leaders
Thermo Fisher Scientific
Bruker Corporation
Agilent Technologies
PerkinElmer
FOSS
- *Disclaimer: Major Players sorted in no particular order

Recent Industry Developments
- March 2025: Ruhr-University Bochum researchers unveiled HyperNIR for real-time microplastic detection in water.
- December 2024: Kyoto University advanced quantum infrared spectroscopy across the 2–5 µm band, paving paths for compact instruments.
- August 2024: Si-Ware introduced the NeoSpectra Micro, a USD 100 chip-sized NIR sensor for industrial and consumer devices.


Global Near-infrared Spectroscopy Market Report Scope
| Benchtop Systems |
| Portable/Handheld Analyzers |
| Process/On-line Analyzers |
| FT-NIR Spectrometers |
| fNIRS Imaging Devices |
| Fourier-Transform (FT-NIR) |
| Dispersive NIR |
| MEMS-Based Micro-spectrometers |
| Acousto-optic Tunable Filter (AOTF) |
| Hadamard Transform NIR |
| Pharmaceuticals & Biotechnology |
| Food & Beverage Quality Control |
| Agriculture & Animal Feed |
| Chemical & Petrochemical |
| Environmental & Clinical Diagnostics |
| Industrial Manufacturing |
| Research & Academic Institutes |
| Contract Analytical Labs |
| Hospitals & Clinics |
| Government & Regulatory Agencies |
| North America | United States |
| Canada | |
| Mexico | |
| Europe | Germany |
| United Kingdom | |
| France | |
| Italy | |
| Spain | |
| Rest of Europe | |
| Asia Pacific | China |
| Japan | |
| India | |
| South Korea | |
| Australia | |
| Rest of Asia Pacific | |
| Middle East & Africa | GCC |
| South Africa | |
| Rest of Middle East & Africa | |
| South America | Brazil |
| Argentina | |
| Rest of South America |
| By Product Type | Benchtop Systems | |
| Portable/Handheld Analyzers | ||
| Process/On-line Analyzers | ||
| FT-NIR Spectrometers | ||
| fNIRS Imaging Devices | ||
| By Technology | Fourier-Transform (FT-NIR) | |
| Dispersive NIR | ||
| MEMS-Based Micro-spectrometers | ||
| Acousto-optic Tunable Filter (AOTF) | ||
| Hadamard Transform NIR | ||
| By Application | Pharmaceuticals & Biotechnology | |
| Food & Beverage Quality Control | ||
| Agriculture & Animal Feed | ||
| Chemical & Petrochemical | ||
| Environmental & Clinical Diagnostics | ||
| By End-User | Industrial Manufacturing | |
| Research & Academic Institutes | ||
| Contract Analytical Labs | ||
| Hospitals & Clinics | ||
| Government & Regulatory Agencies | ||
| By Geography | North America | United States |
| Canada | ||
| Mexico | ||
| Europe | Germany | |
| United Kingdom | ||
| France | ||
| Italy | ||
| Spain | ||
| Rest of Europe | ||
| Asia Pacific | China | |
| Japan | ||
| India | ||
| South Korea | ||
| Australia | ||
| Rest of Asia Pacific | ||
| Middle East & Africa | GCC | |
| South Africa | ||
| Rest of Middle East & Africa | ||
| South America | Brazil | |
| Argentina | ||
| Rest of South America | ||


Key Questions Answered in the Report
How large is the near-infrared spectroscopy market in 2025?
It is valued at USD 596.9 million in 2025, with a projected 5.8% CAGR through 2030.
Which region is growing fastest for near-infrared spectroscopy?
Asia Pacific is expected to post the highest 6.3% CAGR as manufacturing and precision-agriculture investments expand.
What segment leads by product type?
Benchtop systems hold 44.0% revenue share in 2024 thanks to their analytical precision and regulatory acceptance.
Why are MEMS-based NIR sensors important?
They reduce cost and footprint, enabling integration into smartphones and IoT devices, which broadens future demand.
What restrains small firms from adopting NIR?
High upfront instrument cost (often > USD 50,000) and ongoing maintenance fees deter many SMEs.
Which application area shows the highest absolute market share?
Pharmaceuticals and biotechnology maintain leadership with 31.5% of 2024 revenue due to stringent quality-control needs.
Page last updated on:


