Laser Marking Market Size and Share
Market Overview
| Study Period | 2020 - 2031 |
|---|---|
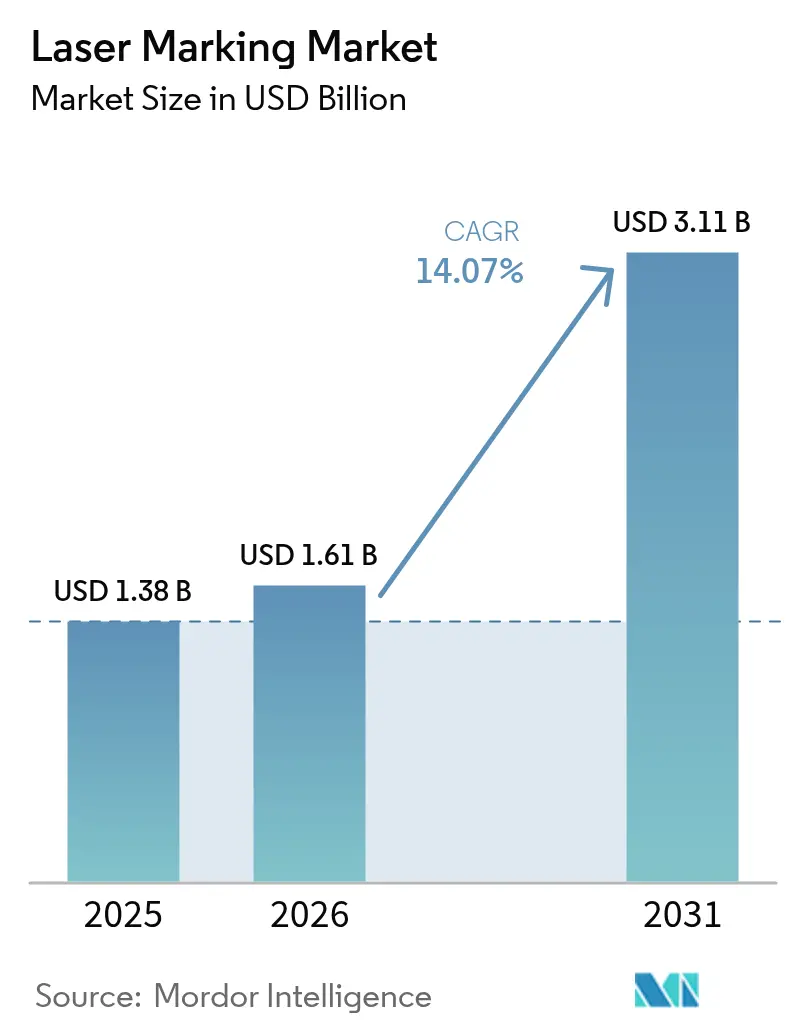
| Market Size (2026) | USD 1.61 Billion |
| Market Size (2031) | USD 3.11 Billion |
| Growth Rate (2026 - 2031) | 14.07% CAGR |
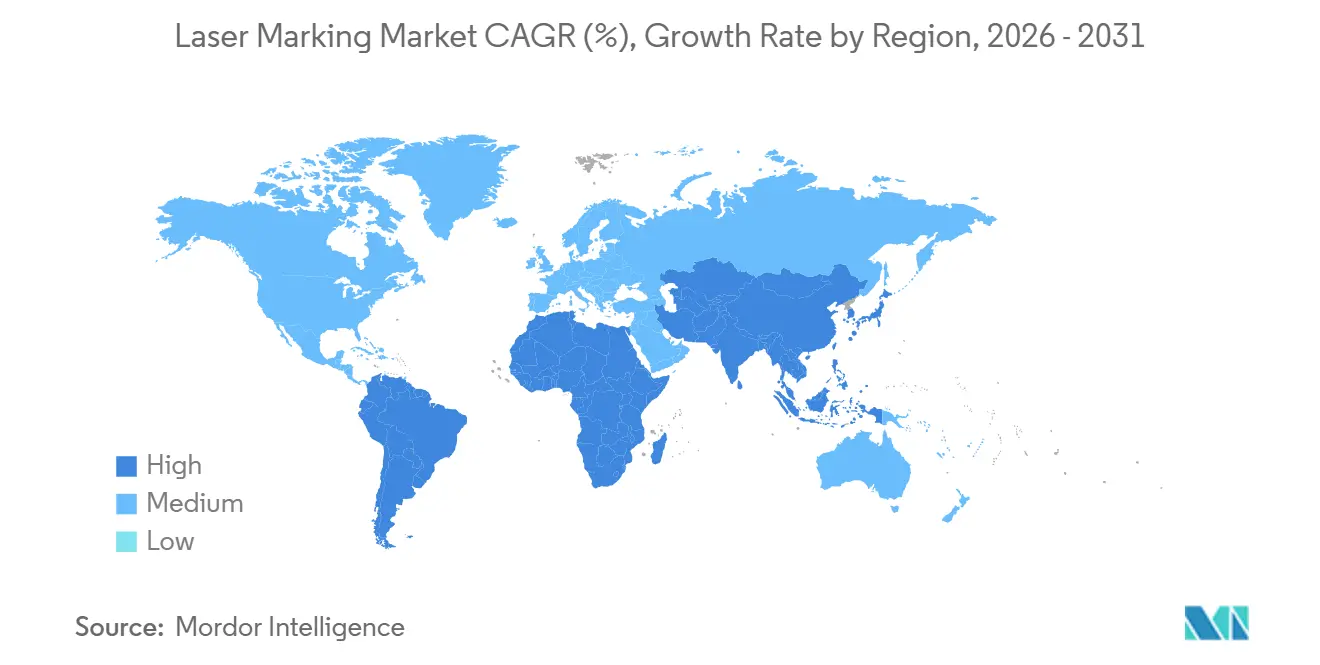
| Fastest Growing Market | South America |
| Largest Market | Asia |
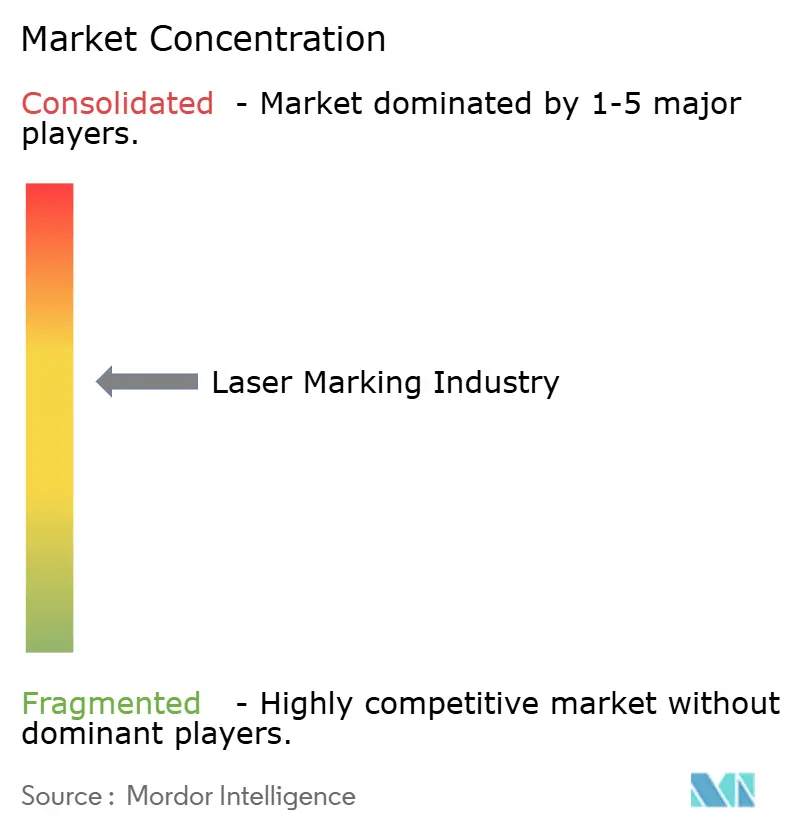
| Market Concentration | Medium |
Major Players *Disclaimer: Major Players sorted in no particular order Image © Mordor Intelligence. Reuse requires attribution under CC BY 4.0. | |
Laser Marking Market Analysis by Mordor Intelligence
The laser marking market size is expected to increase from USD 1.38 billion in 2025 to USD 1.61 billion in 2026 and reach USD 3.11 billion by 2031, growing at a CAGR of 14.07% over 2026-2031. Robust regulatory pressure for traceability across medical devices, batteries, and packaging has turned laser coding from a discretionary purchase into a line-stopper safeguard. Automakers now embed fiber-laser heads inside battery-module cells to slash scan errors, while semiconductor fabs shift to UV wavelengths that print sub-10-micron codes on logic dies without thermal damage. Global price competition from Chinese vendors is compressing hardware margins, so incumbent suppliers pivot to software subscriptions that guarantee read-rate uptime. The fastest demand inflection is occurring in the Middle East, where Saudi industrial projects specify ISO 9001-compliant marking on every aerospace fastener and defense casting.
Key Report Takeaways
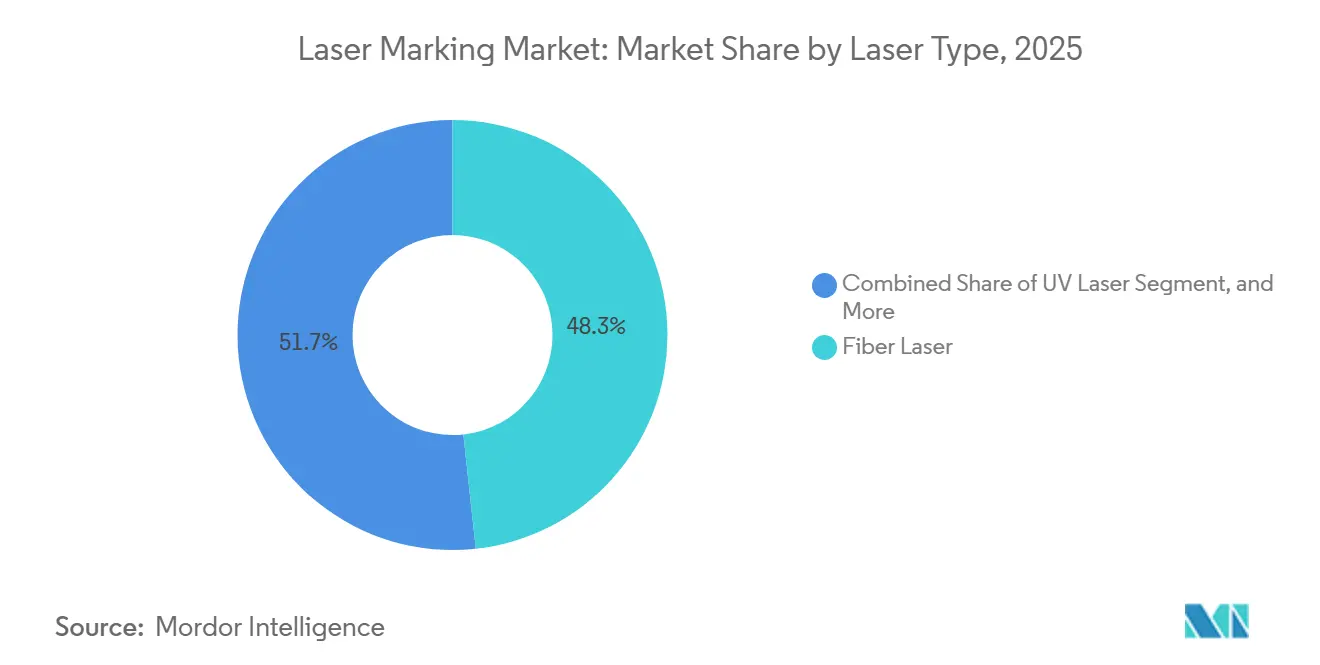
- By laser type, fiber systems led with 48.27% revenue share in 2025, whereas UV platforms are projected to advance at a 14.27% CAGR through 2031.
- By marking process, engraving accounted for 31.41% of 2025 volume, and carbonization is forecast to expand at a 14.63% CAGR to 2031.
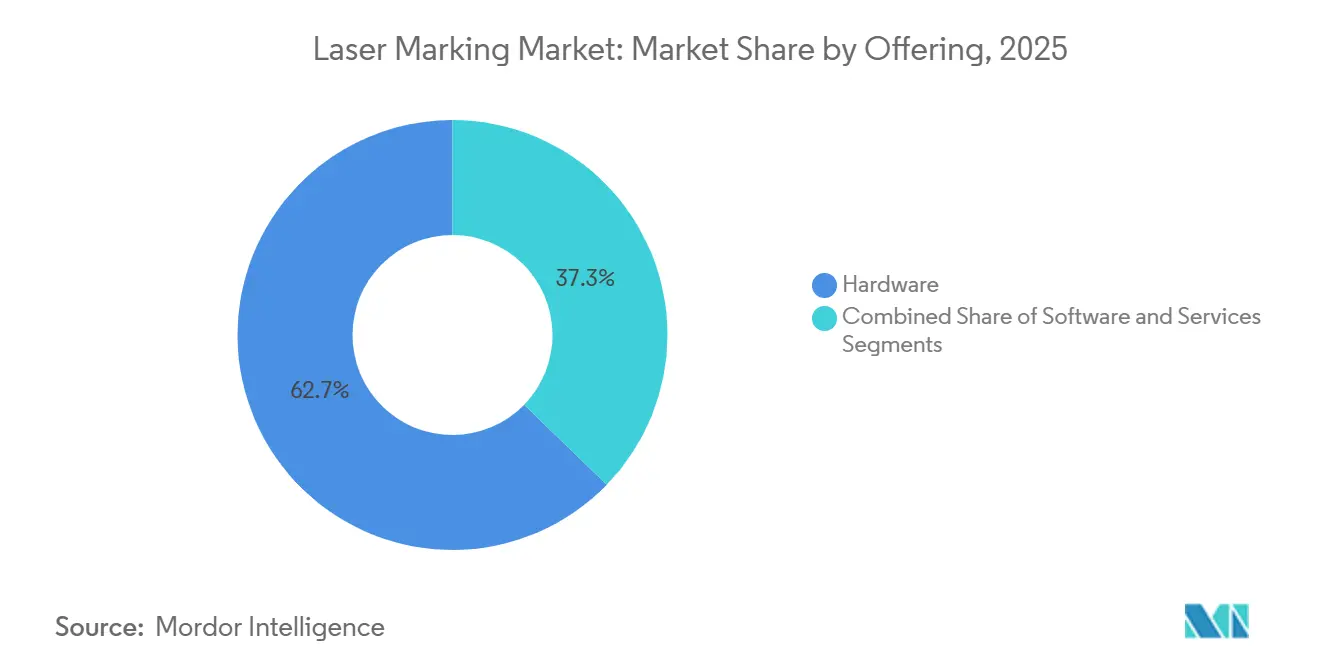
- By offering, hardware held 62.73% share of the laser marking market size in 2025, while software is the quickest-growing component at 14.55% CAGR.
- By end-user industry, electronics and semiconductors represented 28.95% revenue share in 2025; medical devices and healthcare are poised for the highest 14.91% CAGR through 2031.
- By geography, Asia-Pacific commanded 39.54% of the laser marking market share in 2025, whereas the Middle East is set to post the sharpest 14.99% CAGR to 2031.
Note: Market size and forecast figures in this report are generated using Mordor Intelligence’s proprietary estimation framework, updated with the latest available data and insights as of 2026.
Global Laser Marking Market Trends and Insights
Drivers Impact Analysis*
| Driver | (~) % Impact on CAGR Forecast | Geographic Relevance | Impact Timeline |
|---|---|---|---|
| Mandatory UDI and Traceability Regulations in Medical Devices (US, EU, CN) | +1.20% | Global, with enforcement concentration in North America, EU, and China | Medium term (2-4 years) |
| Surge in EV Battery Production, Contact-less Marking Demand | +1.00% | APAC core (China, South Korea, Japan), spill-over to North America and EU | Medium term (2-4 years) |
| Miniaturized Consumer Electronics Driving Micro-Marking in Asia | +0.80% | Asia-Pacific, particularly China, Taiwan, South Korea, and Vietnam | Short term (≤ 2 years) |
| Sustainable Packaging Shift, Laser Coding over Inkjet in Europe | +0.60% | Europe, with early adoption in Germany, France, and Nordics | Medium term (2-4 years) |
| Industry 4.0 In-line Integration in North-American Automotive Plants | +0.50% | North America, with secondary adoption in EU automotive corridors | Long term (≥ 4 years) |
| Jewelry Hallmarking Digitization Policy Boost in India | +0.40% | National (India), with early gains in Mumbai, Delhi, and Bangalore | Short term (≤ 2 years) |
| Source: Mordor Intelligence | |||
Mandatory UDI And Traceability Regulations in Medical Devices
The alignment of UDI rules across the U.S. FDA, the EU’s EUDAMED database, and China’s NMPA makes laser marking the default serialization method because adhesive labels detach during autoclave sterilization and inkjet codes blur under alcohol cleaning.[1]U.S. Food and Drug Administration, “UDI Basics,” FDA.gov Orthopedic-implant producers that missed the September 2024 FDA deadline faced shipment holds, so 68% switched from pad printing to fiber-laser annealing to achieve ISO 13485 permanence. UV sources are preferred for titanium and cobalt-chromium alloys because sub-400 nm wavelengths prevent micro-cracking. Enforcement is strictest in the United States, Germany, and China, where regulators now inspect read-rate logs during plant audits, driving mid-term retrofits as well as green-field installs.
Surge In EV Battery Production, Contact-less Marking Demand
Global cell output climbed to 1,200 GWh in 2025 after the EU Battery Regulation forced every pack above 2 kWh to carry a QR passport that survives thermal cycling. CATL installed 340 inline fiber-laser stations that cut cell-marking time to 1.8 s and removed USD 0.03 of consumables per unit. LG Energy Solution mirrored the move with a USD 180 million UV deployment in Michigan and Poland to achieve 50 µm square codes on 4680 cylindrical cells. Asia, which produces 76% of the world’s batteries, sees the most installations, yet new U.S. subsidy rules for domestic content pull demand westward.
Miniaturized Consumer Electronics Driving Micro-Marking in Asia
Foldable phones and multi-camera wearables leave only 2 mm² spaces for traceability. UV-355 nm lasers write sub-10 µm data-matrix codes on logic dies and MEMS without melting solder joints. Apple confirmed 92% of its top-tier Asian suppliers now employ laser micro-marking for RF modules.[2]Apple Inc., “Supplier Responsibility Report 2025,” Apple.com TSMC etched wafer IDs into its 3 nm platform to secure automotive customers demanding lot-level genealogy.[3]Coherent Corp., “Investor Presentation 2025,” Investors.coherent.com Growth is near-instant because consumer refresh cycles upgrade tooling every 18 months, making the short-term lift pronounced.
Sustainable Packaging Shift, Laser Coding Over Inkjet in Europe
The Single-Use Plastics Directive banned certain inks on PET and PP, triggering a migration to CO₂ lasers that engrave expiry data directly on packaging. Nestlé converted 18 bottling lines and avoided 240 t of ink per year with a 14-month payback. Domino Printing Sciences reported a 34% jump in CO₂-laser orders from European beverage producers. Adoption concentrates in Germany and France, where deposit-return fees reward fully recyclable, ink-free bottles. The medium-term growth aligns with facility expansions rather than emergency retrofits.
Restraints Impact Analysis*
| Restraint | (~) % Impact on CAGR Forecast | Geographic Relevance | Impact Timeline |
|---|---|---|---|
| High Capex (Above USD 150,000) for SMEs in Emerging Markets | -0.60% | Emerging markets in South America, Africa, and South-East Asia | Medium term (2-4 years) |
| Qualification Delay for Aerospace Composites (HAZ Concerns) | -0.40% | Global, with concentration in North America and EU aerospace hubs | Long term (≥ 4 years) |
| Skilled-Operator Shortage in South-American Factories | -0.30% | South America, particularly Brazil, Argentina, and Colombia | Medium term (2-4 years) |
| Margin Pressure from Low-Cost Chinese Fiber-Laser Suppliers | -0.20% | Global, with acute impact in price-sensitive Asia-Pacific and MEA markets | Short term (≤ 2 years) |
| Source: Mordor Intelligence | |||
High Capex for SMEs In Emerging Markets
Standalone fiber platforms with vision and fume extraction cost USD 150,000-280,000, overshooting the annual machinery budget for most Brazilian or Indonesian contract manufacturers. Banks in these regions demand 1.8:1 collateral and charge 14%+ interest, so 61% of surveyed firms cite financing as their prime barrier.[4]International Finance Corporation, “Manufacturing Finance Report 2025,” Ifc.org Only 12% of vendors offer operating leases, versus 48% in North America. Until used-equipment channels expand and local lenders accept soft collateral, emerging-market adoption will lag.
Qualification Delay for Aerospace Composites
Laser marking on CFRP can lower tensile strength by 8% within a 500 µm heat-affected zone, forcing FAA and EASA re-qualification that averages 22 months. Boeing highlighted the delay at its 2025 supplier summit, noting postponed nacelle programs. Even low-power UV methods still need X-ray CT to rule out delamination, so tier-two aerospace shops stick with inkjet for the foreseeable future, pulling long-term growth downward.
*Our forecasts treat driver/restraint impacts as directional, not additive. The impact forecasts reflect baseline growth, mix effects, and variable interactions.
Segment Analysis
By Laser Type: Fiber Dominance Meets UV Precision
Fiber units captured 48.27% of 2025 revenue, maintaining scale with 20-100 W power at 1,064 nm that engraves stainless housings at 1,000 mm/s. UV platforms, though smaller at present, are forecast to log a 5.27% CAGR, reflecting semiconductor fabs that now demand 355 nm “cold” pulses for wafer IDs. In 2025 IPG shipped 16% more fiber heads to automakers marking battery trays, yet Coherent posted a 28% sequential spike in UV sales to OLED makers in Taiwan and South Korea. Fiber’s robustness anchors automotive and heavy machinery, while UV steals share in electronics and medical implants. Dual wavelength heads that toggle between 1,064 nm and 355 nm are under prototype tests, signalling hybrid architectures beyond 2028.
The laser marking market size for fiber equipment remains the largest revenue block, but UV platforms account for the richest pipelines in quotations logged during 2026 trade shows. Suppliers who bundle machine-vision software with UV kits report win rates 12 points above fiber-only quotes. These trends indicate that while the laser marking market share of fiber units stays above 40% this decade, UV’s incremental share gains will concentrate in fabless packaging, sensor assemblies, and bio-compatible metals.


By Marking Process: Engraving Leads, Carbonization Surges
Engraving represented 31.41% of 2025 process volume because recessed shapes guarantee permanence on metals subject to abrasion. TRUMPF’s TruMark 6000 engraved 1,800 characters per minute on aluminum blocks for engine assembly. Carbonization, conversely, posts the fastest 5.63% CAGR as European brands adopt dark marks on PP and PE without removing material. CO₂ lasers operating near 10.6 µm break polymer bonds to create soot-rich contrast that recycling sensors recognize.
Food and beverage lines that replaced inkjet with carbonization achieved 95% uptime, proving favourable ROI despite higher capex. The laser marking market size tied to carbonization systems, while still modest, benefits from EU eco-label laws that penalize non-recyclable ink. Consequently, the laser marking market share for inkjet alternatives drops yearly, with carbonization forecast to displace foaming on light plastics by 2029.
By Offering: Hardware Anchors, Software Accelerates
Hardware captured 62.73% of sales in 2025, reflecting thousands of standalone benches and inline gantries installed in auto and electronics plants. Yet software outpaces all other categories at a 5.55% CAGR. OEMs require optical-character recognition and MES hooks that reject unreadable codes in real time. Novanta’s Y.0 suite embeds multi-layer data-matrix structures that shave 40% off cycle times.
As hardware commoditizes under Chinese pricing, subscription software delivers margin. Keyence records attach rates above 80% for verification modules, effectively turning hardware into a razor-handle gateway. Over the horizon, AI analytics will flag drift in focal alignment before failures occur, pushing the laser marking market toward outcome-based billing models.
By End-User Industry: Electronics Leads, Medical Devices Surge
Electronics and semiconductors held 28.95% of 2025 demand on the back of smartphone and wearable assembly. UV lasers etch glass covers, ceramic substrates, and flex PCBs in milliseconds without burning adhesives. Medical devices, though smaller today, register the steepest 4.91% CAGR because UDI audits put permanent coding on every implant. Stryker invested USD 42 million to retrofit hip-implant lines and trimmed post-market surveillance outlays by 23%.
Automotive and aerospace remain solid anchors, marking battery cans and composite fairings, yet their growth pace is steadier than healthcare. Jewelry gains momentum in India where Hallmark Unique Identification applies to 400,000 retailers, an example of policy pulling investments into micro-enterprise shops. Collectively, these shifts guide suppliers to tailor wavelength portfolios for each vertical rather than chasing a one-laser-fits-all strategy.
Geography Analysis
Asia-Pacific’s 39.54% share stems from China’s electronics assembly, Japan’s precision auto parts, and India’s hallmarking wave. Shenzhen fabs deploy UV lasers for radio-module codes, while CATL’s Ningde plant runs 340 fiber heads inline to comply with EU passport rules. Tokyo’s carmakers embed serials on aluminum arms, and Seoul’s OLED panel lines chase 3 µm spot sizes. India’s Bureau of Indian Standards subsidizes fiber benches for jewelers, compressing hallmark time from days to hours.
North America and Europe follow with heavy investments tied to medical UDI and sustainable packaging. U.S. orthopedic producers added fiber stations before the 2024 FDA deadline, and German beverage fillers swapped inkjet for CO₂ lasers to escape eco taxes. Automakers in Tennessee or Wolfsburg now link laser cells to MES dashboards that halt conveyors when a code mis-scans. Canada and Mexico win near-shoring battery packs, adding demand for gantry-mounted lasers that serialize housings ahead of potting.
The Middle East, though only mid-single-digit share, shows the fastest 4.99% CAGR. Saudi Arabia’s USD 20 billion cluster build-out mandates ISO 9001 traceability on every aerospace part, pulling orders for both fiber and UV platforms. UAE free zones attract contract electronics makers requiring EU-grade coding. South America lags because SMEs struggle with financing, yet tier-one Brazilian auto exporters adopt lasers to satisfy European clients. Africa remains nascent; South African mines mark valves and pipes but import duties and training gaps slow adoption. Therefore, Asia’s dominance persists, the Middle East accelerates, and Europe maintains regulated pull.

Competitive Landscape
Five leaders Coherent, IPG Photonics, TRUMPF, Han’s Laser, and Keyence controlled roughly 42% of 2025 revenue, none above 12%, signalling moderate concentration. Chinese brands pushed average selling prices down 18% in one-year, compelling Western peers to emphasize turnkey integration, cloud monitoring, and multi-year service packs. IPG lifted software and service to 22% of revenue, while TRUMPF’s TruConnect cloud dashboards predict lens wear before it derails throughput.
Tech priorities include UV miniaturization, multi-wavelength heads, and AI code verification. Keyence’s MD-X reaches 3 µm spots for wafer tracking, and Novanta trains deep-learning OCR on 10 million glyphs to cut false rejects below 0.3%. Coherent’s vertical stack after purchasing II-VI enables fixed-price outcomes with throughput guarantees a hedge against commodity optics erosion.
Disruptors offer software-first bundles that pair white-label lasers with analytics, selling “parts-per-code” rather than hardware. Videojet’s pay-per-mark at USD 0.02 appeals to Latin American suppliers lacking capex. M and A potential rises as automakers trim supplier lists for warranty simplicity, pushing smaller niche makers toward alliances or exits. Overall, pricing pressure coexists with service expansion, keeping rivalry intense yet profits attainable for innovators.
Laser Marking Industry Leaders
Coherent Corporation
IPG Photonics Corporation
TRUMPF Group
Mecco Partners LLC
Gravotech Group
- *Disclaimer: Major Players sorted in no particular order

Recent Industry Developments
- January 2025: IPG Photonics launched the LightWELD 2000 XR handheld laser welding system, delivering 2 kW output and quadrupling speed over TIG welding
- January 2025: TRUMPF and SCHMID announced a partnership to develop laser-etching on glass interposers for advanced chip packaging
- January 2025: Thorlabs completed the acquisition of Praevium Research, expanding tunable VCSEL capabilities for imaging applications
- January 2025: Coherent introduced the FACTOR Series of fiber-coupled diode pumps with power up to 220 W for industrial and medical OEMs


Global Laser Marking Market Report Scope
The Laser Marking Market Report is Segmented by Laser Type (Fiber, CO2, Solid-State, UV, Green, Others), Marking Process (Annealing, Etching, Engraving, Foaming, Carbonization), Offering (Hardware, Software, Services), End-User Industry (Automotive and Aerospace, Electronics and Semiconductors, Medical Devices and Healthcare, Food and Beverage Packaging, Industrial Machinery, Jewelry, Rest), and Geography (North America, Europe, South America, Asia-Pacific, Middle East, Africa). Market Forecasts are Provided in Terms of Value (USD).
| Fiber Laser |
| CO2 Laser |
| Solid-State (Nd:YAG, Nd:YVO4) |
| UV Laser |
| Green Laser |
| Others (Diode, YB:YAG, Hybrid) |
| Annealing |
| Etching |
| Engraving |
| Foaming |
| Carbonisation |
| Hardware | Stand-Alone Systems |
| Integrated/In-line Systems | |
| Software | |
| Services |
| Automotive and Aerospace |
| Electronics and Semiconductors |
| Medical Devices and Healthcare |
| Food and Beverage Packaging |
| Industrial Machinery and Machine Tools |
| Jewellery and Luxury Goods |
| Other Industries (Oil and Gas, Defence, etc.) |
| North America | United States | |
| Canada | ||
| Mexico | ||
| Europe | Germany | |
| United Kingdom | ||
| France | ||
| Nordics | ||
| Rest of Europe | ||
| South America | Brazil | |
| Rest of South America | ||
| Asia-Pacific | China | |
| Japan | ||
| India | ||
| South-East Asia | ||
| Rest of Asia-Pacific | ||
| Middle East and Africa | Middle East | Gulf Cooperation Council Countries |
| Turkey | ||
| Rest of Middle East | ||
| Africa | South Africa | |
| Rest of Africa | ||
| By Laser Type | Fiber Laser | ||
| CO2 Laser | |||
| Solid-State (Nd:YAG, Nd:YVO4) | |||
| UV Laser | |||
| Green Laser | |||
| Others (Diode, YB:YAG, Hybrid) | |||
| By Marking Process | Annealing | ||
| Etching | |||
| Engraving | |||
| Foaming | |||
| Carbonisation | |||
| By Offering | Hardware | Stand-Alone Systems | |
| Integrated/In-line Systems | |||
| Software | |||
| Services | |||
| By End-User Industry | Automotive and Aerospace | ||
| Electronics and Semiconductors | |||
| Medical Devices and Healthcare | |||
| Food and Beverage Packaging | |||
| Industrial Machinery and Machine Tools | |||
| Jewellery and Luxury Goods | |||
| Other Industries (Oil and Gas, Defence, etc.) | |||
| By Geography | North America | United States | |
| Canada | |||
| Mexico | |||
| Europe | Germany | ||
| United Kingdom | |||
| France | |||
| Nordics | |||
| Rest of Europe | |||
| South America | Brazil | ||
| Rest of South America | |||
| Asia-Pacific | China | ||
| Japan | |||
| India | |||
| South-East Asia | |||
| Rest of Asia-Pacific | |||
| Middle East and Africa | Middle East | Gulf Cooperation Council Countries | |
| Turkey | |||
| Rest of Middle East | |||
| Africa | South Africa | ||
| Rest of Africa | |||


Key Questions Answered in the Report
How large will global demand for laser marking be by 2031?
The laser marking market is projected to reach USD 3.11 billion in 2031, expanding at a 14.07% CAGR from 2026.
Which laser type is growing fastest?
UV platforms are the quickest, forecast to post a 14.27% CAGR through 2031 as semiconductor and medical-device producers seek sub-10 µm codes.
What hinders wider adoption in South America?
High capital costs above USD 150,000 and scarce leasing options prevent many small and mid-size manufacturers from financing laser systems.
Why are automakers replacing labels with lasers on batteries?
Adhesive tags detach during thermal cycling, whereas fiber-laser QR codes survive heat and enable EU digital passports, cutting consumable costs.
Which region offers the strongest growth outlook?
The Middle East leads with a 14.99% CAGR as Saudi and UAE industrial clusters specify ISO 9001 serial-number compliance on every component.
How are suppliers defending margins amid price erosion?
Leading vendors bundle cloud software, AI verification, and service contracts, shifting revenue from low-margin hardware to recurring, outcome-based fees.
Page last updated on:


