Laser Scanner Market Size and Share
Market Overview
| Study Period | 2020 - 2031 |
|---|---|
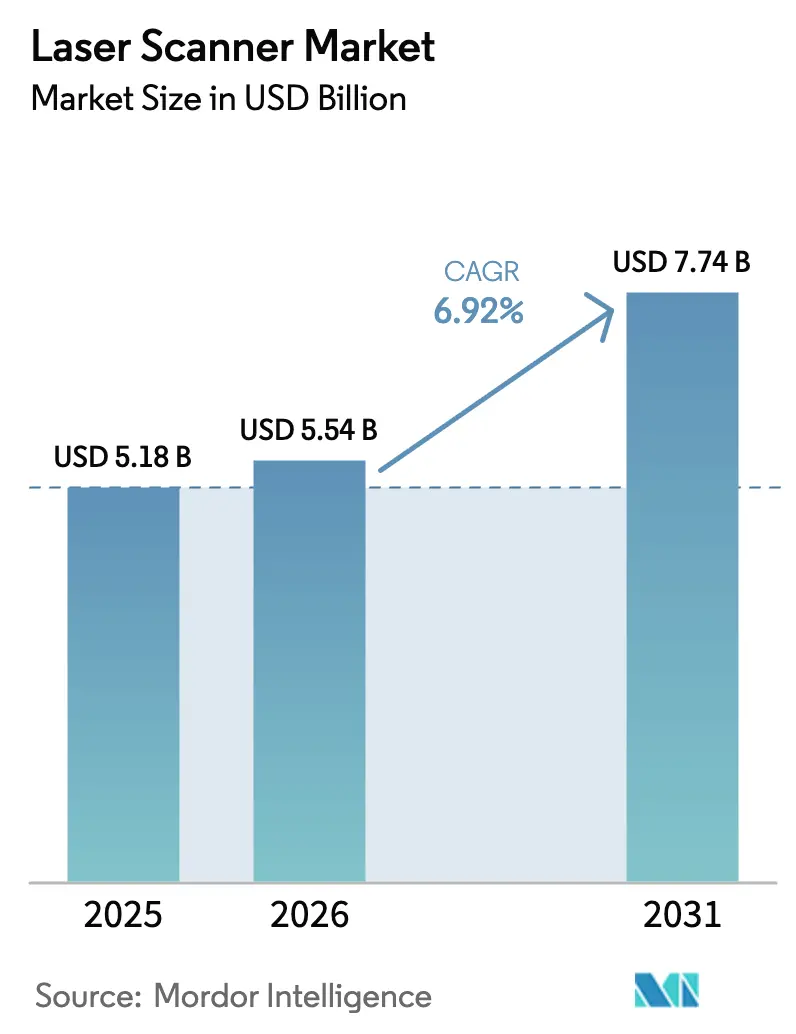
| Market Size (2026) | USD 5.54 Billion |
| Market Size (2031) | USD 7.74 Billion |
| Growth Rate (2026 - 2031) | 6.92% CAGR |
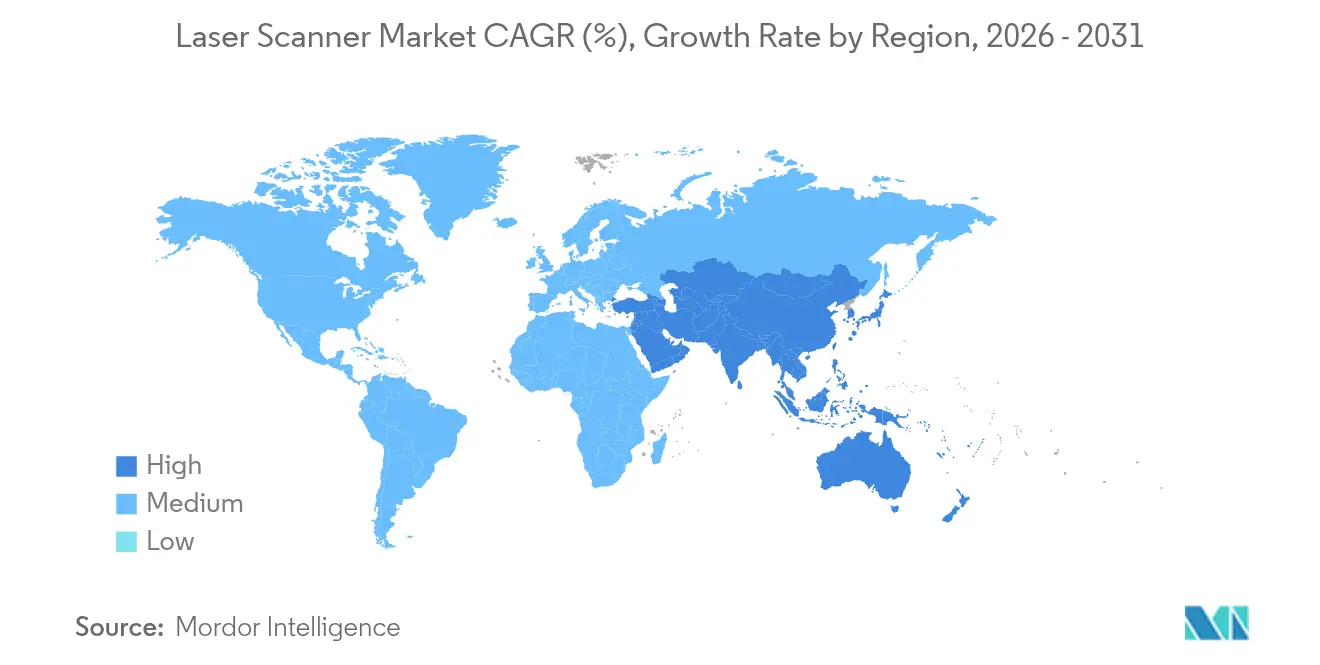
| Fastest Growing Market | Asia Pacific |
| Largest Market | Asia Pacific |
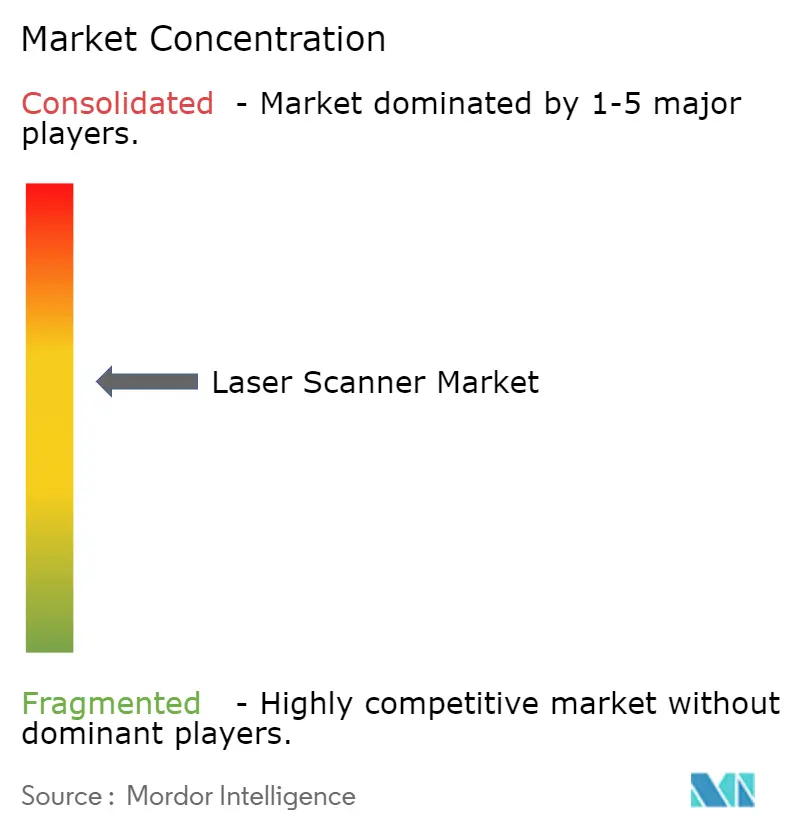
| Market Concentration | Medium |
Major Players
*Disclaimer: Major Players sorted in no particular order Image © Mordor Intelligence. Reuse requires attribution under CC BY 4.0. |
|
Laser Scanner Market Analysis by Mordor Intelligence
The laser scanner market size is expected to grow from USD 5.18 billion in 2025 to USD 5.54 billion in 2026 and is forecast to reach USD 7.74 billion by 2031 at 6.92% CAGR over 2026-2031. Strong adoption in geospatial digital twin retrofits, autonomous mobile robotics, and tightening BIM regulations continues to widen end-user use cases. Solid-state LiDAR breakthroughs are removing moving parts, opening doors in consumer electronics and heritage preservation, while offshore wind operators in the North Sea create a durable niche for long-range systems. Across Asia-Pacific, e-commerce fulfilment and ADAS integration drive volume growth, whereas European process industries deploy scanners for asset-centric sustainability programs. Competitive focus is shifting from hardware to integrated SaaS offerings that simplify data workflows and shorten payback cycles.
Key Report Takeaways
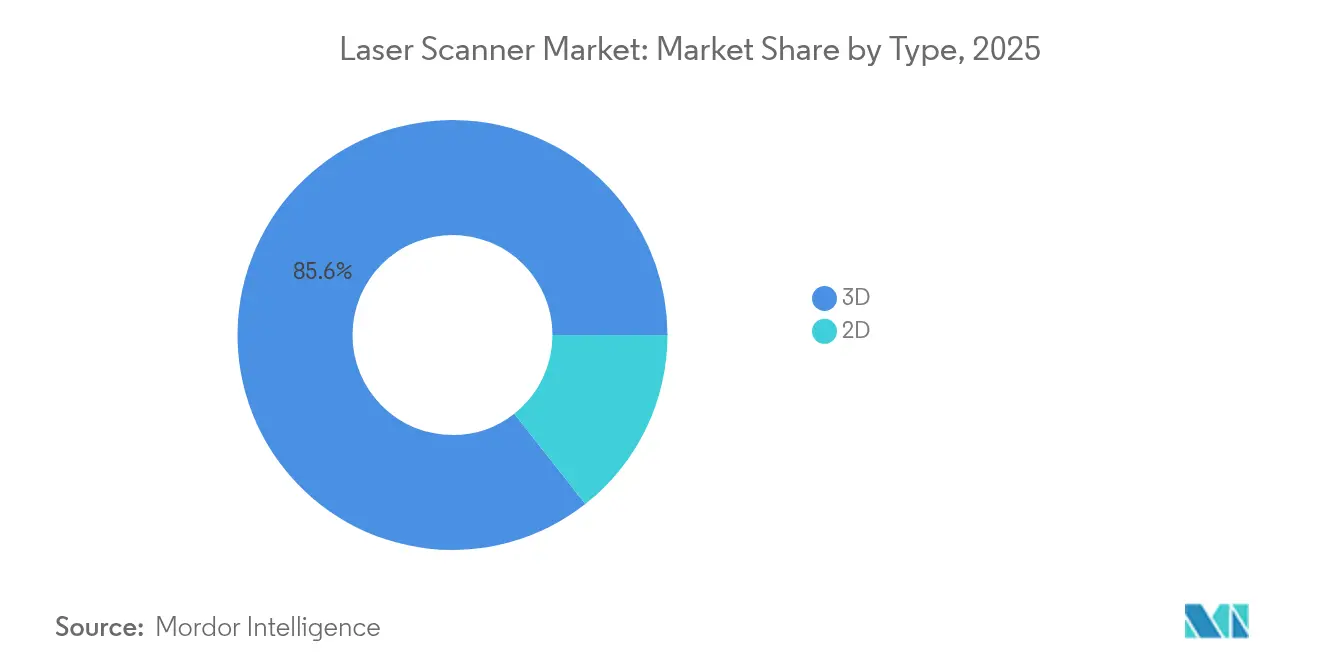
- By type, 3D scanners held 85.60% of laser scanner market share in 2025; 2D scanners are poised for the slowest growth through 2031.
- By range, mid-range models accounted for 45.20% share of the laser scanner market size in 2025, while short-range systems are projected to expand at an 8.05% CAGR to 2031.
- By technology, Time-of-Flight platforms controlled 51.30% revenue share in 2025; Structured-Light units are registering the fastest 7.75% CAGR.
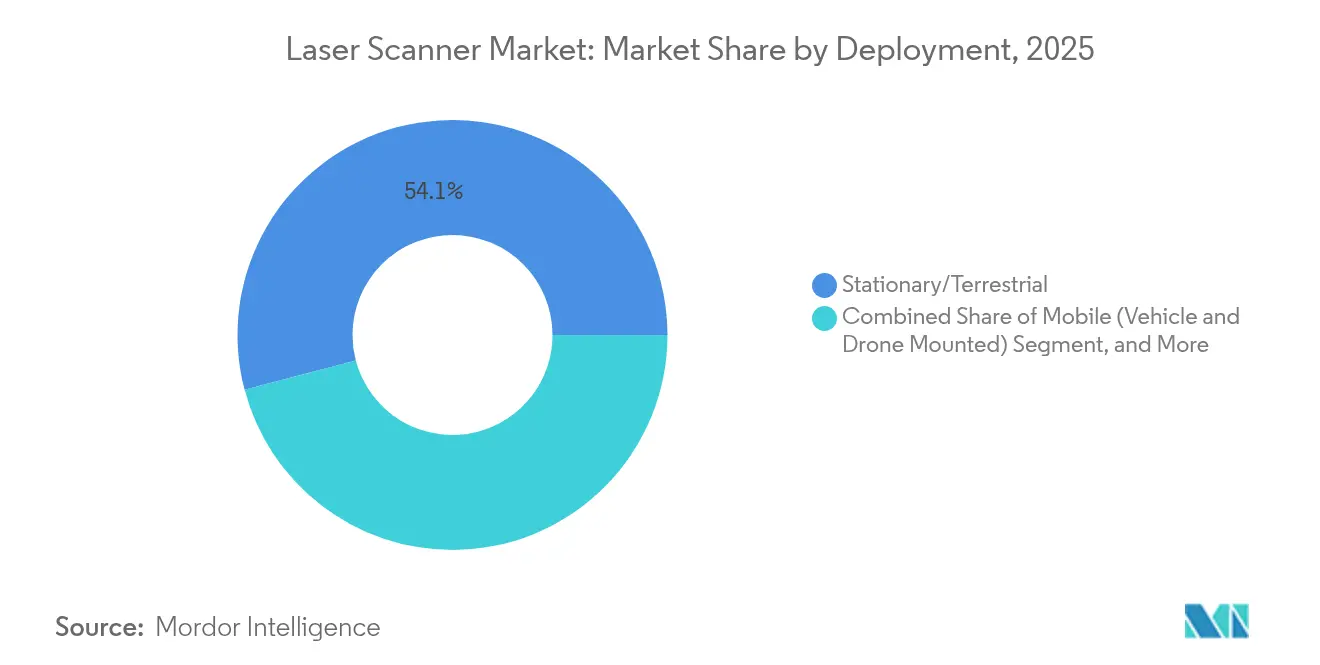
- By deployment, stationary/terrestrial scanners dominated with 54.10% of 2025 revenue, whereas hand-held form factors record an 7.85% CAGR outlook.
- By vertical, building, construction and BIM commanded 31.40% of the laser scanner market in 2025; cultural heritage and archaeology is advancing at a 8.55% CAGR through 2031.
- By geography, Asia-Pacific led with 33.10% regional laser scanner market share in 2025; the region is also the fastest-growing at an 7.95% CAGR to 2031.
Note: Market size and forecast figures in this report are generated using Mordor Intelligence’s proprietary estimation framework, updated with the latest available data and insights as of 2026.
Global Laser Scanner Market Trends and Insights
Drivers Impact Analysis*
| Driver | (~) % Impact on CAGR Forecast | Geographic Relevance | Impact Timeline |
|---|---|---|---|
| Expansion of geospatial digital-twin retrofit programmes in European process industries | +1.2% | Europe, spill-over to North America | Medium term (2-4 years) |
| Rapid adoption of LiDAR-equipped autonomous mobile robots in Asian e-commerce fulfilment centres | +1.8% | Asia-Pacific core, expanding globally | Short term (≤ 2 years) |
| Mandatory BIM compliance for North-American public infrastructure projects | +1.5% | North America & EU | Medium term (2-4 years) |
| Cultural-heritage digitisation grants accelerating Middle-East terrestrial scanner demand | +0.9% | Middle East, global heritage sites | Long term (≥ 4 years) |
| Integration of compact solid-state LiDAR in Japanese and Korean ADAS platforms | +1.1% | Asia-Pacific, global automotive | Short term (≤ 2 years) |
| Offshore wind farm digital-twin maintenance driving North-Sea long-range scanner shipments | +0.8% | Europe, global offshore | Long term (≥ 4 years) |
| Source: Mordor Intelligence | |||
Expansion of Geospatial Digital-Twin Retrofit Programmes in European Process Industries
European process operators are digitising plants to curb emissions and extend asset life cycles, triggering higher demand for sub-millimetre scanners that feed AI-enabled twins. The EU Destination Earth initiative underpins public funding for high-density geospatial capture, and projects such as France’s bridge inspection and Germany’s KaSyTwin sewer platform showcase tangible operational gains.[1]Frontiers in Research Metrics and Analytics, “Digital twins in sustainable transition,” frontiersin.org Suppliers able to pair hardware with analytics stand to win recurring software revenue as buyers prioritise end-to-end solutions.
Rapid Adoption of LiDAR-Equipped Autonomous Mobile Robots in Asian E-commerce Fulfilment Centres
Chinese and Southeast Asian warehouses face labour shortages and rising order complexity, leading operators to deploy LiDAR-guided robots for navigation and smart sorting. Amazon’s Dortmund rollout of six-sided scanning units illustrates productivity benefits, while analysts project the robot installed base to surpass 1.3 billion units by 2035.[2]Amazon Staff, “Amazon unveils 7 new robots at innovative delivery station,” aboutamazon.com Short-range, low-cost sensors integrated with edge AI are therefore gaining share within the laser scanner market.
Mandatory BIM Compliance for North-American Public Infrastructure Projects
Federal and state bodies now require BIM outputs on new civil works, embedding 3D scanning in project scopes from bid to maintenance. The GSA’s 3D-4D-BIM program and MDOT’s digital delivery roadmap establish workflows where point-cloud capture is a non-negotiable input.[3]General Services Administration, “3D-4D Building Information Modeling,” gsa.gov Scanner vendors that align data formats with NBIMS-US V4 standards accelerate procurement cycles and reduce contractor friction.
Cultural-Heritage Digitisation Grants Accelerating Middle-East Terrestrial Scanner Demand
UNESCO-supported programmes in Iraq and neighbouring states fund high-resolution surveys of temples, mosques, and archaeological digs. Terrestrial laser scans preserve artefacts amid environmental and geopolitical risks, creating a specialised niche for portable, field-rugged systems. Suppliers offering bundled training and photogrammetry software further differentiate in this skills-constrained segment.
Restraints Impact Analysis*
| Restraint | (~) % Impact on CAGR Forecast | Geographic Relevance | Impact Timeline |
|---|---|---|---|
| High cap-ex for sub-millimetre accuracy scanners limiting South-American SME uptake | -0.8% | South America, developing markets | Medium term (2-4 years) |
| Shortage of scan-to-BIM technicians slowing African construction ROI | -0.6% | Africa, other emerging markets | Long term (≥ 4 years) |
| Proprietary scan-data formats hindering inter-platform interoperability in government mapping | -0.4% | Global, government sectors | Short term (≤ 2 years) |
| Import duties and Class-3B certification delays curtailing Indian market entry | -0.7% | India, similar APAC markets | Medium term (2-4 years) |
| Source: Mordor Intelligence | |||
High Cap-Ex for Sub-Millimetre Accuracy Scanners Limiting South-American SME Uptake
Brazilian SMEs, which provide 50% of national value added yet invest sparingly in R&D, find premium scanners unaffordable without public incentives.[4]General Services Administration, “3D-4D Building Information Modeling,” gsa.gov The result is delayed adoption in construction and manufacturing, keeping the regional laser scanner market below potential.
Shortage of Scan-to-BIM Technicians Slowing African Construction ROI
In South Africa, labour constraints and imported material costs hamper digital workflows, despite 58% of builders prioritising transformation. Without skilled staff to convert point clouds into BIM, owners under-utilise scanners and postpone repeat purchases.
*Our forecasts treat driver/restraint impacts as directional, not additive. The impact forecasts reflect baseline growth, mix effects, and variable interactions.
Segment Analysis
By Type: 3D Dominance Drives Innovation
3D units captured 85.60% revenue in 2025, making them the backbone of the laser scanner market. Their 6.95% CAGR outlook reflects the migration toward digital twins and autonomous navigation. 2D devices remain relevant for focused QC tasks, yet they face pricing pressure as 3D costs fall.
Solid-state beam steering, pioneered by Lumotive and Hokuyo in 2024, eliminates rotating mirrors, shrinking form factors and power draw. This breakthrough aligns with the laser scanner industry quest for robust, maintenance-free sensors.


By Range: Mid-Range Leadership Faces Short-Range Disruption
Mid-range (50-200 m) products held 45.20% share of the laser scanner market size in 2025 due to construction and asset-inspection demand. Still, short-range (< 50 m) models post an 8.05% CAGR as robots, drones, and hand tools proliferate.
Short-range innovation focuses on compact ASICs and AI edge processing, meeting real-time mapping needs in logistics aisles and factory cells. Long-range scanners stay vital for offshore wind and mining but remain a volume niche.
By Technology: Time-of-Flight Stability Versus Structured-Light Innovation
Time-of-Flight retains majority share at 51.30%, valued for accuracy in aerospace and automotive safety functions. In parallel, Structured-Light accelerates at 7.75% CAGR, lifted by consumer-electronics economies of scale and faster data acquisition.
Patent filings from Meta and Snap underscore ongoing R&D to improve projector efficiency and thermal stability, keeping competitive pressure high.
By Deployment: Stationary Systems Anchor Market Growth
Stationary scanners generated 54.10% of 2025 revenue thanks to infrastructure documentation mandates. Hand-held units deliver the sharpest 7.85% CAGR as inspectors demand mobility inside refineries and on production floors. Mobile vehicle or drone platforms serve corridors and powerlines where GPS-aided navigation is critical.
FARO’s Leap ST, launched January 2025, bundles five modes, confirming user appetite for multi-purpose portable systems.
By Vertical: Construction Leadership Meets Heritage Innovation
Construction and BIM applications comprise 31.40% of current sales and will remain the revenue anchor as governments tighten model-based delivery rules. Heritage preservation, aided by Middle-East grants, records the fastest 8.55% CAGR, leveraging sub-millimetre scanning to protect historical artefacts.
Industrial manufacturing, automotive, aerospace, and defence each maintain steady demand for metrology and alignment tasks, underpinning baseline volumes across the laser scanner market.
Geography Analysis
Asia-Pacific leads with 33.10% of 2025 revenue and the highest 7.95% CAGR to 2031. Fulfilment-centre robotics and ADAS LiDAR supply chains in Japan and Korea fuel recurring orders, while China’s smart-factory stimulus keeps domestic volumes buoyant. Import licensing in India slows broader APAC growth, yet regulatory reforms may unlock latent potential.
North America benefits from BIM mandates and a large aerospace inventory that requires high-precision metrology. Established vendors maintain local manufacturing to secure defence approvals, though replacement cycles lengthen as systems move from hardware to software upgrades.
Europe harnesses digital twins for sustainability targets and services its expanding offshore wind fleet. Programmes such as Destination Earth and KaSyTwin signal public backing, and cultural institutions capitalise on EU heritage funds for site digitisation. Collectively, the region shifts emphasis from equipment counts to data-analytics value.

Competitive Landscape
The laser scanner market is moderately fragmented. Hexagon, Trimble, and FARO deploy 10–12% of revenue to R&D, enabling steady product refreshes and expanding SaaS modules that automate point-cloud workflows. Trimble’s software mix reached 75% in Q1 2025, highlighting the pivot toward recurrent income.
Strategic acquisitions accelerate. Hexagon bought 3D Systems’ Geomagic suite for USD 123 million; Viavi acquired Inertial Labs for up to USD 325 million; and Kraken Robotics purchased 3D at Depth to broaden subsea LiDAR. These moves consolidate IP, embed analytics, and increase cross-selling leverage.
Start-ups such as Lumotive, Microvision, and Lincoln Laser target solid-state or MEMS architectures to undercut mechanical units on cost and durability. Meanwhile, Topcon’s May 2025 alliance with FARO illustrates cross-brand cooperation to bundle hardware and cloud platforms. The resulting landscape rewards vendors that fuse measurement, analytics, and open data schemas.
Laser Scanner Industry Leaders
-
Carl Zeiss Optotechnick GmbH
-
Hexagon AB
-
Creaform
-
Topcon Corporation
-
RIEGL Laser Measurement Systems GmbH
- *Disclaimer: Major Players sorted in no particular order

Recent Industry Developments
- May 2025: Topcon Corporation and FARO Technologies formed a strategic agreement to co-develop laser scanning solutions that marry Topcon optics with FARO software.
- March 2025: Hexagon AB confirmed plans to spin off its Asset Lifecycle Intelligence division into a USD 1.448 billion revenue software company targeting a 2026 U.S. listing.
- March 2025: Kraken Robotics acquired 3D at Depth to enhance its SeaVision LiDAR and deepen U.S. footprint.
- February 2025: GSI Group bought Lincoln Laser Company for USD 11 million to add ultrafast polygon scanners to its Cambridge Technology portfolio.
- January 2025: FARO released the Leap ST hand-held scanner featuring five operating modes for manufacturing metrology.


Global Laser Scanner Market Report Scope
Laser scanners, which are non-contact devices, use laser infrared technology to capture millions of discrete data points. This technology enables precise measurements of objects or spaces, producing detailed 3D images within minutes. These images consist of millions of 3D data points, known as a point cloud.
The study tracks the revenue accrued through the sale of the laser scanner solutions by various players across the globe. The study also tracks the key market parameters, underlying growth influencers, and major vendors operating in the industry, which supports the market estimations and growth rates over the forecast period. The study further analyses the overall impact of COVID-19 aftereffects and other macroeconomic factors on the market. The report’s scope encompasses market sizing and forecasts for the various market segments.
The laser scanner market is segmented by type (2D, and 3D), vertical (automotive, food, beverages and consumer goods, healthcare and pharmaceutical, government and defense, building and construction, and others), and geography (North America, Europe, Asia Pacific, Middle East & Africa, and Latin America). The market sizes and forecasts regarding value (USD) for all the above segments are provided.
| 2D |
| 3D |
| Short-Range (Less than 50 m) |
| Mid-Range (50-200 m) |
| Long-Range (Above 200 m) |
| Time-of-Flight (ToF) |
| Phase-Shift |
| Triangulation |
| Structured-Light |
| Stationary/Terrestrial |
| Mobile (Vehicle and Drone Mounted) |
| Hand-Held |
| Automotive and Transportation |
| Aerospace and Defence |
| Building, Construction and BIM |
| Industrial Manufacturing and Automation |
| Oil, Gas and Mining |
| Healthcare and Life-Sciences |
| Cultural Heritage and Archaeology |
| Government, Survey and Mapping |
| North America | United States | |
| Canada | ||
| Mexico | ||
| Europe | Germany | |
| United Kingdom | ||
| France | ||
| Nordics | ||
| Rest of Europe | ||
| South America | Brazil | |
| Rest of South America | ||
| Asia-Pacific | China | |
| Japan | ||
| India | ||
| South-East Asia | ||
| Rest of Asia-Pacific | ||
| Middle East and Africa | Middle East | Gulf Cooperation Council Countries |
| Turkey | ||
| Rest of Middle East | ||
| Africa | South Africa | |
| Rest of Africa | ||
| By Type | 2D | ||
| 3D | |||
| By Range | Short-Range (Less than 50 m) | ||
| Mid-Range (50-200 m) | |||
| Long-Range (Above 200 m) | |||
| By Technology | Time-of-Flight (ToF) | ||
| Phase-Shift | |||
| Triangulation | |||
| Structured-Light | |||
| By Deployment | Stationary/Terrestrial | ||
| Mobile (Vehicle and Drone Mounted) | |||
| Hand-Held | |||
| By Vertical | Automotive and Transportation | ||
| Aerospace and Defence | |||
| Building, Construction and BIM | |||
| Industrial Manufacturing and Automation | |||
| Oil, Gas and Mining | |||
| Healthcare and Life-Sciences | |||
| Cultural Heritage and Archaeology | |||
| Government, Survey and Mapping | |||
| By Geography | North America | United States | |
| Canada | |||
| Mexico | |||
| Europe | Germany | ||
| United Kingdom | |||
| France | |||
| Nordics | |||
| Rest of Europe | |||
| South America | Brazil | ||
| Rest of South America | |||
| Asia-Pacific | China | ||
| Japan | |||
| India | |||
| South-East Asia | |||
| Rest of Asia-Pacific | |||
| Middle East and Africa | Middle East | Gulf Cooperation Council Countries | |
| Turkey | |||
| Rest of Middle East | |||
| Africa | South Africa | ||
| Rest of Africa | |||


Key Questions Answered in the Report
What is the current value of the laser scanner market?
The laser scanner market is valued at USD 5.54 billion in 2026
How fast is the laser scanner market growing?
It is projected to expand at a 6.92% CAGR, reaching USD 7.74 billion by 2031.
Which region leads the laser scanner market today?
Asia-Pacific holds 33.10% of global revenue and posts the fastest 7.95% CAGR.
Which application vertical is expanding the fastest?
Cultural heritage and archaeology records the highest 8.55% CAGR through 2031.
What technology dominates laser scanning?
Time-of-Flight systems retain 51.30% market share, valued for proven accuracy.
How are vendors differentiating in the laser scanner industry?
Leaders invest 10-12% of sales in R&D and bundle hardware with SaaS platforms to streamline point-cloud workflows.
Page last updated on:


