Test Benches Market Size and Share
Market Overview
| Study Period | 2019 - 2030 |
|---|---|
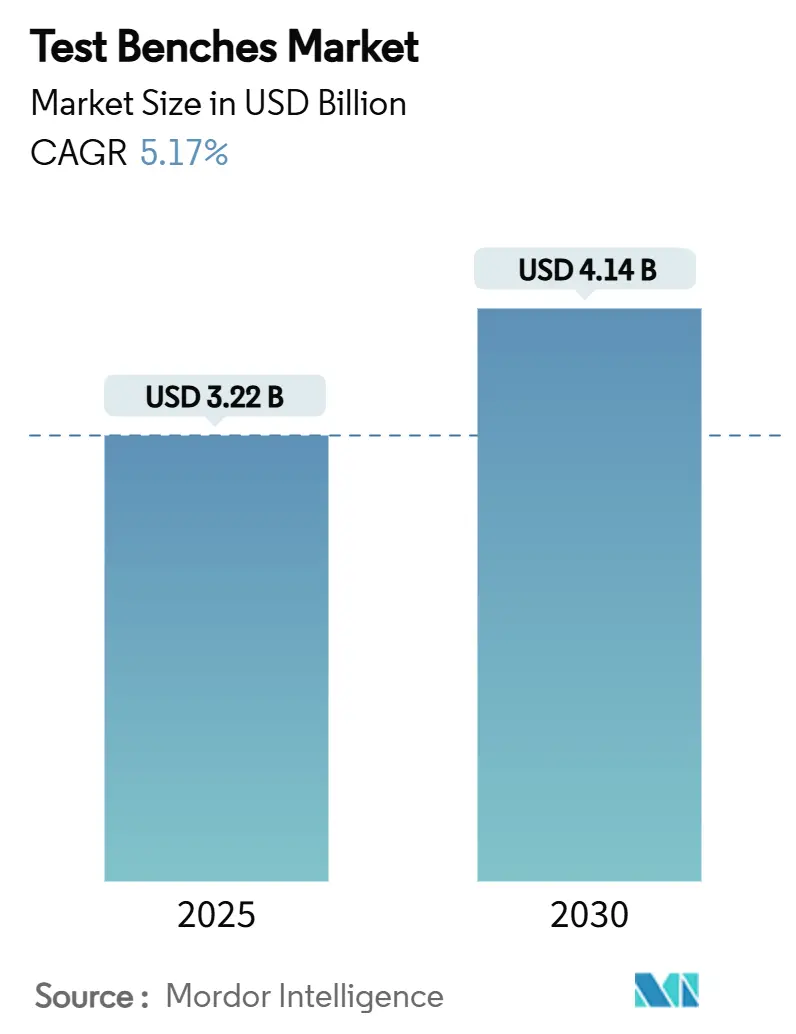
| Market Size (2025) | USD 3.22 Billion |
| Market Size (2030) | USD 4.14 Billion |
| Growth Rate (2025 - 2030) | 5.17% CAGR |
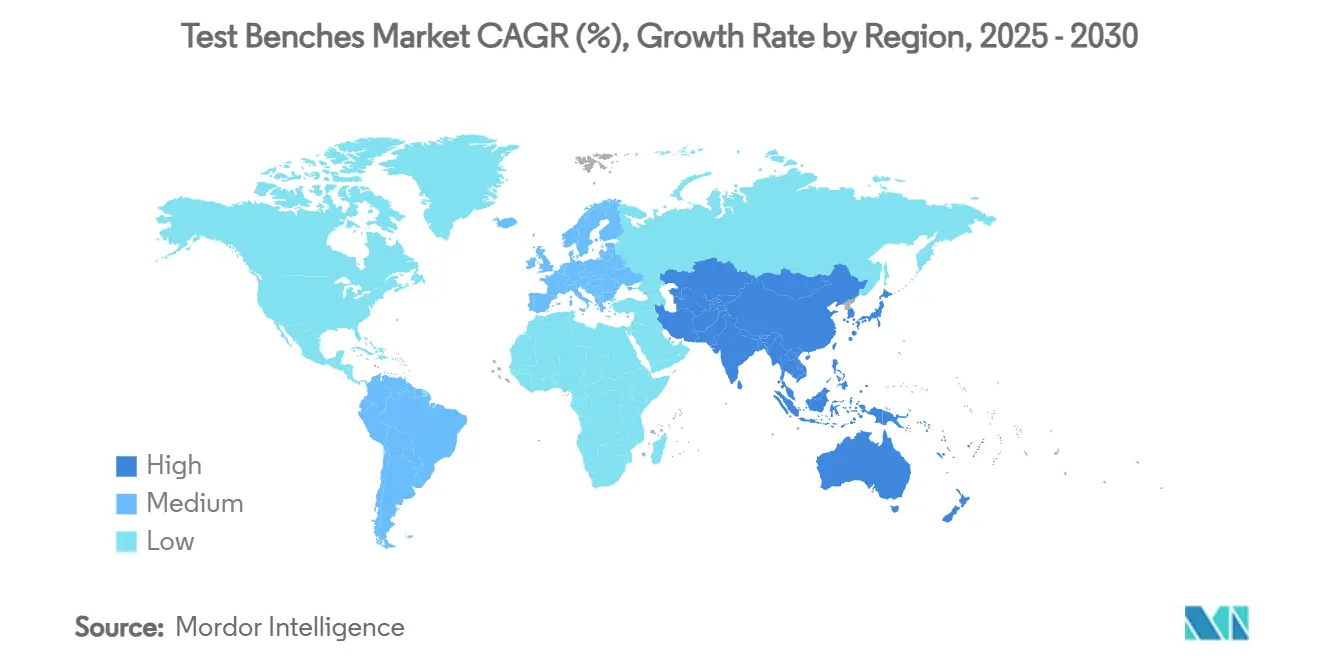
| Fastest Growing Market | Asia Pacific |
| Largest Market | Asia Pacific |
| Market Concentration | Medium |
Major Players *Disclaimer: Major Players sorted in no particular order Image © Mordor Intelligence. Reuse requires attribution under CC BY 4.0. | |
Test Benches Market Analysis by Mordor Intelligence
The global test benches market size reached USD 3.22 billion in 2025 and is forecast to attain USD 4.14 billion by 2030, reflecting a 5.17% CAGR through the period. Demand pivots around electrification mandates, autonomous mobility programs, and renewable-centric power electronics, all of which require high-voltage, software-defined validation environments that older mechanical rigs cannot deliver. Automotive applications remain the single largest revenue pool, yet power generation and energy storage benches are scaling faster as lithium-ion, sodium-ion and solid-state chemistries move from pilot lines to gigafactories. Hardware continues to anchor just over half of spending, but simulation software and digital-twin orchestration record the steepest growth trajectories, reshaping procurement criteria toward integrated measurement-and-modeling platforms.[1]dSPACE GmbH, “Battery Management Systems: High-Precision Validation,” dspace.com Asia-Pacific leads both installed base and expansion rate, aided by China’s electric-vehicle output and India’s expanding electronics landscape. Labor inflation, regulatory cyber-security audits, and component shortages simultaneously drive automated, software-rich solutions and redesigns of instrumentation architectures around available semiconductors.
Key Report Takeaways
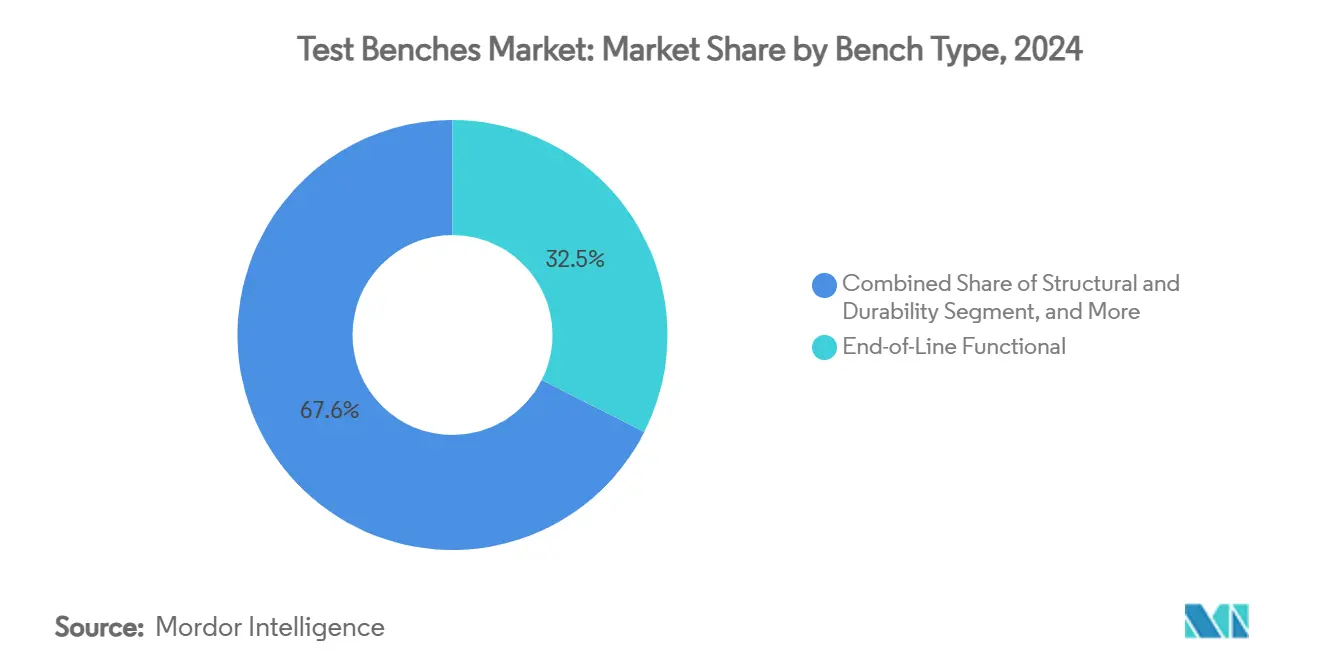
- By bench type, end-of-line functional rigs held a 32.45% share of the test benches market in 2024, while battery and inverter benches are projected to grow at 7.03% CAGR through 2030.
- By component, hardware retained 51.35% of the test benches market share in 2024; software is advancing at 8.25% CAGR through 2030.
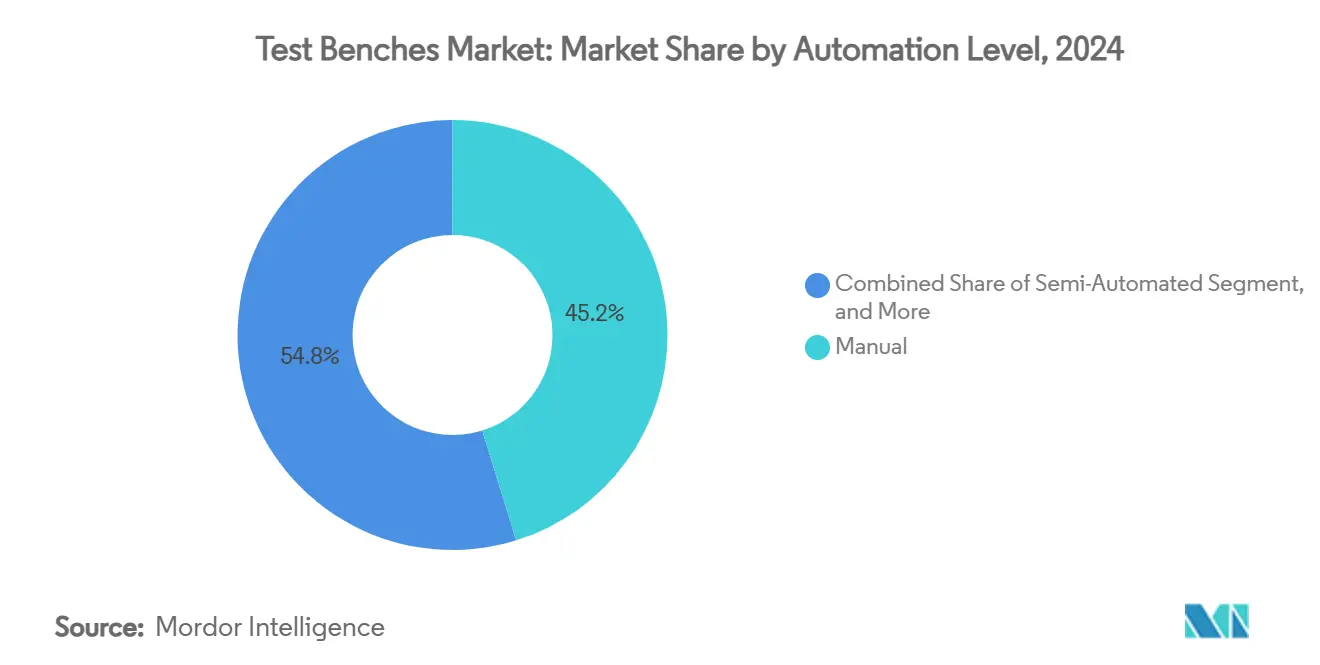
- By automation level, manual systems accounted for 45.21% of 2024 revenue, whereas fully automated solutions are forecast to expand at 10.53% CAGR to 2030.
- By application industry, automotive captured 38.91% of 2024 spending; power generation and energy storage are poised for the fastest 9.31% CAGR through 2030.
- By geography, Asia-Pacific commanded 37.81% of 2024 value and is set to grow at 9.25% CAGR, the quickest regional pace to 2030.
Global Test Benches Market Trends and Insights
Drivers Impact Analysis*
| Driver | (~) % Impact on CAGR Forecast | Geographic Relevance | Impact Timeline |
|---|---|---|---|
| EV-led demand for end-of-line powertrain test benches | +1.8% | Global, with concentration in China, EU, North America | Medium term (2-4 years) |
| ADAS and autonomous validation pushing hardware-in-the-loop (HiL) rigs | +1.2% | North America & EU, expanding to APAC | Long term (≥ 4 years) |
| Stricter UNECE R155/R156 cyber-security compliance testing | +0.9% | EU leading, North America following, APAC adoption by 2027 | Short term (≤ 2 years) |
| Rise of renewable-centric grid-tied inverter test benches | +0.7% | Global, with early gains in Germany, California, Australia | Medium term (2-4 years) |
| Subscription-based "Test-as-a-Service" labs reducing CAPEX | +0.4% | North America & EU core, spill-over to APAC | Short term (≤ 2 years) |
| Under-the-hood digital twin correlation requirements | +0.3% | Global, led by aerospace and automotive sectors | Long term (≥ 4 years) |
| Source: Mordor Intelligence | |||
EV-Led Demand for End-of-Line Powertrain Test Benches
Soaring electric-vehicle output forces OEMs to substitute combustion dynamometers with high-voltage battery, inverter, and e-motor rigs. Tesla’s teardown analysis of the Model 3 underscored energy-density and thermal-runaway factors that simply cannot be captured on legacy driveline setups.[2]Nico Rosenberger et al., “Comprehensive Analysis of the Tesla Model 3,” mdpi.com CATL’s 6C fast-charge cell program in 2024 magnified volatility in temperature, impedance, and balancing, making integrated hardware-in-the-loop (HiL) benches indispensable for regulatory homologation. The migration from 12 V to 800 V architectures further increases insulation stress tests and partial-discharge monitoring requirements. Cost competitiveness is tangible: Hillcrest showed that optimized SiC traction inverters can cut vehicle bill-of-materials by USD 2,200 each, a saving validated only through precision bench analytics. Investments concentrate in China, Europe, and North America where both capacity and regulation converge.
ADAS and Autonomous Validation Pushing Hardware-in-the-Loop (HiL) Rigs
Advanced driver-assistance and Level 4+ autonomy rely on sensor fusion and over-the-air code drops that necessitate millions of scenario iterations without real-road exposure. Rohde & Schwarz and Vector adapted radar benches that inject synthetic obstacles into HiL loops, enabling dynamic angle-of-arrival error mapping under fog, rain, and glare.[3]Rohde & Schwarz, “Hardware-in-the-Loop Validation of Automotive Radar Sensors,” embeddedcomputing.com Aptiv migrated bench orchestration to the cloud, turning regional labs into one logical asset pool capable of overnight regression cycles. National Instruments’ workflow now links data logs, plant models, and HiL execution within a single dashboard, shortening validation sprints for autonomous stack updates. North America and Europe hold the knowledge center today, yet Chinese and Korean OEMs are ramping internal HiL labs as domestic ADAS stacks mature.
Stricter UNECE R155/R156 Cyber-Security Compliance Testing
From July 2024, newly type-approved vehicles sold in the EU must demonstrate cyber-security management systems under UNECE R155; the production phase audit follows under R156. Benches therefore expand beyond CAN or LIN functional tests to penetration drills, secure-boot verification, and cryptographic side-channel analysis. Trustonic’s trusted execution environment solutions are already part of tier-1 module certification, obliging validation labs to incorporate power-glitch and fault-injection hardware. Keysight’s 2025 embedded security testbench reached a 10× throughput gain in differential-power analysis thanks to tightly coupled analog front ends. While the EU sets the pace, North American OEMs adopt parallel frameworks to avoid export bottlenecks, with Japanese and Korean producers aligning by 2027.
Rise of Renewable-Centric Grid-Tied Inverter Test Benches
Inverters at residential, commercial, and utility scales must pass grid-code protocols on ride-through, harmonic emission, and voltage-frequency tolerance. Sandia National Labs published field-weighted duty cycles that scripted new bench algorithms for anti-islanding and rapid-shutdown testing. EPC Power Corporation described certification delays when benches lacked programmable PV simulators capable of 2 ms irradiance steps, prompting vendors to embed multi-quadrant DC sources. AMETEK shipped 810 kVA grid simulators to replicate low-voltage ride-through events for large-scale solar farms. Germany, California, and Australia-each chasing 50% or higher renewable penetration-lead early adoption; utilities in Latin America and the Middle East are now issuing similar tender specs.
Restraints Impact Analysis*
| Restraint | (~) % Impact on CAGR Forecast | Geographic Relevance | Impact Timeline |
|---|---|---|---|
| CAPEX intensiveness for multi-axis servo-hydraulic rigs | -0.8% | Global, particularly affecting smaller manufacturers | Short term (≤ 2 years) |
| Global shortage of metrology-grade sensors and DAQ chips | -1.1% | Global, with acute impacts in APAC manufacturing hubs | Medium term (2-4 years) |
| Fragmented global calibration standards | -0.6% | Global, with varying impacts across regions and applications | Long term (≥ 4 years) |
| Emerging virtual testing replacing some physical benches | -0.4% | North America & EU leading, gradual APAC adoption | Medium term (2-4 years) |
| Source: Mordor Intelligence | |||
CAPEX Intensiveness for Multi-Axis Servo-Hydraulic Rigs
Full-scale aerospace or rail fatigue rigs with 120+ control channels can run beyond USD 5 million per installation, limiting accessibility for smaller OEMs and research labs. Airbus Military had to co-engineer an Active Load Abort arrangement for the A400M that only three vendors worldwide could supply, underscoring the thin provider pool. Test-as-a-Service models partially offset the barrier: VIAVI now rents 5G and O-RAN benches on a subscription basis, but intellectual-property leakage fears restrain take-up in high-stake vehicle programs. Capital hurdles remain especially high in emerging economies where export finance rarely covers test assets.
Global Shortage of Metrology-Grade Sensors and DAQ Chips
Lead times for 24-bit ADCs, strain-gauge conditioners, and high-temperature pressure transducers extended from 12 to 30 months in late-2024, forcing bench suppliers to re-spin designs around what parts they could procure. NIST cataloged 36 critical measurement gaps across lithography, packaging, and wafer-level calibration-each one rippling back into precision test benches for automotive and aerospace electronics. The USD 52.7 billion CHIPS Act will relieve constraints from 2026 onward, yet in the interim most vendors bulk-buy inventory and raise prices. TestEquity noted across-the-board cost uplifts that make benches 8-12% more expensive YOY by early-2025.
*Our forecasts treat driver/restraint impacts as directional, not additive. The impact forecasts reflect baseline growth, mix effects, and variable interactions.
Segment Analysis
By Bench Type: Battery Testing Drives Innovation
Battery and inverter platforms are the fastest-advancing category, recording 7.03% CAGR through 2030 as OEMs scale 800 V packs and megawatt charging standards. Within the test benches market size for bench type, end-of-line functional rigs still hold a 32.45% slice in 2024, sustained by ICE powertrain, electronics, and white-goods production flows. Hardware-in-the-loop benches next show momentum because autonomous architectures require real ECU-in-loop validation to pass safety cases. Structural and durability rigs remain core for aerospace wing boxes and car body-in-white fatigue programs, though volume growth trails electrification-linked benches.
Demand patterns reveal that high-voltage battery cyclers now specify 1,500 V and 1,200 A transients, while inverter benches integrate regenerative loads to recover grid energy. dSPACE integrated cell voltage emulation accuracy to 1 mV for advanced BMS logic. FEV opened a 25,000 m² center capable of 120 climatic chambers and full-vehicle battery abuse labs, highlighting capital depth among service providers. Legacy engine dyno vendors now retro-fit torque sensors onto motor-dyno hybrids to retain relevance as ICE-only R&D budgets taper.


By Component: Software Acceleration Reshapes Market
Hardware contributed 51.35% to the 2024 test benches market share, but compound growth now tilts toward analytics and orchestration software. Vendors intertwine physics-based models, machine-learning anomaly detection, and cloud APIs to create closed-loop validation suites. Emerson’s USD 8.2 billion NI purchase in 2024 bundled LabVIEW, TestStand, and data-management IP inside a newly formed Test & Measurement vertical. With LabVIEW 2024 embedding an AI assistant for automated driver generation, software became the decisive value lever.
The services slice, although smallest, rises steady as OEMs subscribe to capacity rather than owning rigs. Keysight couples hardware rentals with pay-per-use licenses for Scenario Libraries that feed autonomous vehicle benches. Simulation-software acquisitions continue; Keysight’s purchase of ESI’s SimulationX injects multiphysics digital twins into pre-silicon and post-silicon workflows. Over the forecast horizon, software-driven repeat business cushions revenue volatility from lumpy capital shipments.
By Automation Level: Manual Systems Face Disruption
Manual rigs still represent 45.21% of the 2024 installed base, largely within repair depots and R&D labs where tactile diagnostics remain essential. However, fully automated cells are forecast to grow 10.53% CAGR, aided by vision systems, collaborative robots, and MES hand-offs. Advanced Test and Automation’s Ensure bench for oil-pump validation logs pass-fail metrics automatically and syncs them to ERP dashboards, improving traceability. Schleuniger’s RotaryTest 4000 delivers four-second test cycles for wire harness rotary joints, levels unreachable by manual swaps.
The middle path-semi-automated rigs-continues to serve prototype phases where engineers tweak parameters live. Yet AI-guided autotuning and predictive-maintenance algorithms are tipping ROI toward full automation even for low-volume production. Market analysts anticipate a staged shift: mature economies replace labor-intensive benches first, and emerging regions follow as wage differentials narrow.
By Application Industry: Power Generation Emerges
Automotive retains a 38.91% weighting yet evolves from combustion to electrification and autonomous validation. The test benches market size for power generation and energy storage is projected to expand at 9.31% CAGR, the top performer, propelled by solar, wind, and stationary batteries. UC San Diego and Cummins partnered on ten-channel battery test lines for grid services such as frequency regulation and peak shaving. Aerospace and defense use cases stay robust as electric-flight pioneers like Eviation and Airbus depend on regenerative motor-propeller rigs with 5 MW capacities.
Electronics and semiconductor benches see revival thanks to AI accelerators and photonic chips requiring wafer-level thermal cycling. Industrial machinery remains a baseline, where hydraulic actuators, pumps, and compressors demand proof testing under ISO compliance. Application diversity underpins the segment’s resilience, providing suppliers numerous verticals to offset cyclicality in any single sector.
Geography Analysis
Asia-Pacific’s dominance began in 2024 at 37.81% share and is cementing through the forecast horizon by virtue of integrated supply chains and government incentives. China’s vertically integrated battery ecosystem funnels continuous throughput to high-voltage cyclers, impedance spectrometers, and fire-abuse chambers. India’s production-linked incentive (PLI) schemes for electronics catalyze demand for functional and environmental benches, with the Kaynes Bhopal site illustrating how EMS players internalize validation to shorten launch cycles. South Korea’s tier-1 suppliers invest in compact module lines that bundle end-of-line benches with automatic optical inspection, reinforcing pull-through for local test-equipment houses.
North America ranks second, driven by large aerospace primes and silicon players. Keysight recorded USD 5.5 billion FY2023 revenue, with roughly one-third linked to aerospace and defense benches. The Auburn Hills TÜV SÜD facility broadens the regional third-party lab network, enabling Detroit automakers to externalize destructive pack abuse tests and conserve capital. Autonomous vehicle pilots in California and Texas generate HiL upgrades across radar, lidar, and domain-controller benches, while cybersecurity mandates rally demand for side-channel analysis rigs.
Europe follows a regulation-pull model. UNECE cyber-security rules force OEMs and tier-1 suppliers to certify across an expanding matrix of threat scenarios, sustaining niche providers that specialize in cryptographic validation. Renewable-grid integration in Germany and the Nordics requires gigawatt-class inverter benches, underpinning AMETEK and EGSTON’s order pipelines. Major European carmakers, typified by BMW’s Wackersdorf expansion, embed mid-cycle software update rigs to align with over-the-air maintenance philosophies. These factors collectively elevate Europe’s bench sophistication and mix, compensating for slower volume growth compared with Asia-Pacific.

Competitive Landscape
The test benches market remains moderately fragmented, with application-specific clusters. Keysight, Teradyne, and the newly minted Emerson-NI ensemble leverage scale, broad IP portfolios, and software ecosystems to lock in enterprise accounts. Their strategies hinge on full-stack solutions-hardware, orchestration, analytics-to reduce vendor count for OEMs wrestling with compressed development schedules. In aerospace, MTS and Moog dominate multi-axis structural rigs where qualification demands safety pedigree, lifting entry barriers.
Strategic moves emphasize three levers. First, mergers and acquisitions fill portfolio gaps: Emerson’s NI deal injects LabVIEW and PXI modularity into industrial automation, positioning the firm for cross-sell synergies with PLC customers. Second, partnerships extend reach into emerging technologies: Teradyne allied with Infineon for power semiconductor benches, targeting the fast-growing SiC and GaN domain. Third, service models challenge traditional capex sales as VIAVI and Keysight pilot subscription benches, generating recurring revenue streams while lowering adoption barriers for start-ups.
Regional challengers exploit specialization. Chinese vendors such as Tonhe and Deye build price-aggressive inverter simulators custom-tuned to local grid codes. European firms including dSPACE and AVL stay ahead in HiL algorithms and real-time models that underpin autonomy and electrification. Competitive dynamics will continue to favor suppliers that integrate secure software pipelines, cloud connectivity, and AI-based diagnostics over those relying on standalone mechanical performance.
Test Benches Industry Leaders
Keysight Technologies, Inc.
National Instruments Corporation
ATEQ Corporation
Chroma ATE Inc.
Teradyne, Inc.
- *Disclaimer: Major Players sorted in no particular order

Recent Industry Developments
- March 2025: Teradyne agreed to buy Quantifi Photonics, adding coherent-optics and silicon-photonics capability that positions the company for AI data-center transceiver testing. The deal accelerates Teradyne’s diversification into photonics while exploiting its global sales channel to scale Quantifi’s benches.
- March 2025: Aehr Test Systems logged USD 4.7 million in repeat orders for FOX-CP systems from an advanced storage device maker, underscoring sustained wafer-level burn-in demand as AI workloads push non-volatile memory endurance. The follow-on nature affirms Aehr’s customer-lock strategy and growing annuity from consumables.
- February 2025: Aehr shipped its first FOX-XP wafer-level system for AI processors, signalling entry into advanced logic where thermal uniformity and power cycling at wafer level can compress test time versus singulated burn-in. This expands addressable market beyond SiC power devices.
- January 2025: FormFactor deepened its partnership with Advantest to co-develop silicon-photonics wafer-level benches, aligning both firms for high-volume optical I/O adoption in CPU and GPU roadmaps.


Global Test Benches Market Report Scope
| Engine and Powertrain |
| End-of-Line Functional |
| Hardware-in-the-Loop (HiL) |
| Structural and Durability |
| Battery and Inverter |
| Hardware |
| Software |
| Services |
| Manual |
| Semi-Automated |
| Fully Automated |
| Automotive and Mobility |
| Aerospace and Defense |
| Power Generation and Energy Storage |
| Industrial Machinery and Manufacturing |
| Electronics and Semiconductors |
| Other Application Industries |
| North America | United States | |
| Canada | ||
| Mexico | ||
| Europe | Germany | |
| United Kingdom | ||
| France | ||
| Italy | ||
| Spain | ||
| Russia | ||
| Rest of Europe | ||
| Asia-Pacific | China | |
| Japan | ||
| South Korea | ||
| India | ||
| Australia | ||
| Rest of Asia-Pacific | ||
| South America | Brazil | |
| Argentina | ||
| Chile | ||
| Colombia | ||
| Rest of South America | ||
| Middle East and Africa | Middle East | Saudi Arabia |
| United Arab Emirates | ||
| Rest of Middle East | ||
| Africa | South Africa | |
| Nigeria | ||
| Kenya | ||
| Rest of Africa | ||
| By Bench Type | Engine and Powertrain | ||
| End-of-Line Functional | |||
| Hardware-in-the-Loop (HiL) | |||
| Structural and Durability | |||
| Battery and Inverter | |||
| By Component | Hardware | ||
| Software | |||
| Services | |||
| By Automation Level | Manual | ||
| Semi-Automated | |||
| Fully Automated | |||
| By Application Industry | Automotive and Mobility | ||
| Aerospace and Defense | |||
| Power Generation and Energy Storage | |||
| Industrial Machinery and Manufacturing | |||
| Electronics and Semiconductors | |||
| Other Application Industries | |||
| By Geography | North America | United States | |
| Canada | |||
| Mexico | |||
| Europe | Germany | ||
| United Kingdom | |||
| France | |||
| Italy | |||
| Spain | |||
| Russia | |||
| Rest of Europe | |||
| Asia-Pacific | China | ||
| Japan | |||
| South Korea | |||
| India | |||
| Australia | |||
| Rest of Asia-Pacific | |||
| South America | Brazil | ||
| Argentina | |||
| Chile | |||
| Colombia | |||
| Rest of South America | |||
| Middle East and Africa | Middle East | Saudi Arabia | |
| United Arab Emirates | |||
| Rest of Middle East | |||
| Africa | South Africa | ||
| Nigeria | |||
| Kenya | |||
| Rest of Africa | |||


Key Questions Answered in the Report
How large is the test benches market today?
The test benches market size stood at USD 3.22 billion in 2025 and is projected to reach USD 4.14 billion by 2030.
Which segment is expanding fastest within test benches?
Battery and inverter benches are forecast to grow at 7.03% CAGR as electrification reshapes automotive and grid-storage validation.
Why is Asia-Pacific the growth engine for test benches?
China’s EV production, India’s electronics build-up, and South Korea’s module investments give Asia-Pacific a 37.81% share and a 9.25% CAGR outlook.
What role does software play in modern benches?
Software orchestrates digital twins, automated test sequences, and AI-based diagnostics, contributing to an 8.25% CAGR, the highest among components.
How are cybersecurity rules influencing bench design?
UNECE R155/R156 regulations add penetration, encryption, and secure-boot tests, prompting specialized benches with side-channel analysis capability.
Are capital costs limiting adoption of advanced benches?
Yes. Multi-axis servo-hydraulic rigs can exceed USD 5 million, steering smaller firms toward subscription-based Test-as-a-Service alternatives.
Page last updated on:


