Liquid Penetrant Testing (PT) Market Size and Share
Market Overview
| Study Period | 2019 - 2030 |
|---|---|
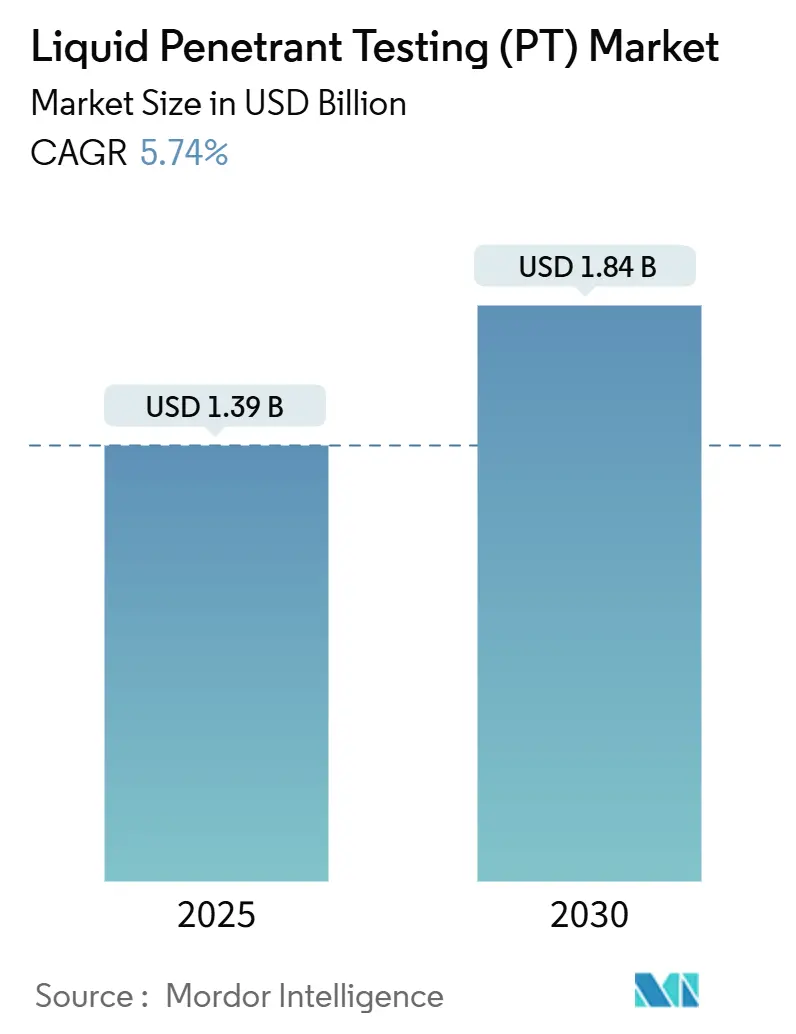
| Market Size (2025) | USD 1.39 Billion |
| Market Size (2030) | USD 1.84 Billion |
| Growth Rate (2025 - 2030) | 5.74% CAGR |
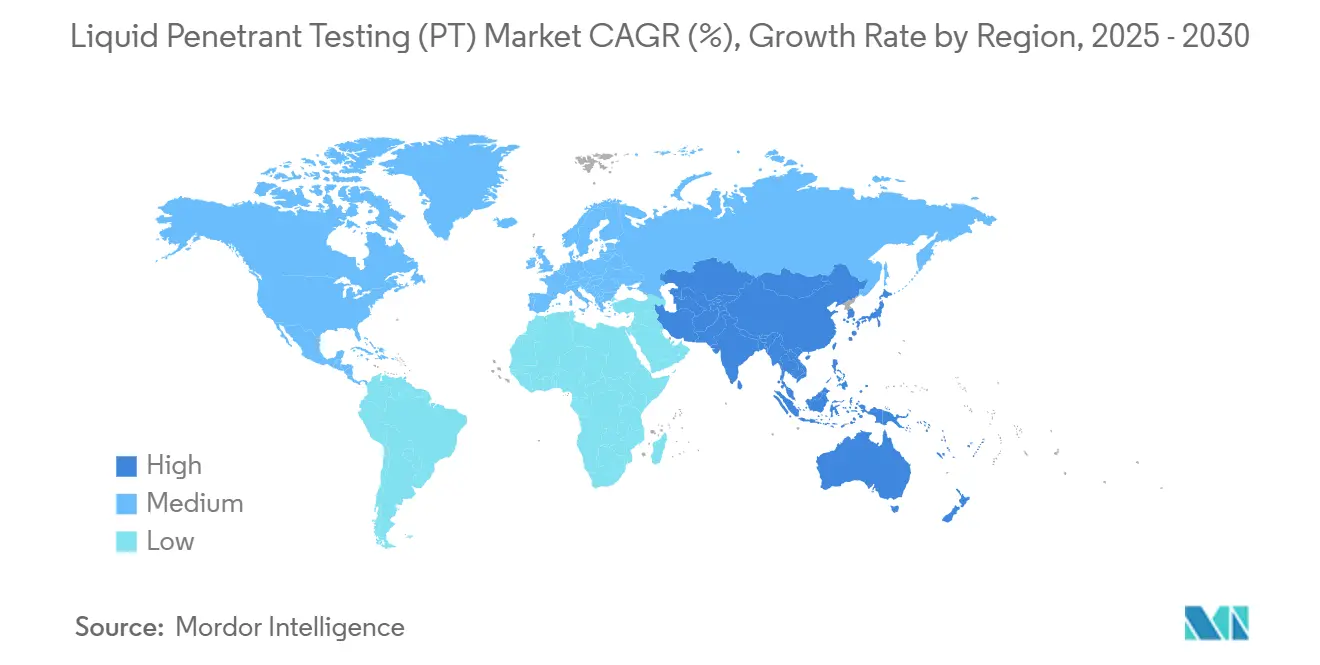
| Fastest Growing Market | Asia Pacific |
| Largest Market | North America |
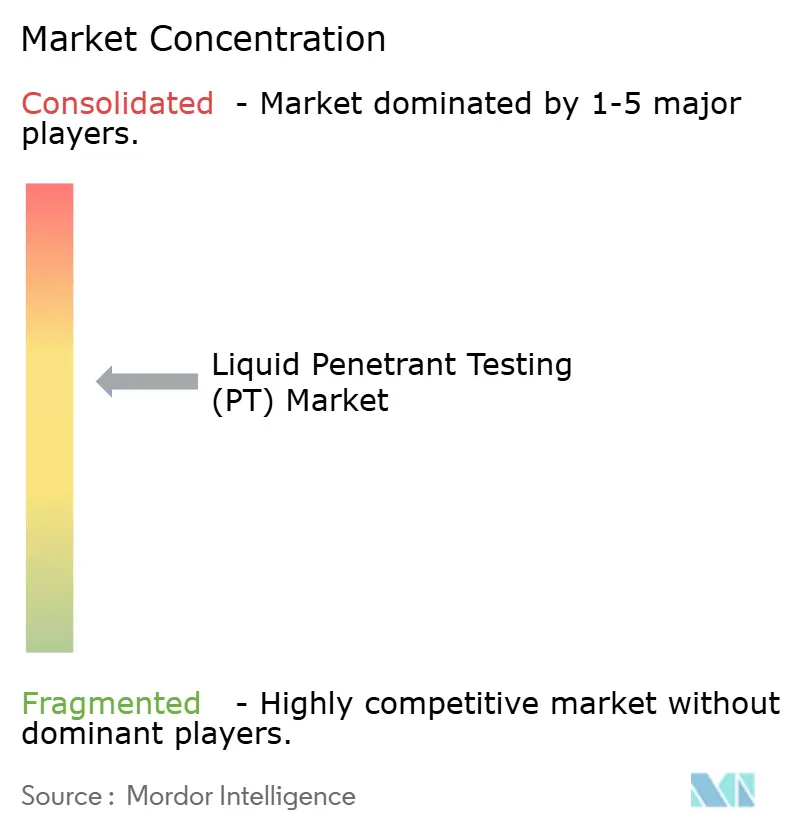
| Market Concentration | Medium |
Major Players *Disclaimer: Major Players sorted in no particular order Image © Mordor Intelligence. Reuse requires attribution under CC BY 4.0. | |
Liquid Penetrant Testing (PT) Market Analysis by Mordor Intelligence
The liquid penetrant testing market size was USD 1.39 billion in 2025 and is projected to reach USD 1.84 billion by 2030, growing at a 5.74% CAGR from 2025 to 2030. Rising safety requirements across aviation, energy, and transportation continue to pull demand for highly sensitive surface-flaw detection. Automated inspection cells that combine fluorescent chemicals with machine-vision cameras are transitioning from pilot lines to full-scale production, enabling manufacturers to detect 1-micrometer cracks in seconds. Regulatory frameworks in nuclear power and aviation maintain tight inspection intervals, while digital documentation platforms make traceability a purchasing imperative. At the same time, computed tomography suppliers are positioning 3-D volumetric scans as a partial substitute, forcing penetrant vendors to sharpen their price-performance ratios and invest in eco-friendly chemistries.
Key Report Takeaways
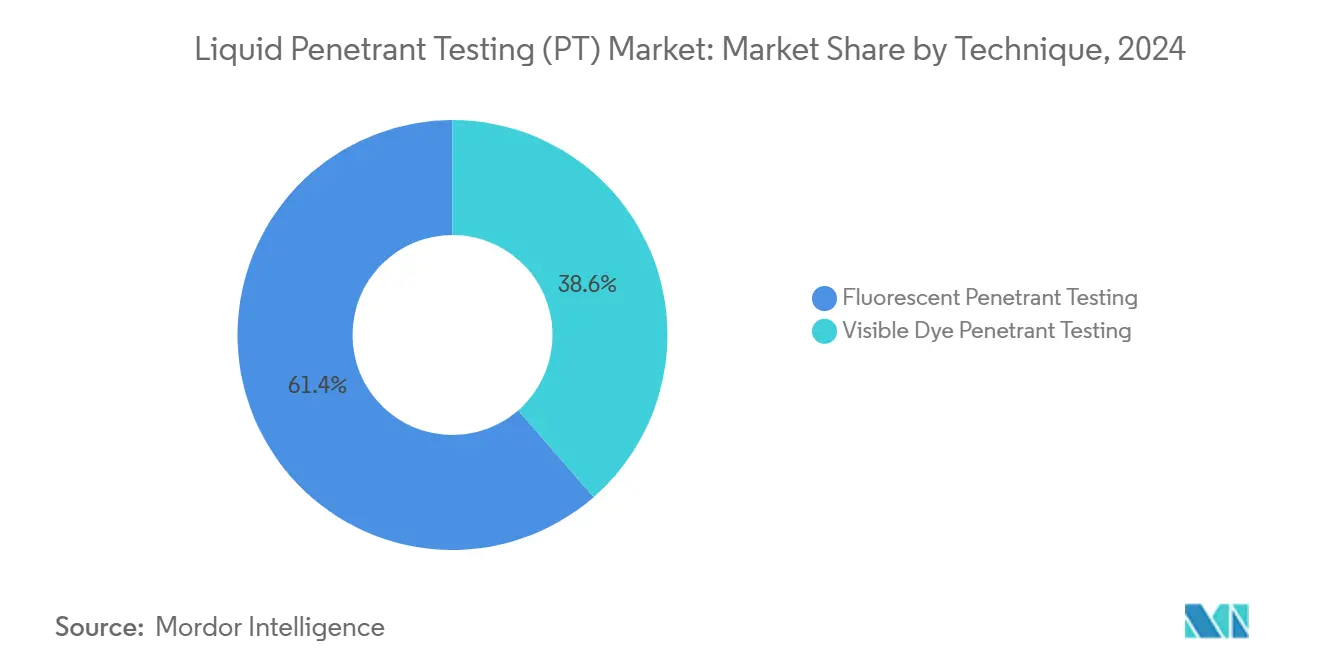
- By technique, fluorescent systems held a 61.4% share of the liquid penetrant testing market in 2024, and are projected to post a 6.2% CAGR to 2030.
- By portability, portable and handheld units accounted for 46.8% of the liquid penetrant testing market size in 2024, whereas automated and robotic solutions are poised for a 9.7% CAGR.
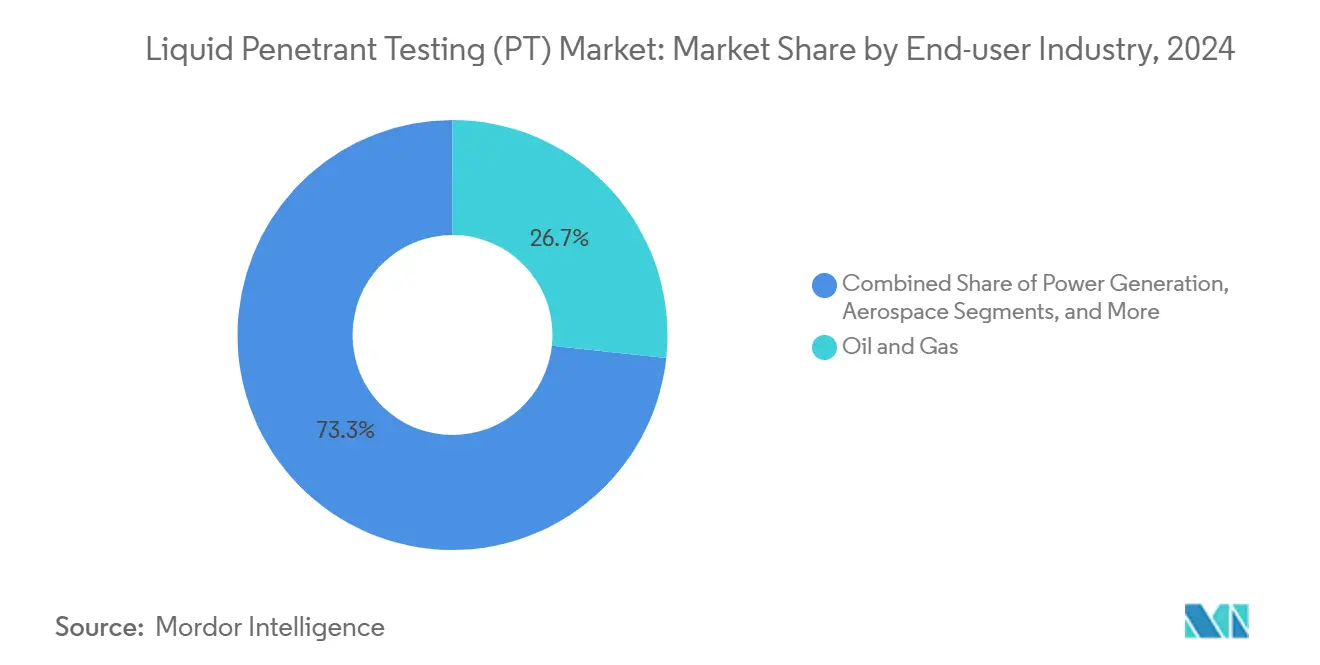
- By end-user industry, the oil and gas sector led with a 26.7% market share in liquid penetrant testing in 2024, while the automotive and transportation sector is expected to rise fastest at an 8.3% CAGR.
- By geography, the North America region captured 34.5% of 2024 revenues, while the Asia-Pacific is projected to grow at a 7.2% CAGR through 2030.
Global Liquid Penetrant Testing (PT) Market Trends and Insights
Drivers Impact Analysis*
| Driver | (~) % Impact on CAGR Forecast | Geographic Relevance | Impact Timeline |
|---|---|---|---|
| Rising demand for reliable surface flaw inspection in additive manufacturing | +1.2% | Global, with a concentration in North America and Europe | Medium term (2-4 years) |
| Increasing adoption of in-service MRO checks across aging aircraft fleets | +1.8% | North America and Europe primarily | Long term (≥ 4 years) |
| Shift towards preventive maintenance in mid-stream oil and gas pipelines | +1.1% | Global, with emphasis on North America and the Middle East | Medium term (2-4 years) |
| Regulatory mandates for weld quality in small modular reactors (SMRs) | +0.9% | North America and Europe, expanding to the Asia-Pacific | Long term (≥ 4 years) |
| Cost-effective alternative to eddy current for complex-geometry castings | +0.7% | Global manufacturing regions | Short term (≤ 2 years) |
| Integration with cobot-based inspection cells on automotive lines | +0.8% | Asia-Pacific and Europe automotive hubs | Medium term (2-4 years) |
| Source: Mordor Intelligence | |||
Rising Demand for Reliable Surface Flaw Inspection in Additive Manufacturing
Additively manufactured parts often contain microscopic porosity and lack-of-fusion seams, which compromise fatigue life. Fluorescent penetrants detect surface-breaking defects down to 10 micrometers, outperforming many eddy-current probes on rough powder-bed surfaces. Aerospace primes have issued new process specifications that make fluorescent systems mandatory for 3-D printed engine mounts. Automated spray booths, coupled with conveyorized dryers, now inspect up to 600 parts per hour, reducing touch labor by 40%. Updated ASTM guidelines, published in the 2024 standard, standardize the acceptance criteria for powder-bed and directed-energy-deposition alloys.[1]ASTM International, “Standards for Additive Manufacturing Quality Control,” astm.org This clarity gives procurement teams greater confidence when scaling production lines.
Increasing Adoption in In-Service MRO Checks Across Aging Aircraft Fleets
The global commercial jet fleet averaged 11.7 years of service in 2024, thereby increasing the fatigue-crack risk in high-cycle structures. Revised FAA rules require penetrant inspections on fuselage lap joints and landing-gear trunnions at intervals 50% shorter than prior schedules. Airlines now employ battery-powered handheld kits that deliver on-wing results in under 30 minutes, reducing gate delays. Leasing companies insist on full penetrant reports before redelivery, supporting a secondary-market ecosystem of certified inspection labs. Data from the European Union Aviation Safety Agency showed a 23% increase in defects discovered versus visual checks alone in 2024. Cloud-based maintenance systems capture these findings and feed them into predictive algorithms that help carriers optimize structural-repair budgeting.
Shift Toward Preventive Maintenance in Mid-Stream Oil and Gas Pipelines
Pipeline operators face stricter integrity rules under the U.S. Mega Rule, prompting a move from reactive repairs to cyclic inspection strategies. Penetrant testing complements magnetic-flux-leakage pigs by flagging surface-breaking weld anomalies that inline tools cannot always sense. MISTRAS Group reported a 13% increase in penetrant-driven pipeline revenue in 2024, attributing the growth to North American midstream expansions.[2]MISTRAS Group, “Annual Financial Results and Strategic Updates,” mistrasgroup.com Digital reporting platforms now automatically link penetrant images to geotagged weld IDs, enabling integrity engineers to launch repairs before stress-corrosion cracks propagate. Similar frameworks are appearing in the Middle East as cross-border gas corridors increase.
Regulatory Mandates for Weld Quality in Small Modular Reactors (SMRs)
The U.S. Nuclear Regulatory Commission’s guidance for SMRs requires multiple surface-examination passes on pressure-boundary welds. Fluorescent penetrants verify seam integrity after each orbital TIG run, supporting acceptance criteria that are 40% tighter than legacy nuclear codes. Leading SMR vendors have installed fully enclosed robotic cells that perform apply-dwell-rinse-dry cycles within shielded environments, protecting personnel from radiological exposure while raising process repeatability. European utilities developing Generation-IV reactors intend to import similar platforms as fabrication ramps up after 2026.
Restraints Impact Analysis*
| Restraint | (~) % Impact on CAGR Forecast | Geographic Relevance | Impact Timeline |
|---|---|---|---|
| Volatility in aerospace production cycles is affecting capital spending | -0.8% | North America and Europe primarily | Short term (≤ 2 years) |
| Operator-dependent variability and shortage of Level-III PT inspectors | -1.1% | Global, acute in North America and Europe | Medium term (2-4 years) |
| Environmental concerns over solvent-based emulsifiers and developers | -0.6% | Global, strictest in Europe and North America | Long term (≥ 4 years) |
| Competitive threat from emerging computed tomography (CT) solutions | -0.9% | Global, led by advanced manufacturing regions | Medium term (2-4 years) |
| Source: Mordor Intelligence | |||
Volatility in Aerospace Production Cycles Affecting Capital Spend
Aerospace build rates remain highly sensitive to supply chain disruptions and certification delays, causing quarterly swings in output that ripple through the inspection-equipment budget cycle. Boeing’s line-rate resets and Airbus delivery slippages in 2024 led several tier-one structures suppliers to freeze or cancel purchase orders for new automated penetrant booths. Industry statistics indicate that aerospace capital expenditures on non-destructive testing equipment declined 15% year-over-year in 2024, reversing the post-pandemic rebound. The spending retreat hits liquid penetrant testing vendors the hardest on large-ticket items, such as robotic spray cells and fully enclosed fluorescent lines, prompting them to extend payment terms and prioritize short-term rentals over outright sales. Service providers are also revising revenue forecasts because airline maintenance shops defer discretionary upgrades when airframe utilization dips. Until narrow-body backlogs stabilize after 2026, suppliers will continue to navigate elongated deal cycles and unpredictable order volumes.
Operator-Dependent Variability and Shortage of Level-III PT Inspectors
Liquid penetrant testing interpretation still leans heavily on human judgment. Roughly 25% fewer Level III specialists are available than demand dictates, according to the American Society for Nondestructive Testing.[3]American Society for Nondestructive Testing, “Workforce Development and Certification Standards,” asnt.org Retirements will outpace trainee certifications for at least five years, forcing manufacturers to schedule inspections weeks in advance or pay premium rates. Studies on identical test coupons reveal discrepancies of up to 20% in flaw calls between qualified inspectors. Vendors are rolling out AI-driven image-analysis software that highlights suspect indications and suggests disposition codes, yet auditors continue to require human sign-off for safety-critical components. Until automated evaluation achieves greater regulatory acceptance, the skill gap will continue to restrain throughput.
*Our forecasts treat driver/restraint impacts as directional, not additive. The impact forecasts reflect baseline growth, mix effects, and variable interactions.
Segment Analysis
By Technique: Fluorescent Systems Drive Superior Sensitivity
Fluorescent penetrant systems captured 61.4% of the liquid penetrant testing market in 2024, thanks to their capability to expose 1-micrometer discontinuities under UV-A lighting. The segment’s 6.2% forecast CAGR will keep it well ahead of visible dyes, whose usage is relegated to outdoor or budget-constrained settings. New low-toxicity carriers meet European REACH limits without compromising brightness, thereby protecting the segment from environmental pushback. In electric-vehicle battery housing production, automated fluorescent tunnels verify casting porosity on every unit, a procedure now embedded in many OEM process control plans.
Visible dye formulations remain relevant for on-site pipeline girth inspections where darkroom facilities are unavailable. However, their lower sensitivity drives contractors to apply tighter acceptance limits, which in turn increases reject rates. Suppliers are experimenting with dual-mode chemistries that fluoresce under violet LEDs yet still appear vivid red under white light, bridging the gap between the two categories and helping end-users simplify inventory.


By Portability: Automation Reshapes Inspection Workflows
Portable and handheld kits represented 46.8% of the liquid penetrant testing market size in 2024, underscoring the dominance of field inspections on pipelines, aircraft, and construction welds. Lightweight aerosol packs and cordless UV lamps enable technicians to survey turbine blades without disassembly, saving thousands of labor hours each year. Nevertheless, their reliance on manual technique can hinder repeatability in high-volume production settings.
Automated and robotic stations, which currently account for only 15% of 2024 revenue, are expected to grow at a 9.7% CAGR as cobots become easier to program. Vision-guided arms now spray penetrant with ±0.3 mm path accuracy and adapt dwell times based on ambient temperature. Universal Robots sells off-the-shelf end-effectors that integrate rinse nozzles and air knives, slashing cycle time by 25%. Manufacturers integrating these cells report defect-detection consistency within 3 sigma across three shifts, a performance unattainable with manual fluorescent booths.
By End-user Industry: Oil and Gas Leadership Faces Automotive Challenge
Oil and gas operators held a 26.7% market share in liquid penetrant testing in 2024, driven by the 2.7 million-mile U.S. pipeline network and the expansion of LNG terminals. Routine shutdown turnarounds allocate up to 6% of maintenance budgets to surface-examination tasks, ensuring a solid recurring revenue base. Refinery revamps scheduled through 2030 will sustain demand even as upstream exploration wavers.
Automotive and transportation applications are growing at the fastest rate, with an 8.3% CAGR. Battery casings for electric vehicles must be leak-tight to prevent electrolyte spills, and aluminum-die-casting rejects have decreased by half at OEMs that implemented 100% fluorescent inspections. Composite truck-body panels also require penetrant checks to reveal fiber pull-out defects after trimming. Tier-One suppliers now quote digitally traceable reports with barcode linkage to individual vehicle identification numbers, aligning with automaker quality-gate KPIs.

Geography Analysis
North America retained the largest share, at 34.5%, in 2024, primarily due to its extensive network of aerospace, nuclear, and midstream pipeline assets. The United States alone houses 93 operating nuclear reactors that require rigorous weld examinations, thereby establishing a stable revenue stream. Recent EPA rules on perchloroethylene are pushing formulators to switch to biodegradable carriers, spurring a mini-replacement cycle for consumables. Canada’s oil-sands upgraders and Mexico’s emerging airframe cluster around Querétaro add incremental demand, broadening the customer base.
The Asia-Pacific region is forecast to post a 7.2% CAGR, the fastest among all regions. China’s Belt and Road rails and bridges require weld integrity checks on thousands of kilometers of steel girders, while India’s plan to boost nuclear capacity to 22,480 MW by 2031 sets stringent surface-examination requirements.[4]Nuclear Power Corporation of India, “Nuclear Power Expansion Program,” npcil.nic.in Korean and Japanese reactor component fabricators adopt robotic penetrant booths to protect workers and reduce takt time. Electric-vehicle giga-factories across China and Thailand operate in-line fluorescent tunnels that inspect motor housings at a 30-second cadence, driving double-digit growth in consumables.
Europe commands a mature, innovation-centric market shaped by environmental rules and advanced manufacturing. Airbus specifies UV-LED radiant power minimums that exceed global norms, driving upgrades of legacy inspection lamps across subcontractor sites. Offshore wind farms in the North Sea require periodic penetrant checks on turbine-tower flange bolts, creating a niche in the marine services industry. The REACH legislation has accelerated the rollout of water-washable penetrants with volatile organic compound content below 10 g/L, positioning European vendors as sustainability leaders.

Competitive Landscape
Competition is moderate, with the top five vendors accounting a significant share of the revenue. Baker Hughes’ Waygate Technologies couples penetrant equipment with Phoenix Nanotom HR X-ray units to offer one-stop inspection suites. MISTRAS Group leverages its Plant Condition Management Software to cross-reference penetrant images with ultrasonic and acoustic-emission data, providing asset-integrity dashboards that lock in service contracts beyond initial inspections. Fujifilm markets low-odor, quick-draining fluorescent emulsions aligned with European eco-labels, gaining market share among environmentally conscious aerospace primes.
Start-ups are exploiting robotics gaps by delivering drop-in cobot kits pre-loaded with ISO 9712-compliant procedures. However, new entrants face certification barriers and must prove chemical compatibility with legacy cleaning systems to win approvals. Large oil-field-service conglomerates possess the scale to subsidize R and D in AI recognition, intensifying competitive pressure on mid-tier suppliers. End-users are increasingly favoring multi-year framework agreements that bundle consumables, equipment rental, and inspector training, rewarding vendors with broad portfolios and global logistics capabilities.
Liquid Penetrant Testing (PT) Industry Leaders
Baker Hughes Company (Waygate Technologies)
MISTRAS Group Inc.
Applus Services SA
Olympus Corporation
Zetec Inc.
- *Disclaimer: Major Players sorted in no particular order

Recent Industry Developments
- May 2025: Baker Hughes’ Waygate Technologies introduced the Phoenix Nanotom HR high-resolution CT system, enhancing complementary inspection capabilities.
- March 2025: MISTRAS Group reported FY 2024 revenue of USD 729.6 million with adjusted EBITDA up 25.3%, attributing gains to aerospace and defense digital-service growth.
- January 2025: The U.S. EPA finalized Toxic Substances Control Act rules on perchloroethylene, compelling penetrant formulators to adopt workplace chemical protection programs.
- October 2024: Baker Hughes and GE Aerospace partnered to co-develop AI borescope analysis for jet engines, integrating defect recognition with maintenance planning.


Global Liquid Penetrant Testing (PT) Market Report Scope
| Fluorescent Penetrant Testing |
| Visible Dye Penetrant Testing |
| Portable / Handheld |
| Stationary / Benchtop |
| Automated / Robotic |
| Oil and Gas |
| Power Generation |
| Aerospace |
| Defense |
| Automotive and Transportation |
| Manufacturing and Heavy Engineering |
| Construction and Infrastructure |
| Chemical and Petrochemical |
| Marine and Ship Building |
| Electronics and Semiconductor |
| Mining |
| Medical Devices |
| Others |
| North America | United States |
| Canada | |
| Mexico | |
| South America | Brazil |
| Argentina | |
| Rest of South America | |
| Europe | Germany |
| United Kingdom | |
| France | |
| Italy | |
| Spain | |
| Rest of Europe | |
| Asia Pacific | China |
| Japan | |
| India | |
| South Korea | |
| South-East Asia | |
| Rest of Asia Pacific | |
| Middle East | Saudi Arabia |
| United Arab Emirates | |
| Turkey | |
| Rest of Middle East | |
| Africa | South Africa |
| Nigeria | |
| Rest of Africa |
| By Technique | Fluorescent Penetrant Testing | |
| Visible Dye Penetrant Testing | ||
| By Portability | Portable / Handheld | |
| Stationary / Benchtop | ||
| Automated / Robotic | ||
| By End-user Industry | Oil and Gas | |
| Power Generation | ||
| Aerospace | ||
| Defense | ||
| Automotive and Transportation | ||
| Manufacturing and Heavy Engineering | ||
| Construction and Infrastructure | ||
| Chemical and Petrochemical | ||
| Marine and Ship Building | ||
| Electronics and Semiconductor | ||
| Mining | ||
| Medical Devices | ||
| Others | ||
| By Geography | North America | United States |
| Canada | ||
| Mexico | ||
| South America | Brazil | |
| Argentina | ||
| Rest of South America | ||
| Europe | Germany | |
| United Kingdom | ||
| France | ||
| Italy | ||
| Spain | ||
| Rest of Europe | ||
| Asia Pacific | China | |
| Japan | ||
| India | ||
| South Korea | ||
| South-East Asia | ||
| Rest of Asia Pacific | ||
| Middle East | Saudi Arabia | |
| United Arab Emirates | ||
| Turkey | ||
| Rest of Middle East | ||
| Africa | South Africa | |
| Nigeria | ||
| Rest of Africa | ||


Key Questions Answered in the Report
What is the projected value of the liquid penetrant testing market in 2030?
The market is forecast to reach USD 1.84 billion by 2030.
Which technique currently dominates sales?
Fluorescent systems lead with a 61.4% share of 2024 revenue.
Which end-user sector is expanding the quickest?
Automotive and transportation applications are projected to grow at an 8.3% CAGR through 2030.
Why is Asia-Pacific the fastest-growing region?
Rapid industrialization, infrastructure projects, and electric-vehicle production are boosting inspection demand at a 7.2% regional CAGR.
How are vendors addressing the shortage of certified inspectors?
Suppliers are integrating AI-assisted defect recognition and robotic spray cells to automate the most labor-intensive steps in the process.
Page last updated on:


