Continuous Testing Market Size and Share
Market Overview
| Study Period | 2020 - 2031 |
|---|---|
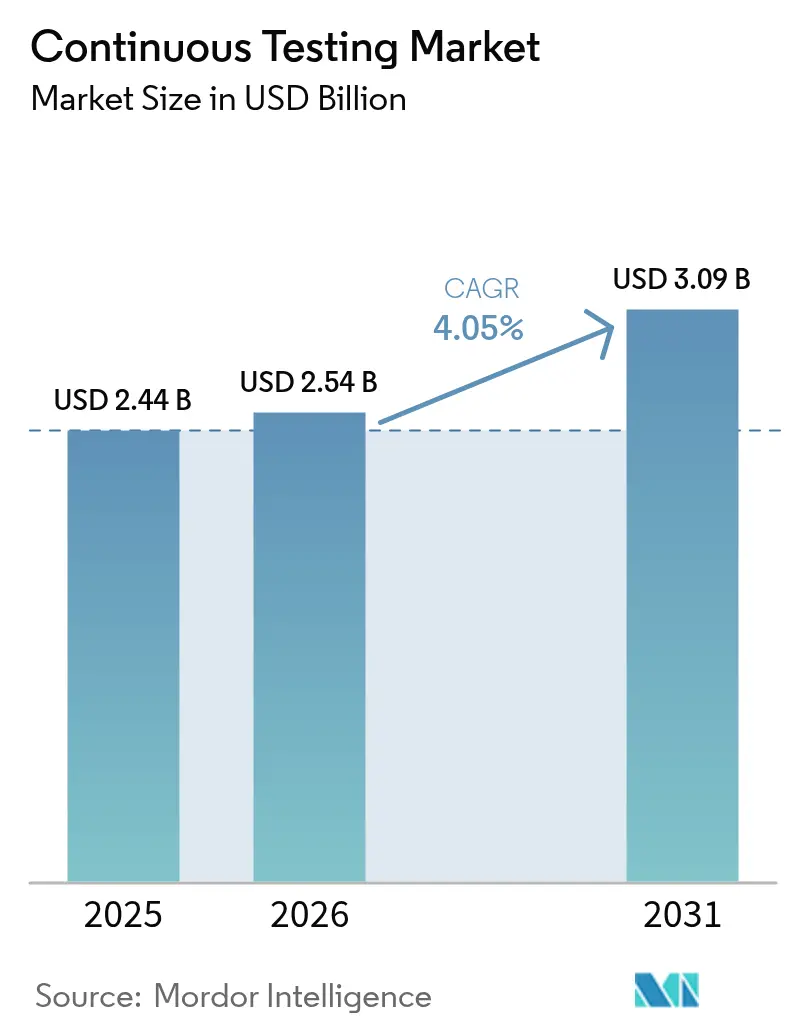
| Market Size (2026) | USD 2.54 Billion |
| Market Size (2031) | USD 3.09 Billion |
| Growth Rate (2026 - 2031) | 4.05% CAGR |
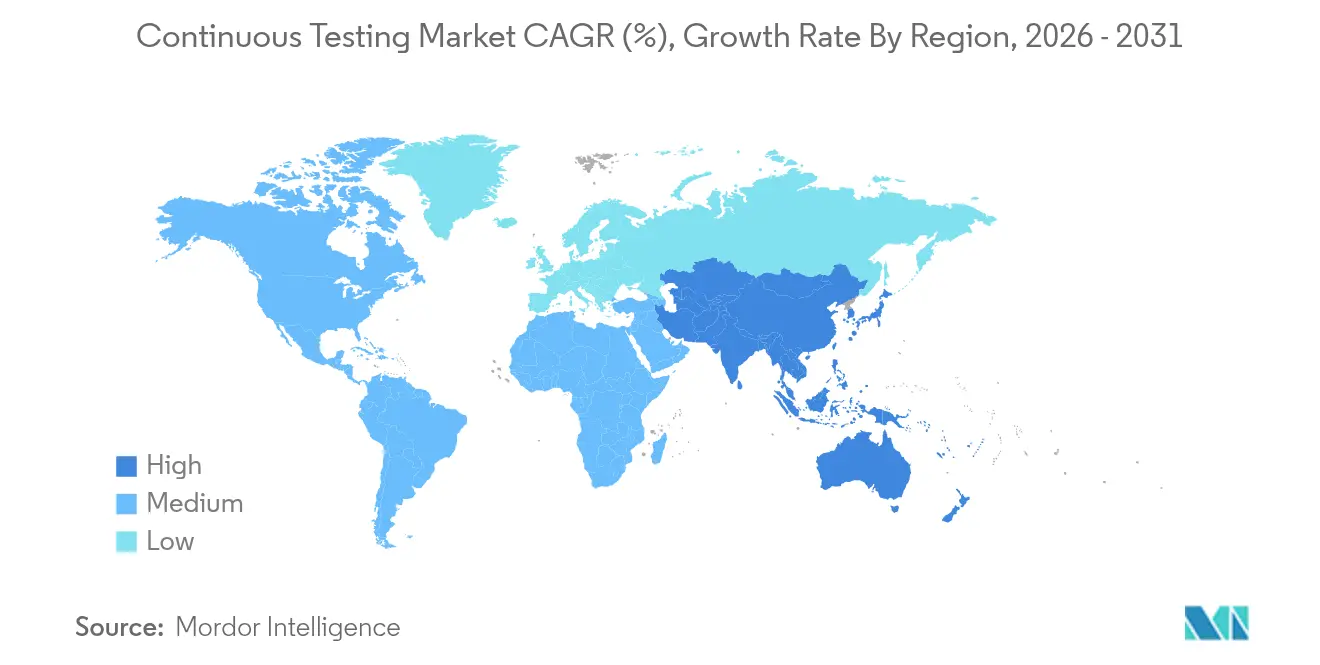
| Fastest Growing Market | Asia Pacific |
| Largest Market | North America |
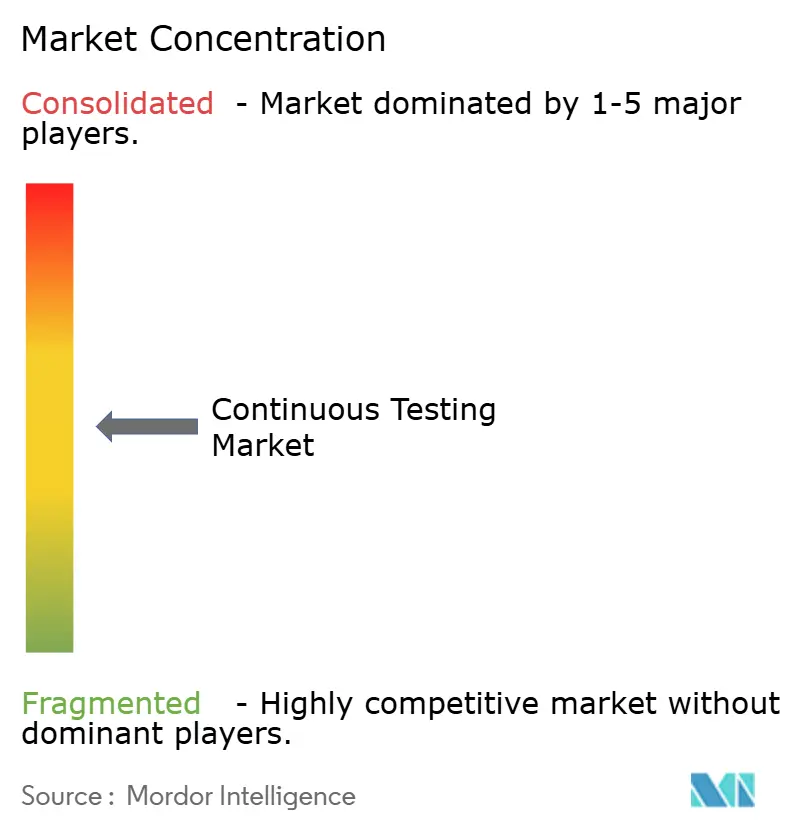
| Market Concentration | Medium |
Major Players *Disclaimer: Major Players sorted in no particular order Image © Mordor Intelligence. Reuse requires attribution under CC BY 4.0. | |
Continuous Testing Market Analysis by Mordor Intelligence
The continuous testing market size was valued at USD 2.44 billion in 2025 and estimated to grow from USD 2.54 billion in 2026 to reach USD 3.09 billion by 2031, at a CAGR of 4.05% during the forecast period (2026-2031). Behind the measured headline rate, the continuous testing market is shifting from traditional quality-assurance workflows to AI-supported, compliance-centric ecosystems. More than 68% of enterprises have already embedded generative AI into quality-engineering processes. Momentum is reinforced by a wider DevOps backdrop growing at a 20.1% CAGR, although only about half of DevOps adopters have achieved full test-automation integration, signalling untapped headroom inside existing pipelines. Managed service partnerships are thriving as skill shortages drive externalisation of test-environment orchestration, while the functional-to-security testing mix is recalibrating in response to new European Cyber Resilience Act milestones. Geographic leadership remains with North America, yet Asia-Pacific’s 5.0% CAGR trajectory suggests a narrowing gap as manufacturers, banks, and retailers digitise at speed.
Key Report Takeaways
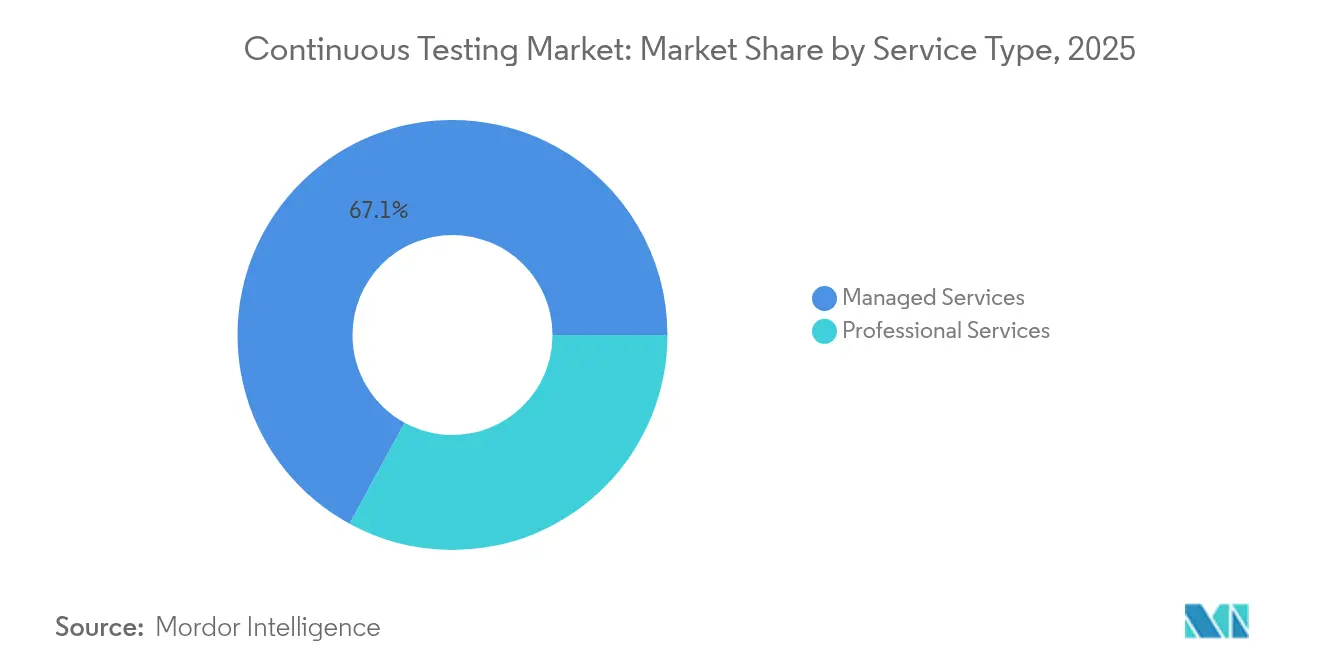
- By service type, managed services held 67.05% revenue share in 2025 while also posting the fastest 5.55% CAGR to 2031.
- By interface, web testing led with 57.45% share in 2025; mobile testing is set to advance at a 5.28% CAGR through 2031.
- By deployment mode, on-premise installations accounted for 70.65% of the continuous testing market size in 2025, although cloud deployments are forecast to grow 5.86% a year to 2031.
- By testing type, functional testing captured 37.55% of the continuous testing market share in 2025, whereas security testing is growing fastest at a 5.03% CAGR.
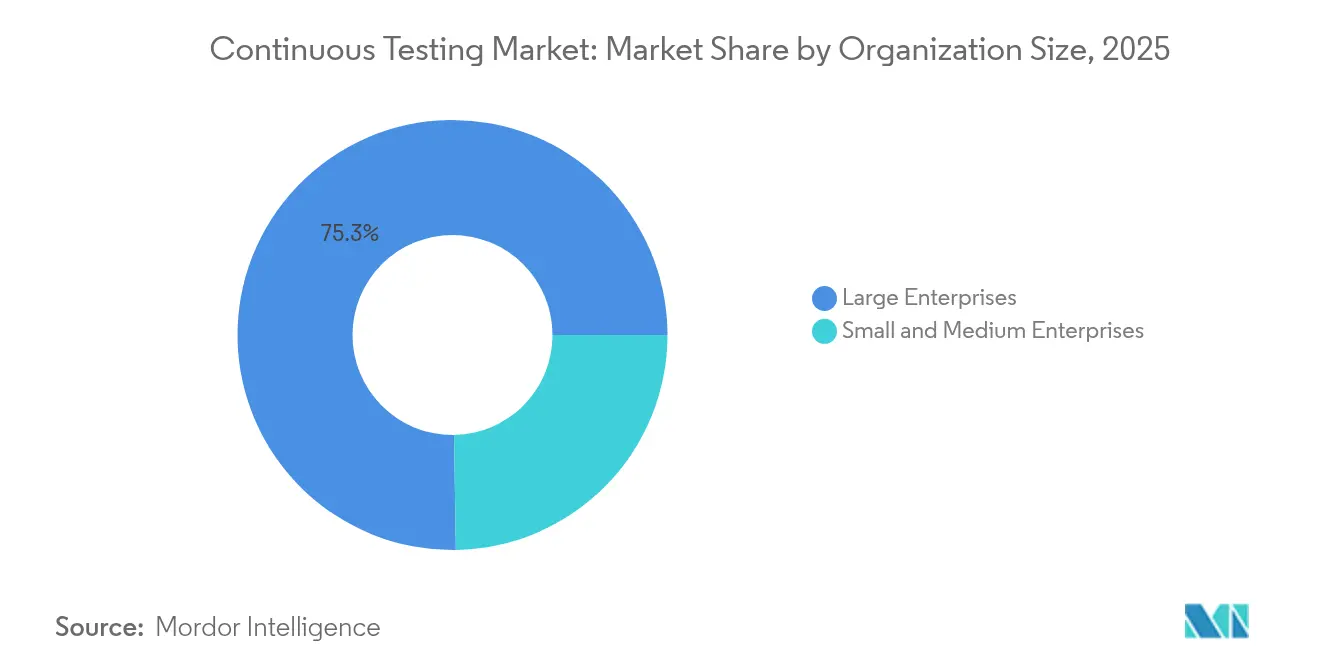
- By organisation size, large enterprises controlled 75.25% of 2025 revenue, but small and medium enterprises are on track for a 5.62% CAGR to 2031.
- By vertical, BFSI commanded 27.90% share in 2025; healthcare and life sciences are projected to register the highest 4.55% CAGR through 2031.
- By geography, North America led with 26.10% share in 2025, while Asia-Pacific is positioned for a 4.82% CAGR.
Note: Market size and forecast figures in this report are generated using Mordor Intelligence’s proprietary estimation framework, updated with the latest available data and insights as of 2026.
Global Continuous Testing Market Trends and Insights
Drivers Impact Analysis*
| Driver | (~) % Impact on CAGR Forecast | Geographic Relevance | Impact Timeline |
|---|---|---|---|
| Adoption of agile and DevOps methodologies | +1.2% | North America, Europe | Medium term (2-4 years) |
| Accelerated digital transformation | +0.8% | APAC, Latin America | Short term (≤ 2 years) |
| AI-augmented testing platforms | +1.0% | North America, Europe, emerging APAC markets | Medium term (2-4 years) |
| Shift to cloud-native architectures | +0.7% | Global, led by developed economies | Long term (≥ 4 years) |
| Regulatory pressure for secure releases | +0.9% | Europe, North America | Short term (≤ 2 years) |
| Sustainability-linked IT procurement | +0.4% | Europe, North America | Long term (≥ 4 years) |
| Source: Mordor Intelligence | |||
Adoption of Agile and DevOps methodologies
DevOps practices are now mainstream, yet sizeable testing gaps persist because continuous testing requires skills that remain scarce. Enterprises that combine DevOps with continuous testing report productivity gains of 20% in regulated banking environments where AI-generated test cases compress release cycles while maintaining audit trails. The role of the traditional QA function is shrinking as companies transition toward quality-engineering models in which responsibility for test coverage shifts to the entire development squad. Analysts expect 90% of all testing workflows to become automated by 2027, elevating demand for AI-assurance engineers and model trainers. Organisations such as Nationwide Building Society illustrate the payoff, citing faster change delivery and higher customer-satisfaction scores after embedding testing earlier in agile increments.
Need for accelerated digital transformation post-COVID
A rapid pivot to digital channels has forced enterprises to release software at unprecedented speed, often stretching quality guardrails. Latin American firms have experienced heightened defect leakage when code is pushed without complete regression cycles. Retailers are scaling AI-guided user-acceptance testing to safeguard 24/7 e-commerce uptime, with one global chain improving conversion by 4.5 percentage points while supporting 10,000 daily orders at “five-nine” availability. Manufacturing leaders say smart-factory competitiveness hinges on software quality, yet ambitions frequently stall when AI pilots cannot be scaled, underscoring the need for platform-level testing frameworks capable of bridging proof-of-concept and enterprise rollout.
Rising adoption of AI-augmented testing platforms
Generative AI is changing the test lifecycle from reactive defect discovery to predictive quality assurance. Algorithms now build test suites from code changes, surface likely breakpoints and recommend targeted regression packs. Vendors such as Tricentis have embedded conversational copilots that let practitioners optimise test portfolios using natural-language prompts, accelerating root-cause analysis and reporting cycles[1]Tricentis GmbH, “Tosca Copilot: Generative AI for Test Optimisation,” tricentis.com. Banks deploying these capabilities have documented double-digit productivity gains while reconciling legacy infrastructure with cloud workloads. Yet governance hurdles remain; organisations are drafting AI-risk frameworks so that autonomous test execution can proceed under reliable human oversight.
Shift to cloud-native architectures and micro-services
Re-platforming toward micro-services boosts agility but multiplies integration points that must be validated continuously. Test design now spans container orchestration, service-mesh resilience and API contract stability. Enterprises weigh these complexities against security obligations, with many regulated workloads still anchored on-premise. Digital-twin environments are gaining traction, enabling teams to simulate production-scale scenarios without incurring blanket infrastructure costs. IBM’s USD 6.4 billion purchase of HashiCorp strengthens its infrastructure-as-code coverage, signalling that platform consolidation around IaC and GitOps is central to next-generation test orchestration.
Restraints Impact Analysis*
| Restraint | (~) % Impact on CAGR Forecast | Geographic Relevance | Impact Timeline |
|---|---|---|---|
| Scarcity of end-to-end environment skills | -1.1% | North America, Europe | Short term (≤ 2 years) |
| Legacy monolithic architectures | -0.8% | North America, Europe | Medium term (2-4 years) |
| Tool-chain fragmentation and vendor lock-in | -0.6% | Global | Medium term (2-4 years) |
| Test-data-privacy regulation | -0.5% | Europe, worldwide adoption | Long term (≥ 4 years) |
| Source: Mordor Intelligence | |||
Scarcity of end-to-end test-environment orchestration skills
U.S. labour-market data show QA vacancies on course to grow 17% through 2032, potentially placing USD 162 billion of annual output at risk if roles remain unfilled. The gap is acute for specialists who can weave CI/CD pipelines, cloud infrastructure and AI-driven test automation into a cohesive fabric. To offset shortages, enterprises are procuring managed services and codeless test platforms that lower entry barriers for less technical staff. Automation eliminates repetitive tasks but raises demand for architects able to curate AI models, audit bias and safeguard pipelines against data exposure.
Legacy monolithic architectures slowing test automation
Many corporates retain core applications built for waterfall release cycles. Integrating micro-service test frameworks with these monoliths is both complex and costly. In manufacturing, 55% of senior executives admit outdated systems hamper cloud-native testing rollouts despite confidence in overall IT robustness[2]Kyndryl Holdings Inc., “2025 Global Infrastructure Study,” kyndryl.com. Financial-services providers likewise juggle mainframe constraints alongside modern digital products. Partnerships such as SAP with Tricentis showcase how purpose-built toolkits can inject automation into enterprise-resource-planning upgrades without jeopardising operational continuity.
*Our forecasts treat driver/restraint impacts as directional, not additive. The impact forecasts reflect baseline growth, mix effects, and variable interactions.
Segment Analysis
By Service Type: Managed services expand as skill shortages persist
Managed services captured 67.05% of the continuous testing market in 2025 and are forecast to grow at a 5.55% CAGR through 2031. Heightened reliance on external partners stems from limited in-house capacity to run complex, AI-enabled test estates that must meet tightening regulatory standards. Providers are repositioning, hiring AI-assurance engineers and model governors rather than traditional manual testers. Advisory and professional-services lines complement outsourcing deals, guiding clients through cultural shifts toward quality engineering and CloudOps alignment.
The managed-services model now extends beyond basic test execution to holistic quality intelligence, with providers guaranteeing release velocity, risk analytics, and energy-efficient test scheduling. Renewed demand is visible in Australia and New Zealand, where enterprises bundling cloud migration and data-modernisation workstreams are re-engaging specialists to maintain coverage across hybrid workloads. Such breadth enables incumbents to defend their share even as growth accelerates, making managed services the structural anchor of the continuous testing market.


By Interface: Mobile testing gains pace amid web primacy
Web applications remained the largest interface class with a 57.45% share in 2025, but mobile testing is on track for the highest 5.28% CAGR to 2031. Smartphone-led commerce, forecast to comprise a dominant slice of global retail sales by 2027, places rigorous performance and usability demands on distributed device landscapes. Enterprises are adopting cloud-hosted device farms, network-condition emulation, and AI-based visual validation to uphold brand consistency across thousands of handset permutations.
Web testing is hardly static; browser standards are evolving toward decentralized Web 4.0 constructs that blend blockchain and edge services, which in turn mandate new approaches to state persistence and API-layer fault tolerance. Desktop testing remains relevant for legacy business-process platforms, yet receives lower capital allocation. Overall, interface diversification is reinforcing the need for unified orchestration that can manage cross-channel test data, artefacts, and analytics inside a single pane of glass.
By Deployment Mode: Security priorities keep on-premise ahead
On-premise deployments represented 70.65% of the continuous testing market size in 2025, reflecting regulated sectors’ preference for sovereign control over source code and production-like data. Cloud solutions are expanding at a 5.86% CAGR, propelled by elastic scaling and operating-cost advantages. However, GDPR, PCI-DSS, and emerging cyber-resilience laws continue to motivate financial services and public sector buyers to keep sensitive pipelines behind the firewall.
Hybrid blueprints are consequently gaining favour: critical workloads stay on-premise while burstable or less sensitive suites run in public clouds. Upcoming Cyber Resilience Act reporting deadlines further tilt procurement toward platforms offering converged policy enforcement, encryption, and audit logging. Vendors are differentiating through zero-trust connectors and confidential-computing options that help customers straddle the compliance–cost divide without duplicating tool-chains.
By Testing Type: Security testing accelerates under new regulations
Functional testing preserved a 37.55% share of the continuous testing market in 2025. Yet, security testing will grow fastest at 5.03% CAGR because new statutes impose continuous vulnerability management on software producers. Dynamic and interactive application-security testing is penetrating earlier lifecycle stages, supported by AI engines that flag patterns suggestive of exploitable flaws.
Performance, API, and user-experience testing remain pivotal in micro-service settings where latency and contract changes can ripple across distributed environments. API validation in particular benefits from schema-learning algorithms that pinpoint breaking changes before they enter integration environments. Altogether, the testing mix is broadening: security now intersects with performance and availability metrics, compelling integrated platforms rather than siloed tools.
By Organization Size: SMEs narrow the capability gap
Large enterprises commanded 75.25% revenue in 2025, leveraging scale to orchestrate complex multi-cloud test estates. Small and medium enterprises are nonetheless the fastest movers, projected to expand 5.62% annually through 2031 as no-code and low-code platforms cut set-up time and skill thresholds. Survey evidence shows automation rates climb in lock-step with team size, yet even five-person squads now adopt cloud-native pipelines that rival the sophistication of far larger peers.
Pricing flexibility and SaaS delivery models further democratise access. Vendors bundle pay-as-you-go device hours, AI-generated test packs, and outcome-based service agreements that align cost with release cadence. This unlocks enterprise-grade assurance without proportionate headcount, enabling SMEs to challenge incumbents on product reliability and speed.
By Industry Vertical: Healthcare shows the strongest growth upside
BFSI retained a leading 27.90% share in 2025, underpinned by stringent risk-management obligations and legacy-modernisation programmes. Healthcare and life sciences are forecast for the highest 4.55% CAGR through 2031 as electronic-health-record upgrades, digital therapeutics, and connected medical devices integrate real-time data flows that must pass regulatory muster.
Manufacturing’s smart-factory push is another catalyst; 92% of plant leaders surveyed view advanced analytics and automation as keys to competitiveness, yet only a fraction have production-ready AI today. Continuous testing, therefore, becomes an operational linchpin, ensuring embedded firmware, edge gateways, and cloud dashboards interoperate securely and reliably. Retail, media, and telecommunications segments similarly invest to protect customer experience amid traffic spikes and evolving 5G architectures.
Geography Analysis
North America accounted for 26.10% revenue in 2025, benefiting from early DevOps uptake, robust cloud infrastructure, and strong venture funding into quality-engineering platforms. Generative AI adoption is widespread, with 96% of enterprises piloting or scaling AI in test generation and optimisation workflows. Despite technology leadership, the region contends with acute talent shortages, prompting higher reliance on managed-service engagements and automated toolchains. U.S. banks report double-digit productivity gains after embedding AI agents that recommend risk-based regression packs, balancing rapid feature delivery against strict regulatory demands.
Asia-Pacific is the fastest-expanding theatre, registering a projected 4.82% CAGR to 2031. China, India, and Southeast Asian nations are channelling capital into smart manufacturing and fintech ecosystems, creating greenfield opportunities for continuous quality automation. Australia and New Zealand showcase a resurgence in outsourced testing as enterprises hunt for expertise that spans SAP S/4HANA upgrades, API modernisation, and sector-specific compliance reporting. An expected 3.8 million additional manufacturing employees will be required across the region by 2033, magnifying demand for scalable, low-overhead testing frameworks.
Europe remains a heavyweight, shaped by a regulatory environment that effectively mandates continuous testing. The Cyber Resilience Act, adopted in 2024, and the Digital Operational Resilience Act, effective in 2025, oblige manufacturers and financial institutions, respectively, to demonstrate ongoing security validation. Germany, France, and the United Kingdom spearhead enterprise spending on AI-enabled compliance automation that can satisfy both CRA and DORA metrics while minimizing manual effort. Complementary legislation such as the revised EU Product Liability Directive heightens liability for software defects, encouraging continuous testing and market penetration that treats quality as a board-level responsibility rather than an engineering afterthought.

Regulatory Landscape
Continuous testing procurement is increasingly tied to auditable software-quality and secure-development requirements rather than voluntary QA maturity. The ISO/IEC/IEEE 29119 software testing standards (notably the process-focused parts, such as ISO/IEC/IEEE 29119-2:2021) provide recognized guidance for test management, dynamic testing processes, and test environment and data management, supporting traceability that regulated buyers (BFSI, healthcare, and public sector) use to evidence controls.
In the United States, Executive Order 14028 (May 2021) and follow-on NIST software supply chain security guidance pushed federal software suppliers toward documented verification practices, including automated testing evidence aligned with secure software development practices. Europe is also tightening cyber-resilience obligations, with the EU Cyber Resilience Act adopted in 2024 and enforcement milestones confirmed in 2025, including incident reporting requirements starting by September 2026 and full compliance by December 2027. This framework reinforces continuous security validation and release auditability in pipelines.
Value Chain Analysis
The continuous testing value chain begins with tool and platform vendors supplying functional, API, performance, and security testing capabilities, then extends through CI/CD and cloud infrastructure layers (build systems, container platforms, environment provisioning, and device farms) that host execution at scale. Integrators and managed service providers sit between vendors and enterprise buyers, packaging implementation, pipeline integration, test-data management, and governance into outcome-based delivery, a fit reinforced by skill scarcity in end-to-end test-environment orchestration.
Downstream, large enterprises in BFSI, telecom, media and entertainment, and manufacturing operationalize these components into quality-engineering operating models that couple test automation with observability and audit logging. Recent ecosystem proof points include Red Hat publishing a 5G core standalone continuous testing framework built around OpenShift Pipelines (April 2026), and LTM describing an end-to-end quality engineering transformation for a global media enterprise that integrated continuous testing and GenAI-led defect categorization (June 2026). Key friction points remain tool-chain fragmentation, multi-vendor interoperability validation in cloud-native architectures, and constraints on production-like test data under privacy rules, which continue to raise the demand for integrated orchestration and specialized services.
Competitive Landscape
The continuous testing market remains moderately fragmented, with a blend of platform giants, specialist vendors, and AI-native start-ups. IBM’s USD 6.4 billion acquisition of HashiCorp signals an integrated-platform thesis aimed at uniting infrastructure-as-code, security policy, and test orchestration under one roof. Tricentis represents the specialised path, having raised USD 1.33 billion at a USD 4.5 billion valuation to accelerate AI-powered quality intelligence offerings.
Three strategic archetypes dominate. First, platform consolidation by large software houses chasing end-to-end lifecycle control. Second, AI-native disruptors are embedding generative models for intelligent test creation and prioritisation. Third, vertical-focused players delivering deep domain packs for sectors such as regulated financial services or medical devices. Perforce, for instance, extended its codeless Selenium capability via the acquisition of TestCraft, bolstering appeal to teams that favour minimal-code authoring.
Competition is intensifying around differentiators such as model-explainability dashboards, zero-trust architecture connectors, and sustainability metrics reporting. Successful vendors are those able to fuse test coverage analytics with actionable remediation guidance, thereby shrinking mean-time-to-repair while satisfying auditors. As AI adoption climbs, buyers increasingly assess vendors on governance frameworks, bias safeguards, and data-privacy postures rather than raw automation counts.
Continuous Testing Industry Leaders
Mindtree Limited
EPAM Systems Inc.
Broadcom Inc. (CA Technology, Inc.)
IBM Corporation
HCL Technologies Ltd
- *Disclaimer: Major Players sorted in no particular order

Market Opportunities and Future Outlook
Compliance-driven security validation creates whitespace for platforms that unify functional and security testing with policy evidence, audit trails, and controlled handling of sensitive test data, particularly in Europe where Cyber Resilience Act timelines include incident reporting from September 2026 and full compliance by December 2027. Financial services demand is also supported by DORA effective in 2025. Buyers that keep critical workloads on-premise (70.65% of deployments in 2025) still require hybrid execution models, creating room for vendors and managed service providers to deliver zero-trust connectors, encrypted artifact handling, and governance features that reduce duplication across on-premise and cloud suites.
Agent-assisted automation is reshaping how teams generate and maintain tests, but enterprise rollouts continue to require deterministic gate-keeping, explainability, and human oversight. This aligns with managed services, which already lead the market (67.05% share in 2025). Recent vendor activity points to active product-market iteration around autonomous workflows and pipeline-native delivery, including Tricentis highlighting agentic test automation capabilities (June 2025), Parasoft releasing autonomous testing workflows for CI/CD pipelines (November 2025), and Perforce introducing an agentic AI approach aimed at reducing script maintenance (July 2025). The resulting opportunity is strongest in consolidating fragmented toolchains and standardizing test execution across web (57.45% share in 2025) and faster-growing mobile testing programs, while embedding governance suitable for regulated releases.
Recent Industry Developments
- June 2026: LTM detailed an end-to-end quality engineering transformation for a global media and entertainment enterprise, integrating continuous testing with GenAI-led defect categorization across DevOps-aligned workflows. The case highlights how large digital content providers are standardizing pipeline-driven validation across complex streaming supply chains, increasing demand for integrated tooling and services that can manage environments and quality analytics at scale.
- June 2025: Tricentis highlighted agentic test automation capabilities for autonomous testing workflows within CI/CD pipelines, signaling evolution toward pipeline-native delivery and governance that satisfies regulated buyers. The move included a focus on automated script maintenance, faster regression cycles, and stronger audit-trail integration.
- November 2024: Tricentis unveiled enhanced cloud-based capabilities for its Tosca platform for end-to-end test automation. The update reinforces the market shift toward cloud-delivered test automation that supports distributed teams and elastic execution, while still needing integration patterns that satisfy regulated buyers with hybrid and on-premise constraints.


Research Methodology Framework and Report Scope
Market Definition and Coverage
For this study, the continuous testing market includes software tools and related services that enable automated, repeated testing as part of CI/CD workflows, so defects are found early and releases stay stable across environments.
Scope exclusions: We exclude purely manual QA staffing engagements and generic test utilities that are not integrated into a continuous delivery pipeline.
Segmentation Overview
- By Service Type
- Managed Services
- Professional Services
- By Interface
- Web
- Desktop
- Mobile
- By Deployment Mode
- On-premise
- Cloud
- By Testing Type
- Functional Testing
- Performance and Load Testing
- Security Testing
- API Testing
- UI/UX Testing
- By Organization Size
- Large Enterprises
- Small and Medium Enterprises
- By Industry Vertical
- BFSI
- IT and Telecom
- Retail and eCommerce
- Healthcare and Life Sciences
- Manufacturing
- Media and Entertainment
- Others
- By Geography
- North America
- United States
- Canada
- Mexico
- South America
- Brazil
- Argentina
- Rest of South America
- Europe
- Germany
- United Kingdom
- France
- Italy
- Spain
- Russia
- Rest of Europe
- Asia-Pacific
- China
- India
- Japan
- South Korea
- Australia
- Rest of Asia-Pacific
- Middle East and Africa
- Middle East
- Saudi Arabia
- United Arab Emirates
- Turkey
- Rest of Middle East
- Africa
- South Africa
- Nigeria
- Rest of Africa
- Middle East
- North America
Data Sources, Market Sizing, and Validation
Desk Research
Desk work started with public, non-paywalled references that help anchor software and cloud adoption, delivery velocity, and testing demand signals. Sources used include items such as U.S. Bureau of Labor Statistics for software workforce trends, OECD ICT indicators, World Bank digital adoption datasets, NIST publications on software assurance and security practices, and standards references from ISO/IEC that define testing and quality concepts.
We also reviewed provider websites, product documentation, public case studies, and investor materials to map typical pricing logic and packaging, followed by reputed press coverage to spot major launches and buying shifts. When needed, we used paid subscription data for company financials and news, plus a patent database to understand how automation and AI testing claims evolved over time. These desk sources are illustrative and not exhaustive, since we used many other public references for cross-checks and clarification.
Primary Interviews and Surveys
Primary interviews and short surveys were used to confirm what buyers actually purchase under continuous testing, and to clarify how tools, platforms, and managed services are bundled in live contracts. We spoke with delivery leaders, testing managers, and solution owners across APAC, EMEA, and the Americas, so our assumptions on adoption rates, cloud mix, and spend per application could be stress-tested against operating constraints described by practitioners.
Distribution of primary research fieldwork respondents
| Company type | Respondent position | Region |
|---|---|---|
| Top tier: 27% | CXOs: 13% | APAC: 46% |
| Mid tier: 59% | Functional/Unit leaders: 37% | EMEA: 33% |
| Smaller Players: 14% | Managers: 50% | Americas: 21% |
Market-Sizing & Forecasting
Sizing starts with a top-down build where software delivery activity, CI/CD penetration, and testing automation intensity are used to reconstruct a realistic demand pool for continuous testing spend by region. This is then corroborated with selective bottom-up approximations, such as sampled vendor price bands, typical seat and usage tiers, and service engagement values shared by practitioners, which helps us adjust for over-counting and under-counting.
Key inputs that shaped the model include DevOps and CI/CD adoption levels, the share of testing shifted left into pipelines, cloud versus on-premise deployment mix, the ratio of managed services to professional services, and the average number of applications and releases per team that drive test execution frequency. Because these drivers move together, we used a multivariate regression approach for the forecast, with scenario checks tied to enterprise software spending cycles and automation maturity. When a segment lacked clean disclosure, we filled gaps using proxy indicators like regional software employment growth and cloud workload expansion, then re-tested the implied spend per enterprise with interview feedback.
Data Validation & Update Cycle
Validation is handled through repeated variance checks across regions, service mixes, and implied spend per buyer, then the model outputs are compared with independent signals like software investment trends and cloud adoption indicators. Outliers are investigated, and assumptions are reworked when the implied pricing or adoption patterns do not match what interviewees report from live deployments.
Before sign-off, the work goes through multi-step analyst review so definitions, math, and year alignment stay consistent across the workbook and narrative. The report is refreshed annually, and interim updates are triggered when material events occur, such as major platform shifts or large pricing changes. Right before delivery, we do a final review pass so the published numbers reflect the latest available information.
Mordor Intelligence's Continuous Testing Market Sizing Compared With Other Published Estimates
Published market sizes for continuous testing can vary a lot, even when they sound like they measure the same thing. The main reasons are usually the year chosen as the base, what is counted as continuous testing versus broader software testing, and how services revenue is treated.
The benchmark table shows a tighter 2026 base that stays closer to pipeline integrated tooling and delivery-linked services, and in Mordor Intelligence's model the value is counted only when testing is automated and continuously executed as part of CI/CD, rather than including wider manual QA spend or adjacent testing categories. Other estimates also differ on whether they use aggressive adoption curves, how they project price changes for platforms and managed services, and whether currency conversion timing is kept consistent across regions.
Benchmark comparison
| Source | Market Size | Gaps in Research Methodology |
|---|---|---|
| Mordor Intelligence | USD 2.54 B (2026) | |
| Global Consultancy A | USD 3.60 B (2025) | Uses an earlier base year and a broader revenue boundary that can include general software testing spend and wider service lines, which tends to inflate totals when mapped to continuous testing. |
| Industry Publisher B | USD 2.23 B (2023) | Anchors on an older base year with faster growth assumptions and a longer horizon, and the scope can mix continuous testing platforms with adjacent QA categories, making year-to-year comparability weaker. |
Across the three figures, most of the spread is explained by scope boundaries and base-year alignment rather than a single math difference. By tying the size build to observable delivery activity, service mix, and deployment choices, we keep the total traceable to practical inputs that can be re-checked and updated as market conditions change.


Key Questions Answered in the Report
What is the continuous testing market size in 2026?
The market is valued at USD 2.54 billion in 2026.
What CAGR is forecast for the continuous testing market to 2031?
Industry revenue is projected to rise at a 4.05% CAGR during the forecast period (2026-2031).
Which service type holds the largest share of the continuous testing market?
Managed services lead with 67.05% revenue share as of 2025.
Why is security testing growing faster than functional testing?
New regulations such as the EU Cyber Resilience Act and DORA are boosting demand, driving security testing at a 5.03% CAGR versus functional testing’s slower pace.
Which region is expected to post the fastest growth in continuous testing adoption?
Asia-Pacific is projected to expand at a 4.82% CAGR through 2031, outpacing other regions.
How are generative AI tools affecting continuous testing productivity?
Enterprises using AI-generated test cases have reported productivity gains of about 20%, especially in highly regulated sectors like banking.
Page last updated on:


