Tanzania United Republic Container Glass Market Size and Share
Market Overview
| Study Period | 2020 - 2031 |
|---|---|
| Base Year For Estimation | 2025 |
| Forecast Data Period | 2026 - 2031 |
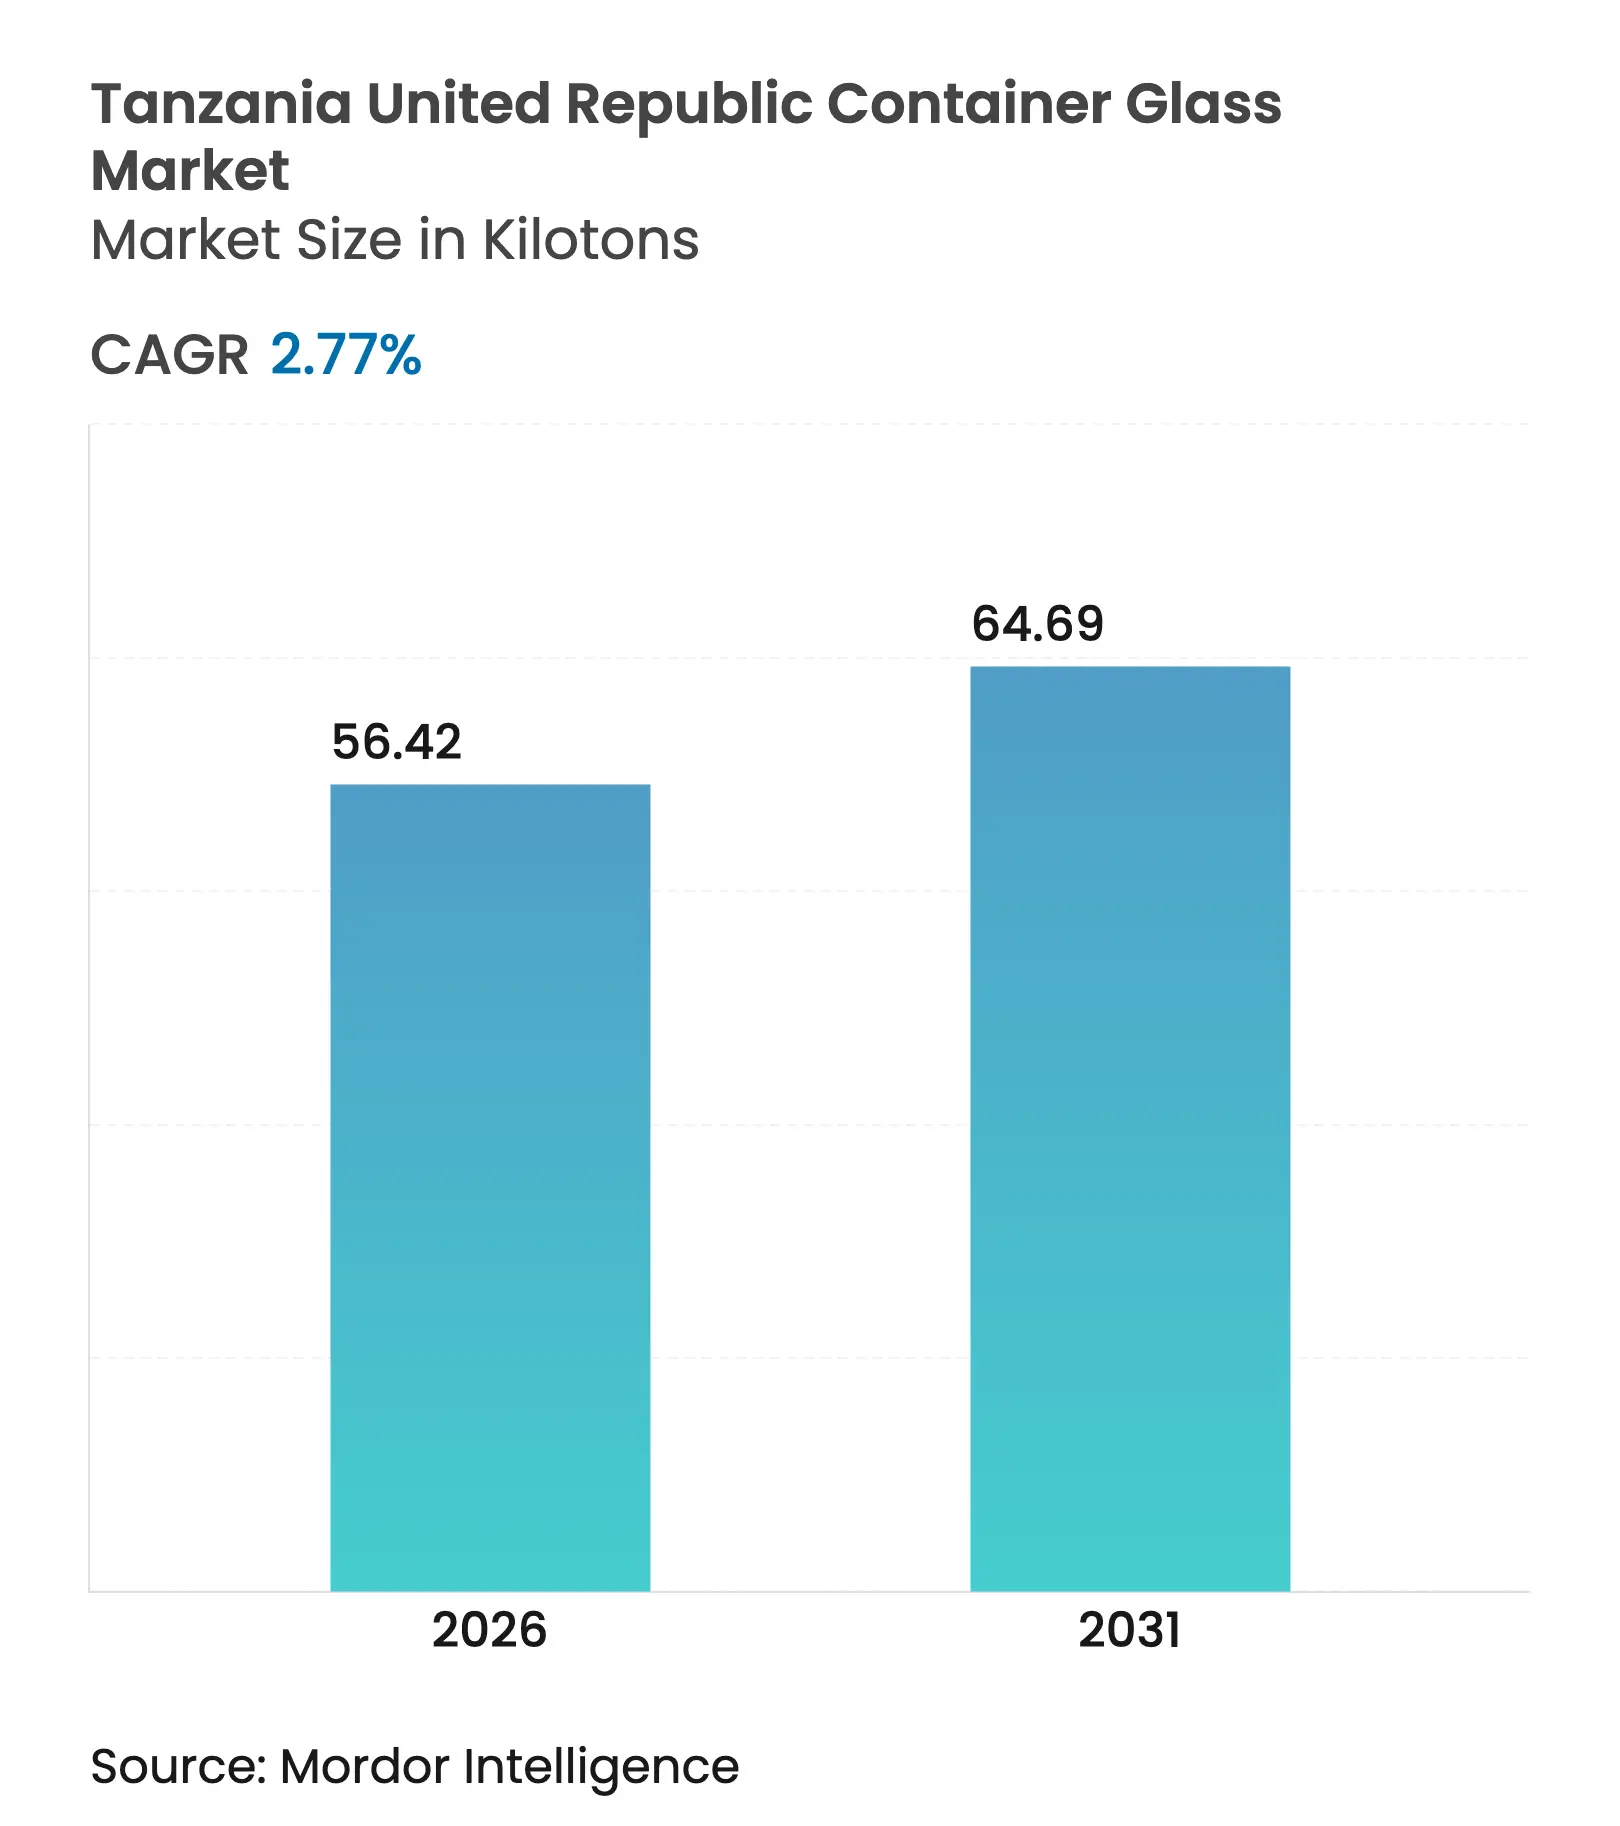
| Market Volume (2026) | 56.42 kilotons |
| Market Volume (2031) | 64.69 kilotons |
| CAGR | 2.77 % |
| Market Concentration | High |
Major Players *Disclaimer: Major Players sorted in no particular order. Image © Mordor Intelligence. Reuse requires attribution under CC BY 4.0. |
Tanzania United Republic Container Glass Market Analysis by Mordor Intelligence
Tanzania container glass market size in 2026 is estimated at 56.42 kilotons, growing from 2025 value of 54.90 kilotons with 2031 projections showing 64.69 kilotons, growing at 2.77% CAGR over 2026-2031. Moderate expansion is underpinned by the 35% Common External Tariff on imported glass and a 10% Industrial Development Levy, both introduced in the 2025/26 budget to protect domestic production.[1]Tanzania Investment Centre, “Access to Markets,” tic.go.tz Duty-free access to East African Community (EAC) members since 2010 enlarges the addressable export base of the Tanzania container glass market to more than 450 million consumers. Oligopolistic supply, with Kioo Limited, Milly Glass Works and Consol Glass Kenya the only regional producers, allows pricing power yet heightens exposure to supply shocks. Sustained beverage demand from European Union-affiliated brewers that hold more than 90% of Tanzania’s beer market secures a large, stable offtake for the Tanzania container glass market.
Key Report Takeaways
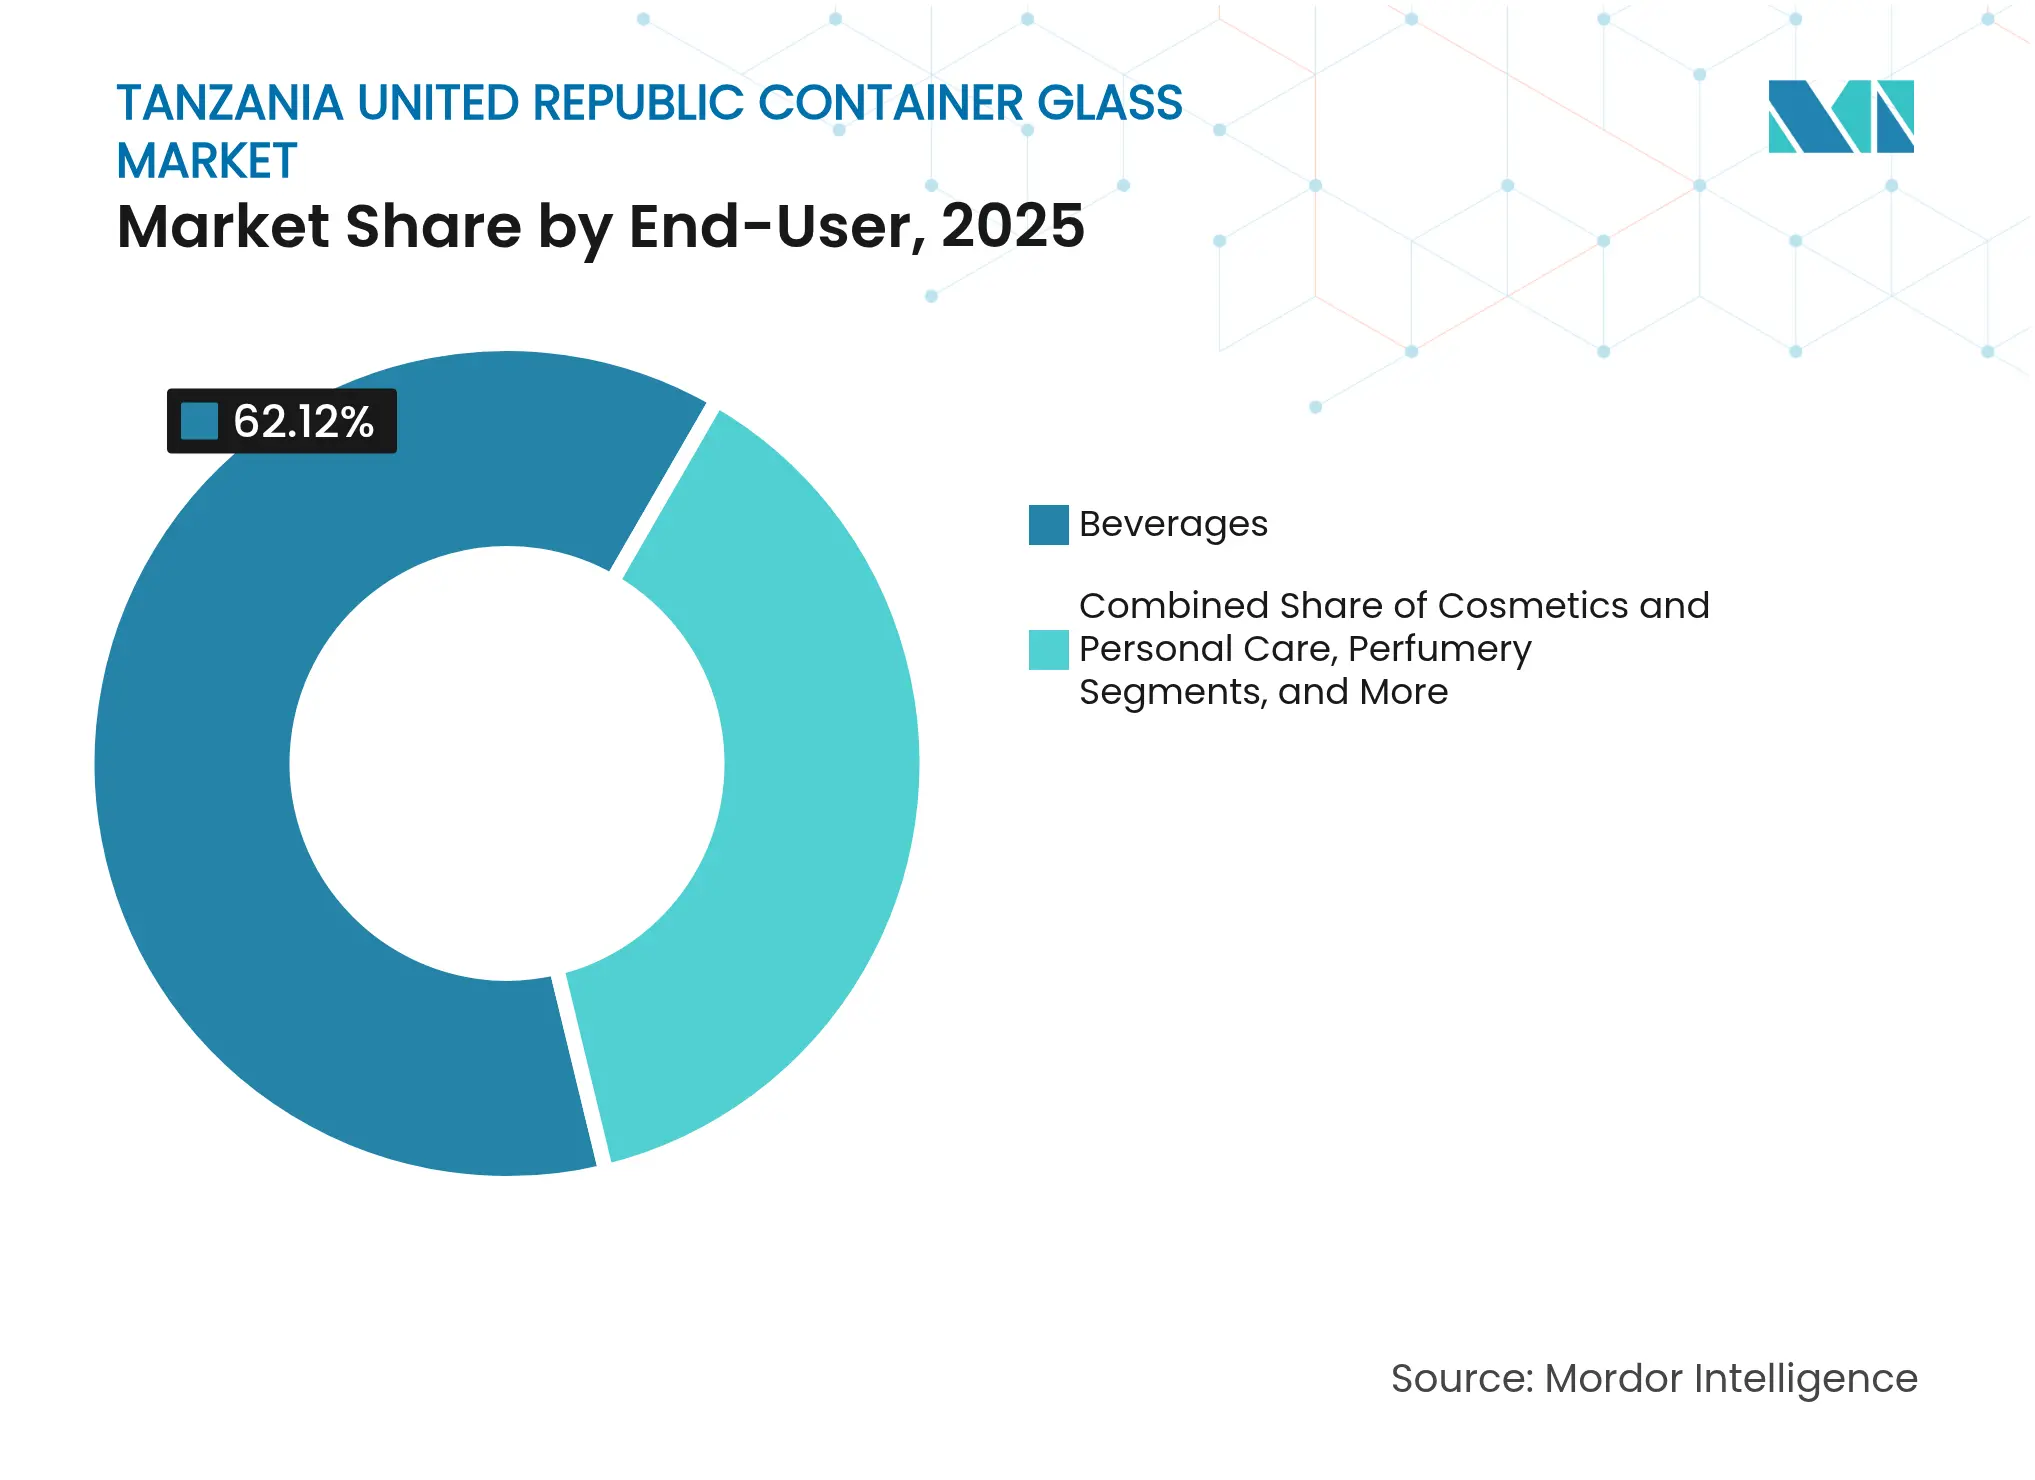
- By end-user, beverages captured 62.12% of the Tanzania United Republic container glass market share in 2025.
- By color, the Tanzania United Republic container glass market for amber glass is projected to grow at a 3.43% CAGR between 2026-2031.
Note: Market size and forecast figures in this report are generated using Mordor Intelligence's proprietary estimation framework, updated with the latest available data and insights as of 2026.
Tanzania United Republic Container Glass Market Trends and Insights
Drivers Impact Analysis
| Driver | (~) % Impact on CAGR Forecast | Geographic Relevance | Impact Timeline | |||
|---|---|---|---|---|---|---|
Rising consumption of alcoholic beverages Rising consumption of alcoholic beverages | +0.8% | National, with concentration in Dar es Salaam, Arusha, Mwanza | Medium term (2-4 years) | (~) % Impact on CAGR Forecast:+0.8% | Geographic Relevance:National, with concentration in Dar es Salaam, Arusha, Mwanza | Impact Timeline:Medium term (2-4 years) |
Expansion of non-alcoholic beverage packaging Expansion of non-alcoholic beverage packaging | +0.6% | National, driven by urban centers and export corridors | Short term (≤ 2 years) | |||
Sustainability push for recyclable packaging Sustainability push for recyclable packaging | +0.5% | National, with EAC regional spillover effects | Long term (≥ 4 years) | |||
Local pharma manufacturing expansion Local pharma manufacturing expansion | +0.4% | National, concentrated in industrial zones | Medium term (2-4 years) | |||
Premium packaging demand from food exporters Premium packaging demand from food exporters | +0.3% | Export-oriented regions, coastal processing hubs | Medium term (2-4 years) | |||
Emerging cannabis-infused beverages packaging demand Emerging cannabis-infused beverages packaging demand | +0.2% | Limited regional pilot markets | Long term (≥ 4 years) | |||
| Source: Mordor Intelligence | ||||||
Rising consumption of alcoholic beverages
Beer, wine and spirits volumes continue to climb as disposable incomes rise, propelling glass bottle demand for premium positioning in the Tanzania container glass market. European Union brewers Tanzania Breweries Ltd. and Serengeti Breweries anchor procurement via long-term contracts, stabilizing furnace utilization rates. Export strategies to neighboring EAC and SADC states further entrench glass, which signals product quality to regional consumers. Government excise structures favor locally bottled products, deepening the moat for domestic converters. Historical manufacturing exports passing USD 1.4 billion in 2015 illustrate the industrial base capable of absorbing higher furnace output.
Expansion of non-alcoholic beverage packaging
Rapid population growth of 2.8% yearly among 62 million people is swelling demand for juices, carbonates and flavored milk packed in glass for durability and shelf appeal. The USD 800 million East African soft-drink arena provides a large regional pull, particularly for brands positioning on natural or “plastic-free” cues. Port upgrades under the Dar es Salaam Maritime Gateway Project reduce turnaround times, making outbound glass cargoes more competitive. New road and rail pipelines valued at USD 19 billion cut transit costs from furnace to port, lifting the export readiness of the Tanzania container glass market. Regional bans on single-use plastics in Kenya and Uganda accelerate brand owner pivots toward returnable glass bottles.
Sustainability push for recyclable packaging
Municipal solid-waste collection improvements, such as Moshi’s jump from 51% to 90% coverage, elevate post-consumer glass recovery rates.[2]World Bank Group, “Behavior Change in Solid Waste Management,” worldbank.org Circular-economy targets adopted by the African Union require 50% urban waste recycling by 2023, cementing glass as a policy-aligned substrate. VAT exemptions on solar equipment entice furnaces to install rooftop arrays, cutting Scope 2 emissions and energy bills simultaneously. Local soft-drink bottlers that had exited deposit-return systems now face public-relations pressure to re-embrace refillable glass, supporting the mid-term growth of the Tanzania container glass market. Informal sector collectors in South Africa already attain 80% packaging recovery, presenting a model for Tanzania’s budding buy-back centers.
Local pharma manufacturing expansion
Tanzania’s USD 496 million pharmaceutical sector still imports up to 90% of drugs, but the government targets 50% local production for hospital supply. Seven licensed drug makers cite packaging costs of USD 0.15 per unit almost double India’s level creating an opening for domestic vial suppliers to undercut imports. Gas-to-power plants at Mnazi Bay and Kinyerezi boost grid reliability, mitigating the furnace outages that previously undermined vial quality. Duty-free EAC access permits Tanzanian syringe and vial exporters to reach 450 million consumers without border tariffs, magnifying scale opportunities. Industrial incentives, such as VAT-free polymer feedstocks, further narrow the landed-cost gap versus imported pharma glass.
Restraints Impact Analysis
| Restraint | (~) % Impact on CAGR Forecast | Geographic Relevance | Impact Timeline | |||
|---|---|---|---|---|---|---|
High energy costs High energy costs | -0.7% | National, particularly industrial zones | Short term (≤ 2 years) | (~) % Impact on CAGR Forecast:-0.7% | Geographic Relevance:National, particularly industrial zones | Impact Timeline:Short term (≤ 2 years) |
Competition from PET and metal cans Competition from PET and metal cans | -0.5% | National, with urban concentration | Medium term (2-4 years) | |||
Limited high-quality silica sand Limited high-quality silica sand | -0.3% | National, regional sourcing constraints | Long term (≥ 4 years) | |||
Supply chain disruptions due to geopolitical instability Supply chain disruptions due to geopolitical instability | -0.4% | Regional trade corridors, import dependencies | Medium term (2-4 years) | |||
| Source: Mordor Intelligence | ||||||
High energy costs
Average industrial power prices of USD 82.10 per MWh in 2023 remain a drag on furnace economics in the Tanzania container glass market. Levy increases on fuel and a Railway Development Levy jump to 2% have pushed inbound raw-material costs higher. Although TREEP added 16,000 businesses to the grid, capital recovery for self-generation remains lengthy, preserving a short-term cost headwind. Solar VAT exemptions are beginning to seed rooftop projects, but payback periods of five to six years limit rapid adoption. Consequently, smaller converters hesitate to commit to furnace rebuilds that would lift capacity for the Tanzania container glass market.
Competition from PET and metal cans
PET dominates carbonated-soft-drink packaging because it is 30-40% cheaper to freight into inland regions, eroding glass share in mass-market SKUs. Subsidized Egyptian glass imports often priced below variable cost further squeeze local producers, forcing tactical price freezes to retain share. Aluminum cans are winning craft-beer launches due to portability and lower breakage risk, diverting potential tonnage away from the Tanzania container glass market. However, tighter EAC plastic-waste directives could halt PET’s further incursion, offering a medium-term reprieve for glass. Ongoing rail and port upgrades will gradually narrow logistics cost gaps, improving glass’s value proposition for regional export flows.
Segment Analysis
By End-User: Beverage demand anchors volumes
Beverages accounted for 62.12% of the Tanzania container glass market share in 2025, with beer, spirits and flavored alcoholic beverages absorbing the bulk of unit output. Import-substitution policies reward local filling, so brewers contract long-term with Kioo Limited to mitigate supply shocks and currency risk. Carbonated-soft-drink and juice brands are experimenting with short-run returnable glass bottles in premium urban outlets, raising the non-alcoholic contribution to segment revenue. Rising disposable incomes following Tanzania’s upgrade to lower-middle-income status in 2020 underpin a positive elasticity for premium glass formats.
Cosmetics and personal care is the fastest-growing slice of the Tanzania container glass market, projected at a 3.72% CAGR to 2031 on the back of urban middle-class expansion. Global fragrance majors have begun assigning production runs to East African contract fillers, spurring demand for small glass flacons that local furnaces can reasonably supply. Food uses ranging from jams to pickles benefit from zero-tariff EAC trade, letting exporters ship shelf-stable products in glass jars that uphold brand integrity under tropical conditions. Pharmaceutical bottle demand trails beverages in sheer volume but offers double-digit margins, incentivizing furnace line conversions toward narrow-neck pharma ware.
Note: Segment shares of all individual segments available upon report purchase
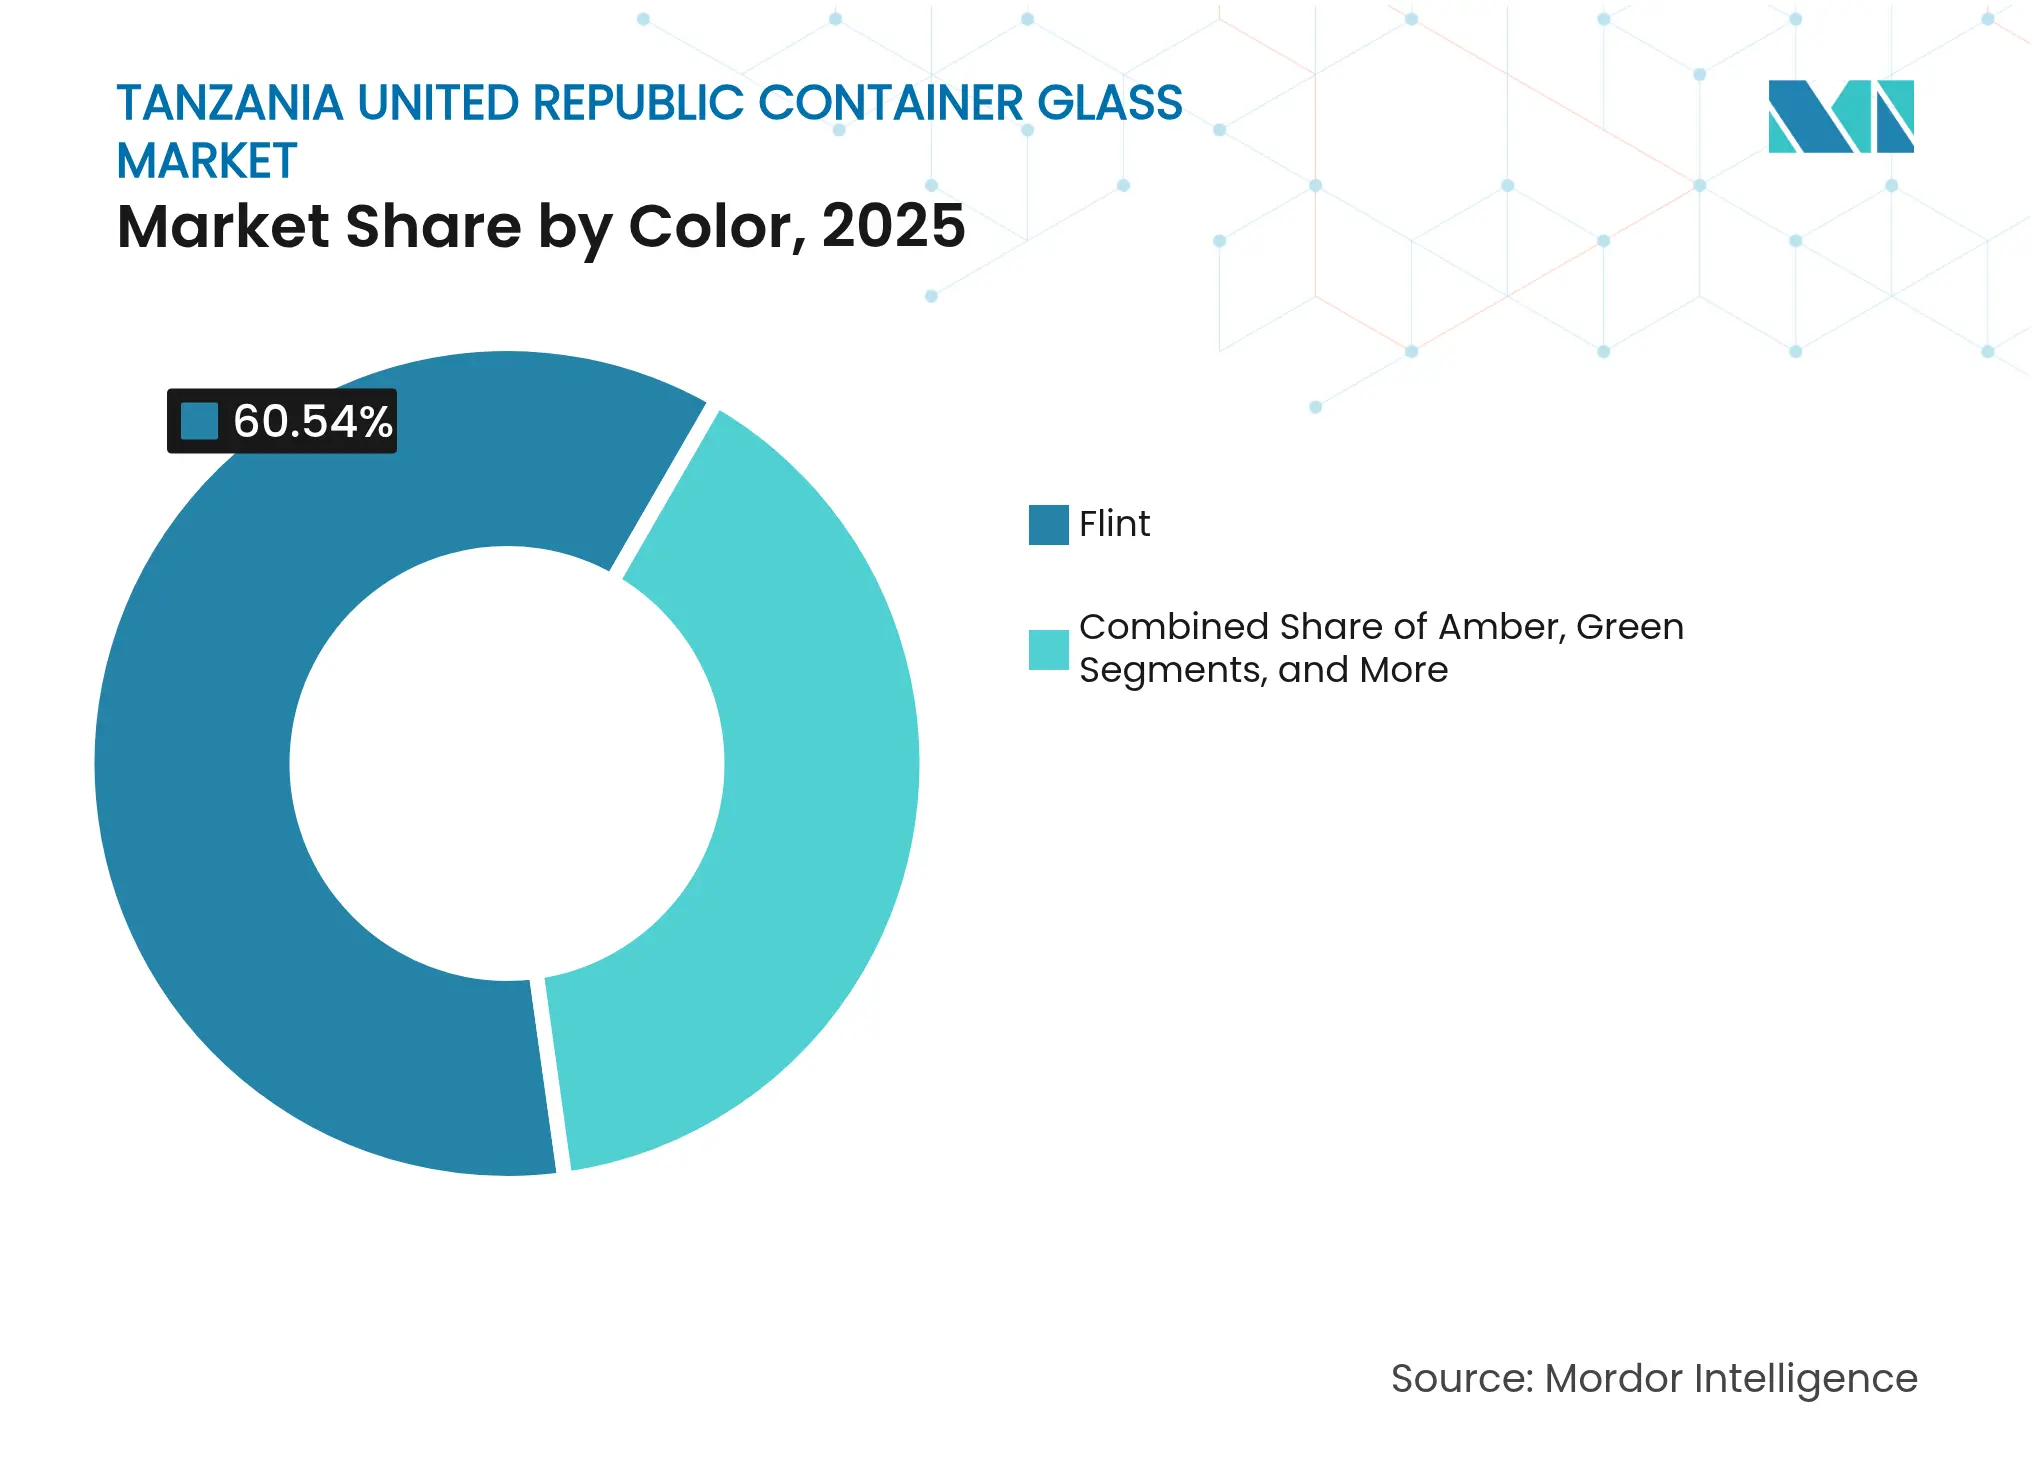
By Color: Flint dominates, amber accelerates
Flint captured 60.54% of the Tanzania container glass market in 2025 due to its versatility across beer, soda and food jars. Transparent bottles showcase beverage clarity, vital for lighter lagers and clear spirits that dominate Tanzanian consumption habits. Investment amortization for flint furnaces is largely complete, allowing producers to exploit lower depreciation charges in pricing.
Amber glass is forecast to expand at a 3.43% CAGR, riding pharmaceutical and premium food trends that value ultraviolet protection. As hospital-drug localization rises toward a 50% target, injectable vials and syrup bottles will require amber cullet streams, stimulating color-conversion capital projects by Kioo Limited. Green and specialty colors remain niche, largely tied to imported wine and craft-beer lines, but they deliver higher price points that can partially cushion energy inflation. Other colors such as cobalt blue appear in limited cosmetic SKUs, yet they reinforce the premiumization narrative that keeps the Tanzania container glass market oriented toward value rather than only tonnage.
Note: Segment shares of all individual segments available upon report purchase
Geography Analysis
Tanzania is the linchpin of regional supply, hosting the only large-scale furnace south of the equator and north of South Africa, which secures the operational heartbeat of the Tanzania container glass market. Membership in both the EAC and SADC creates tariff-free or preferential access to 26 countries extending from Kenya to South Africa, multiplying the addressable market size for local producers. Strategic logistics upgrades especially the Dar es Salaam Maritime Gateway Project shorten berth waiting times, lowering demurrage that once offset glass’s cost competitiveness.
Protectionist levers introduced in the 2025/26 budget, chiefly the 35% CET and a 10% Industrial Development Levy, buttress domestic furnaces against low-priced imports, thereby stabilizing capacity utilization above 80% despite sluggish domestic demand growth. Abundant limestone and coal reserves within Tanzania’s borders provide critical furnace inputs, but the highest-grade silica sand still arrives by rail from Sudan and Ethiopia, complicating raw-material security. Gas-fired turbines at Kinyerezi now feed more consistent baseload power into industrial zones, trimming unplanned downtime that previously plagued glass-forming lines.
The country’s central location recasts it as a consolidation hub for finished bottles destined for land-locked EAC neighbors such as Rwanda and Burundi, an edge magnified by new standard-gauge rail connections that cut transit times by days. Duty-free access to the United States under AGOA and to Europe under the Everything But Arms initiative furnishes brand-owner corridors for value-added exports, positioning the Tanzania container glass market to ride the premiumization wave in food and beverage categories aimed at Western consumers. However, subsidized Egyptian shipments remain a pricing wildcard, forcing Tanzanian makers to move up the value chain or risk margin erosion.

Competitive Landscape
Market Concentration
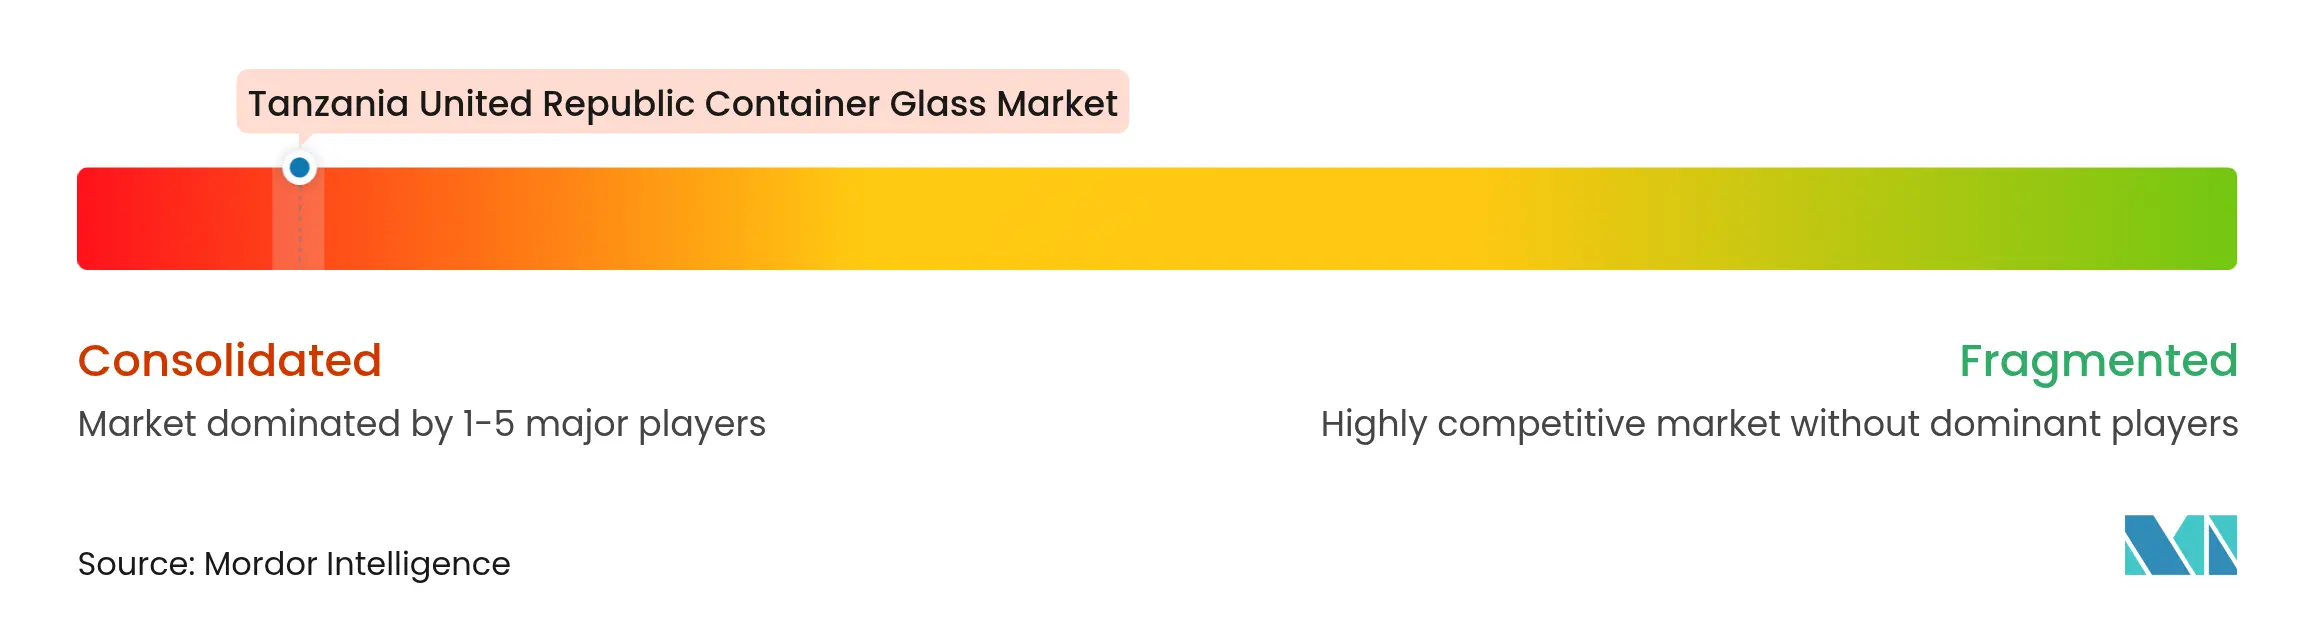
The Tanzania container glass market is moderately concentrated, with the top three East African furnaces collectively controlling far above 70% of regional capacity, conferring meaningful but not absolute pricing power. Kioo Limited, the largest local plant, leverages vertical supply agreements with EU-owned brewers to hedge against PET incursions and to stabilize glass-cullet collection loops. Milly Glass Works in coastal Kenya and Consol Glass Kenya round out the triopoly, often coordinating informal production schedules to smooth inventory flows across seasonal beer peaks and soft-drink troughs.
Strategic investment now tilts toward energy efficiency retrofits and cullet-ratio hikes, which can trim furnace energy demand by 2–3 MWh per ton of output. The VAT-free solar regime catalyzes rooftop installations that can offset up to 20% of a plant’s daytime load, a material saving when power accounts for one-third of cost of goods sold. The Madhvani Group’s parallel bid through Independent Sugar Corporation to acquire Hindusthan National Glass & Industries in India underlines its ambition to expand beyond East Africa, potentially funneling Indian technological know-how back to the Tanzania container glass market.[3]Glass International, “AGI Greenpac acquisition setback,” glass-international.com
White-space niches lie in pharmaceutical, cosmetics and artisanal food packaging, segments less exposed to PET substitution and more amenable to color and shape customization. Early-stage pilots in cannabis-infused beverage packaging, while small, showcase the agility of regional converters to meet evolving demand vectors. Nevertheless, capital entry barriers remain high: a greenfield furnace requires at least USD 100 million, plus specialized skills scarce in the local labor pool, tempering the pace at which new competitors can contest incumbents.
Tanzania United Republic Container Glass Industry Leaders

*Disclaimer: Major Players sorted in no particular order
Recent Industry Developments
- March 2025: World Bank launched the USD 300 million ASCENT TZ energy-access program, promising lower industrial tariffs in coming years.
- January 2025: VAT withholding of 3% on goods and 6% on services from designated agents took effect, altering working-capital cycles for glass converters.
- July 2024: Finance Act 2024 introduced a 10% Industrial Development Levy on imported glass while exempting EAC origin goods, reinforcing intra-bloc supply chains.
- July 2024: Puma Energy widened LPG and solar offerings under the National Clean Cooking Strategy, signalling an economy-wide energy transition that could ease glass-sector fuel constraints.
Table of Contents for Tanzania United Republic Container Glass Industry Report
1. INTRODUCTION
- 1.1Study Assumptions and Market Definition
- 1.2Scope of the Study
2. RESEARCH METHODOLOGY
3. EXECUTIVE SUMMARY
4. MARKET LANDSCAPE
- 4.1Market Overview
- 4.2Market Drivers
- 4.2.1Rising consumption of alcoholic beverages
- 4.2.2Expansion of non-alcoholic beverage packaging
- 4.2.3Sustainability push for recyclable packaging
- 4.2.4Local pharma manufacturing expansion
- 4.2.5Premium packaging demand from food exporters
- 4.2.6Emerging cannabis-infused beverages packaging demand
- 4.3Market Restraints
- 4.3.1High energy costs
- 4.3.2Competition from PET and metal cans
- 4.3.3Limited high-quality silica sand
- 4.3.4Supply chain disruptions due to geopolitical instability
- 4.4PESTEL Analysis
- 4.5Industry Supply-Chain Analysis
- 4.6Container Glass Furnace Capacity and Locations in Tanzania United Republic
- 4.6.1Plant Locations and Year of Commencement
- 4.6.2Production Capacities
- 4.6.3Types of Furnaces
- 4.6.4Color of Glass Produced
- 4.7Export-Import Data of Container Glass - Covering Key Import and Export Destinations
- 4.7.1Import Volume and Value, 2021-2024
- 4.7.2Export Volume and Value, 2021-2024
- 4.8Porter’s Five Forces Analysis
- 4.8.1Threat of New Entrants
- 4.8.2Bargaining Power of Suppliers
- 4.8.3Bargaining Power of Buyers
- 4.8.4Threat of Substitutes
- 4.8.5Competitive Rivalry
- 4.9Raw Material Analysis
- 4.10Recycling Trends for Glass Packaging
- 4.11Demand vs Supply Analysis for Glass Packaging
5. MARKET SIZE AND GROWTH FORECASTS (VOLUME)
- 5.1By End-user
- 5.1.1Beverages
- 5.1.1.1Alcoholic
- 5.1.1.1.1Beer
- 5.1.1.1.2Wine
- 5.1.1.1.3Spirits
- 5.1.1.1.4Other Alcoholic Beverages (Cider and Other Fermented Drinks)
- 5.1.1.2Non-Alcoholic
- 5.1.1.2.1Juices
- 5.1.1.2.2Carbonated Drinks (CSDs)
- 5.1.1.2.3Dairy Product Based Drinks
- 5.1.1.2.4Other Non-Alcoholic Beverages
- 5.1.2Food (Jam, Jelly, Marmalades, Honey, Sausages and Condiments, Oil, Pickles)
- 5.1.3Cosmetics and Personal Care
- 5.1.4Pharmaceuticals (excluding Vials and Ampoules)
- 5.1.5Perfumery
- 5.2By Color
- 5.2.1Green
- 5.2.2Amber
- 5.2.3Flint
- 5.2.4Other Colors
6. COMPETITIVE LANDSCAPE
- 6.1Market Concentration
- 6.2Strategic Moves and Developments
- 6.3Company Market Share Analysis, (Based on Latest Production Capacity)
- 6.4Company Profiles (includes Global level Overview, Market level overview, Core Segments, Financials as available, Strategic Information, Market Rank/Share for key companies, Products and Services, and Recent Developments)
- 6.4.1Kioo Limited
- 6.4.2Feemio Group Co., Ltd.
- 6.4.3Isanti Glass
- 6.4.4Ardagh Group S.A.
- 6.4.5Pragati Glass Pvt. Ltd.
7. MARKET OPPORTUNITIES AND FUTURE OUTLOOK
- 7.1White-space and Unmet-Need Assessment
Tanzania United Republic Container Glass Market Report Scope
Container glass is used in the alcoholic and non-alcoholic beverage industries due to its ability to maintain chemical inertness, sterility, and non-permeability. Glass packaging is valued for its unique properties, including its transparency, inertness, and ability to preserve the quality and integrity of its contents. It is often chosen for products where purity, safety, and environmental sustainability are paramount concerns.
The Tanzania United Republic container glass market is segmented by end-user vertical (beverages [alcoholic beverages (beer, wine, spirits, and other alcoholic beverages {cider and other fermented drinks}), non-alcoholic beverages (juices, carbonated drinks (CSDs), dairy product-based drinks, other non-alcoholic beverages)], food [jam, jelly, marmalades, honey, sausages and condiments, oil, pickles], cosmetics and personal care, pharmaceuticals (excluding vials and ampoules), and perfumery), by color (green, amber, flint and other colors). The report offers market forecasts and size in volume (kilotons) for all the above segments.