Oman Container Glass Market Size and Share
Market Overview
| Study Period | 2020 - 2031 |
|---|---|
| Forecast Data Period | 2026 - 2031 |
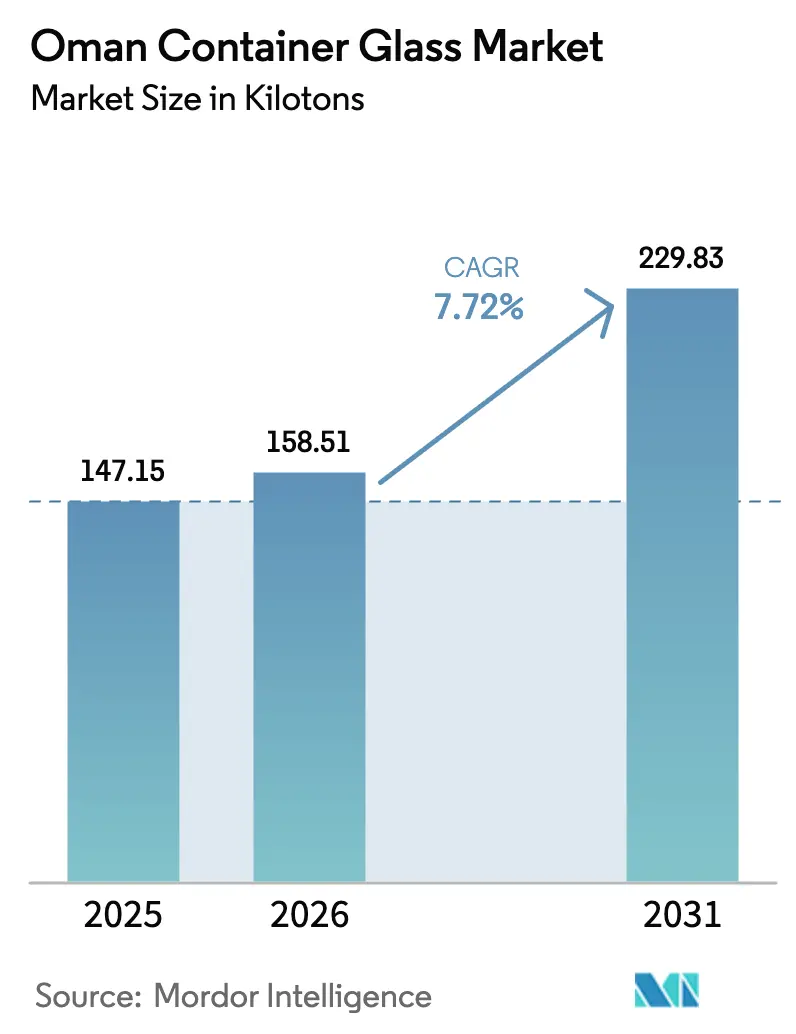
| Base Year Market Size (2025) | 147.15 kilotons |
| Market Volume (2026) | 158.51 kilotons |
| Market Volume (2031) | 229.83 kilotons |
| Growth Rate (2026 - 2031) | 7.72% CAGR |
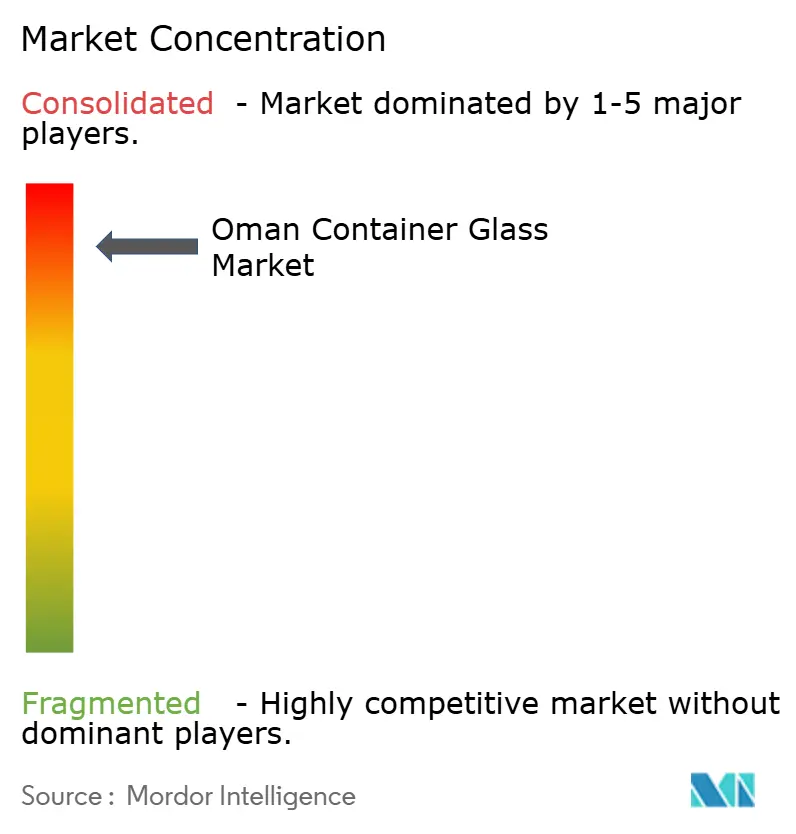
| Market Concentration | High |
Major Players *Disclaimer: Major Players sorted in no particular order Image © Mordor Intelligence. Reuse requires attribution under CC BY 4.0. | |
Oman Container Glass Market Analysis by Mordor Intelligence
Oman container glass market size in 2026 is estimated at 158.51 kilotons, growing from 2025 value of 147.15 kilotons with 2031 projections showing 229.83 kilotons, growing at 7.72% CAGR over 2026-2031. Healthy household spending, specialized free-zone incentives, and Vision 2040’s push for value-added manufacturing together position the Oman container glass market as a reliable supply hub for the wider GCC region. Domestic converters gain cost leverage from the new Sohar cullet facility, which cuts virgin material requirements and shrinks furnace energy loads. Carbonated soft drinks and bottled water underpin volume, but rising demand for high-margin cosmetics jars and pharmaceutical vials is reshaping the Oman container glass market’s product mix toward premium formats. Trade corridors through Sohar, Salalah, and Duqm ports enable local makers to reach East African buyers in under ten shipping days, an edge that widens as regional retailers tighten sustainability rules in favor of infinitely recyclable glass. Moderate industry concentration leaves room for niche entrants, yet energy-price reforms and persistent soda-ash import dependence remain cost headwinds that all players in the Oman container glass market must navigate.
Key Report Takeaways
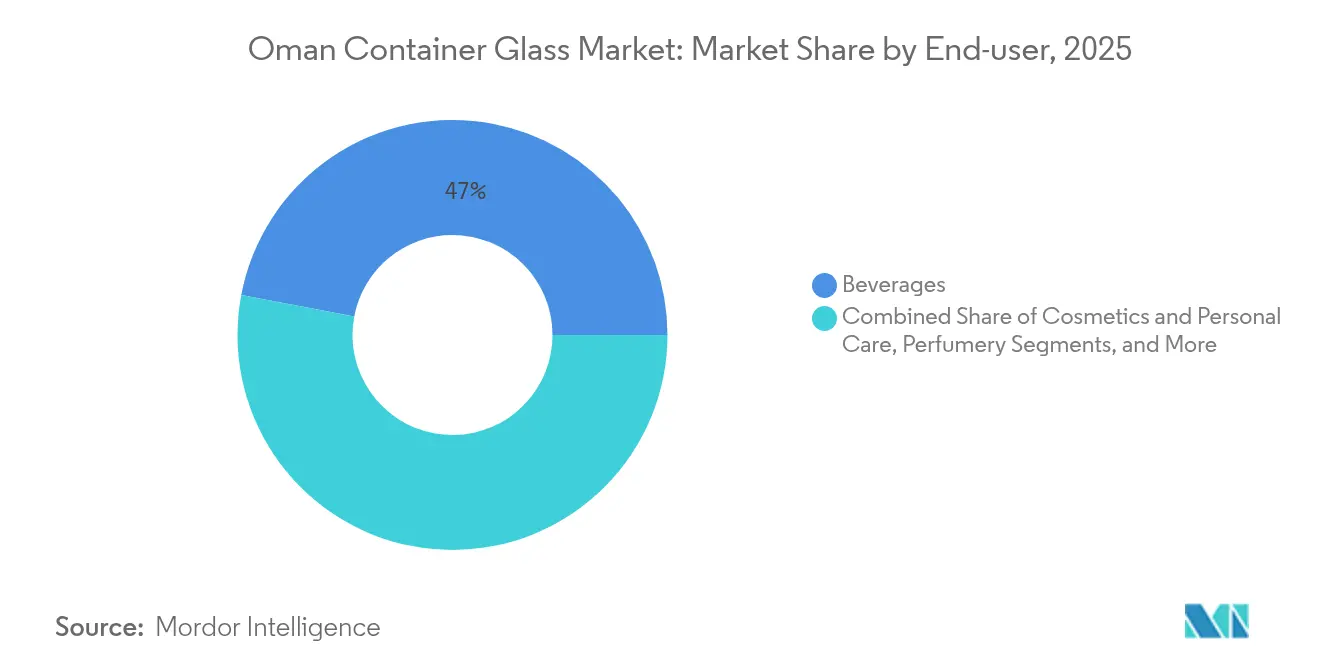
- By end-user, beverages captured 47.02% of the Oman container glass market share in 2025.
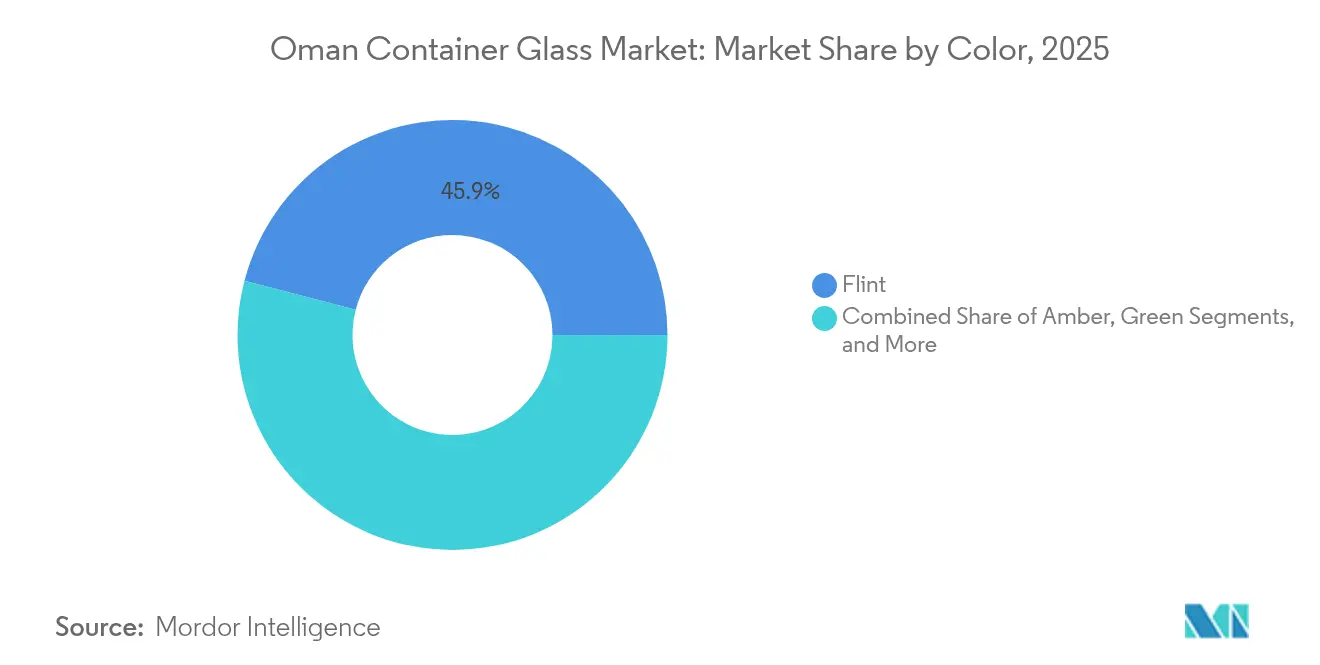
- By color, the Oman container glass market for amber glass is projected to grow at a 9.23% CAGR between 2026-2031.
Note: Market size and forecast figures in this report are generated using Mordor Intelligence’s proprietary estimation framework, updated with the latest available data and insights as of 2026.
Oman Container Glass Market Trends and Insights
Drivers Impact Analysis*
| Driver | (~) % Impact on CAGR Forecast | Geographic Relevance | Impact Timeline |
|---|---|---|---|
| Surging demand for eco-friendly packaging | +1.2% | National, with spillover to GCC export markets | Medium term (2-4 years) |
| Rising premium and aesthetic packaging demand | +0.9% | Urban centers, expanding to rural markets | Long term (≥ 4 years) |
| Growth in non-alcoholic beverages and bottled water | +1.5% | National, particularly Northern regions | Short term (≤ 2 years) |
| Government push for higher recycling rates | +0.8% | National, concentrated in industrial zones | Medium term (2-4 years) |
| First large-scale cullet plant lowering costs | +1.1% | National production base, regional competitive advantage | Medium term (2-4 years) |
| Free-zone tax incentives attracting new furnaces | +0.7% | Sohar, Salalah, Duqm economic zones | Long term (≥ 4 years) |
| Source: Mordor Intelligence | |||
Surging Demand for Eco-Friendly Packaging
Stricter circular-economy rules under Vision 2040 require food and beverage brands to raise recyclable-content thresholds, boosting the uptake of returnable glass bottles across supermarkets and the hospitality sector (HORECA) channels. National waste collector Bee’ah installed source-segregated bins in Muscat, delivering color-sorted cullet to glassmakers at discounts of up to 15% compared to imported soda-ash blends, a cost-saving measure that strengthens margins within the Oman container glass market. Retailers now print on-shelf eco-scores, and glass-packed SKUs consistently outperform PET equivalents in Nielsen scan data shared by major FMCG suppliers. GCC neighbors applying similar labeling schemes look to Oman converters for compliant stock, widening the Oman container glass market’s export book. With the Sohar cullet plant targeting 650 tons per day of feedstock, furnace operators expect to displace at least 20% of virgin raw material by 2027, thereby curbing both energy intensity and carbon emissions.
Rising Premium and Aesthetic Packaging Demand
Disposable incomes in Muscat and Salalah grew 6.1% in 2024, spurring craft-beverage startups and prestige skincare lines that favor embossed, heavy-flint bottles for shelf differentiation. Hotel chains within the tourism cluster order bespoke condiment jars and minibar formats, prompting converters to install multiple-section machines capable of handling short runs without switching losses. Designers emulate heritage Arabian silhouettes with frosted finishes and metallic inks, tactics that command price premiums of 18-22%. Cosmetic brand owners further leverage the proximity of the Oman container glass market to Dubai’s beauty re-export hub, thereby shortening lead times and reducing inventory risk. The trend extends into specialty pharma, where amber vials convey quality and tamper-evidence, lifting order sizes and average selling prices.
Growth in Non-Alcoholic Beverages and Bottled Water
Oman Refreshment Company, the holder of a 89% domestic cola share, expanded its glass-line capacity by 12 million bottles in 2025 to meet dine-in demand as pandemic restrictions eased. Bottled-water brands targeting Gulf tourists shifted flagship SKUs from PET to flint to project premium sourcing credentials. Khazaen Economic City’s agro-processing cluster added three juice fillers in 2024, each stipulating local glass sourcing to qualify for free-zone duty rebates. Trade lanes to Mombasa and Chittagong support back-haul exports of carbonated soft drinks in glass, stabilizing furnace utilization for Oman container glass market producers even in off-peak Ramadan months. Government hydration campaigns in schools choose refillable glass over single-use plastic, a pilot project projected to cut 4,000 tons of plastic waste annually.
Government Push for Higher Recycling Rates
Royal Decree 46/2009 mandates the recovery of 11 priority waste streams, and municipalities now levy landfill surcharges on untreated glass, prompting beverage fillers to adopt take-back schemes. The National Glass Recycling Company’s commissioning in 2025 assures a domestic cullet stream priced 8–10% below imported equivalents, unlocking immediate unit-energy savings because cullet melts at 200 °C lower than a virgin batch. The Oman container glass market, therefore, enjoys a twin benefit: cost reduction and a stronger sustainability narrative that resonates with export buyers. Additional grants under the Industrial Waste Management Fund reimburse up to 30% of capex for in-house cullet conveyors, accelerating furnace upgrades across the market.
Restraints Impact Analysis*
| Restraint | (~) % Impact on CAGR Forecast | Geographic Relevance | Impact Timeline |
|---|---|---|---|
| High energy and raw-material costs vs PET/metal | -1.8% | National production base, affecting export competitiveness | Short term (≤ 2 years) |
| Domestic demand below efficient furnace scale | -1.2% | National, particularly affecting new entrants | Medium term (2-4 years) |
| Gas-price subsidy reforms increase fuel costs | -0.9% | National industrial zones, concentrated impact on energy-intensive operations | Short term (≤ 2 years) |
| Import dependence for soda ash and colorants | -0.7% | National, affecting production cost volatility | Medium term (2-4 years) |
| Source: Mordor Intelligence | |||
High Energy and Raw-Material Costs vs PET/Metal
Glass burn-off uses roughly three times the energy per container compared with PET injection, so the January 2025 electricity tariff adjustments raised melting costs by nearly 9% for furnace operators. Imported soda-ash prices rose 12% year-on-year due to Black Sea logistics disruptions, and colorant shipments faced port congestion surcharges. While cullet lowers batch temperatures, ROI hinges on reliable feedstock volumes that remain nascent. Brewers and edible-oil bottlers accordingly hedge by dual-sourcing into PET, applying price pressure across the Oman container glass market.
Domestic Demand Below Efficient Furnace Scale
Modern end-fired furnaces operate optimally above 100,000 tons per year; however, the total Oman container glass market demand was only 147.15 kilotons in 2025, which limits economies of scale. Majan Glass reported negative shareholders’ equity in its latest filing, citing sub-70% utilization as a primary drag.[1]Simply Wall St, “Majan Glass Company SAOG -Stock Analysis,” simplywall.st Export options are available but require costly brand registrations and packaging format certifications in target countries. Small domestic order lots necessitate frequent mold changes, resulting in increased energy consumption and downtime per unit. New entrants, therefore, face prolonged payback horizons unless they anchor capacity on committed off-take from anchor FMCG or pharma tenants within free zones.
*Our forecasts treat driver/restraint impacts as directional, not additive. The impact forecasts reflect baseline growth, mix effects, and variable interactions.
Segment Analysis
By End-user: Beverages Hold Volume, Cosmetics Accelerate
The beverage domain accounted for 47.02% of the Oman container glass market size in 2025, thanks to established soft-drink bottlers and a resurgence in the dine-in channel. Carbonated colas dominate volumes, but juice and dairy fillers at Sohar Industrial City now take a 15% share and order specialty shapes that boost the average price per ton. The Oman container glass market will continue to see a bulk of furnace hours allocated to 200–330 ml returnable bottles, ensuring high cullet reuse rates and consistent furnace pull speeds. Strong logistics links to the UAE and Saudi hypermarkets further insulate beverage glass from demand volatility.
Cosmetics and personal care lines grow at a 9.68% CAGR, reflecting premiumization across GCC beauty aisles and positioning Oman converters as niche-batch specialists. Serums and fragrances adopt smaller 30ml and 50ml flacons, supporting higher revenue density per ton compared to beverage glass. As regional brands scale, they prefer geographically proximate suppliers to avoid Asia-to-GCC shipping delays, funneling orders into the Oman container glass market. Pharmaceutical vials similarly benefit from new fill-finish plants in Salalah Free Zone, adding another stream of light-weight yet high-value demand that raises overall contribution margins.


By Color: Flint Dominates, Amber Gains
Flint retained 45.94% of the Oman container glass market share in 2025, bolstered by beverages and OTC drugs, where transparency aids visual inspection. Stable chemistries and mature production lines enable high pull rates, keeping per-ton costs competitive. Export opportunities into neighboring halal beverage markets cement Flint’s scale advantage and its anchoring role within the Oman container glass market.
Amber is on track for a 9.23% CAGR through 2031 as pharma and premium spirits require UV-blocking properties. Domestic syringe and injectable-grade vial production under the Duqm pharma cluster favors amber over flint, guaranteeing multi-year offtake contracts. Breweries exploring craft lines also specify amber for light-sensitive hops, diversifying demand. The Sohar cullet facility’s color-separated streams help maintain chromatic purity, mitigating batch contamination risks and encouraging producers to widen amber capacity within the Oman container glass market.
Geography Analysis
Northern Oman clusters nearly 60% of its furnace capacity within Sohar Industrial City, leveraging its deep-water port, which handled 2.6 million TEUs in 2024. Proximity to refinery gas and grid tie-ins keeps melting costs below the southern averages, and nearby beverage fillers ensure a steady demand. Planned rail links to the UAE reduce trucking costs by 25%, enhancing cross-border competitiveness for Oman's container glass market.
Central Al Wusta benefits from Minerals Development Oman’s high-purity silica-sand concession, supplying batch inputs at 18% lower freight cost than imports. New crushers will feed both Sohar and Duqm furnaces, smoothing supply volatility. Free-zone policies allow 100% foreign ownership, drawing interest from Indian specialty-glass firms scouting brownfield joint ventures to access GCC duty-free quotas.
Southern Salalah Free Zone anchors a pharma and food cluster whose tenants prefer nearby glass supply to mitigate breakage overland. The Port of Salalah aims to reach 6.6 million TEUs by 2025, opening direct lanes to Mombasa and thereby enabling the Oman container glass market to efficiently backhaul returnable empties. Salalah’s monsoon-based ambient cooling provides marginal energy savings, although cyclone-season logistics necessitate higher buffer stocks.
Competitive Landscape
The Oman container glass market exhibits a mid-tier concentration, with the top two producers accounting for roughly 55% of the output. Majan Glass operates three furnaces and a captive decorating line, but posted a net loss in 2024 due to suboptimal utilization. Pragati Glass Gulf operates smaller, flexible lines, supplying cosmetic flacons from 3ml upward and securing clients through short lead times. Emirates Glass LLC entered the market in 2024 under the “Made in Oman” branding, adding 60 kilotons of capacity targeted at hospitality bottle contracts.[3]Made in Oman Gate, “Emirates Glass LLC,” madeinomangate.com
Technology upgrades dominate strategy. Majan retrofitted oxy-fuel burners to reduce gas consumption by 12%; Pragati installed an AI-powered defect inspection system, resulting in a 1.6% reduction in reject rates. Sustainability messaging rises in bids, leveraging the Sohar cullet stream that offers up to 30% recycled content. Free-zone incentives, including up to 15-year tax holidays and duty exemptions on raw materials, further entice overseas players to establish green-field furnaces, potentially intensifying competition within the Oman container glass market.
White-space opportunities center on high-value amber pharmaceutical vials, craft-beverage bottles, and luxury-cosmetic jars. However, entrants must commit to minimum 400 TPD furnace pulls to achieve cost parity. Market participants are also exploring hydrogen-ready furnaces as Oman accelerates green-hydrogen projects, potentially aligning long-term energy strategy with lower-carbon melting.
Oman Container Glass Industry Leaders
Majan Glass Company SAOG
OMANCHEM Marine International EST
Changsha Kotto Glass Industrial Co.Ltd.
Hotpack Packaging Industries LLC
Pragati Glass Gulf LLC
- *Disclaimer: Major Players sorted in no particular order

Recent Industry Developments
- November 2024: Emirates Glass LLC began production lines in Muscat, adding capacity for flint and amber to serve regional beverage clients.
- September 2024: invest OMAN released 10 manufacturing investment packages worth OMR 166 million (USD 431 million) aimed at advanced materials, including container glass.
- July 2024: The Swiss Embassy economic report confirmed Salalah port’s expansion to 6.6 million TEUs by 2025, reinforcing export connectivity for the Oman container glass market.
- February 2024: Minerals Development Oman secured high-purity silica-sand rights in Al Wusta, lowering raw-material import reliance.


Oman Container Glass Market Report Scope
Glass Containers refer to clean bottles and jars made from glass. The scope excludes windows and other non-container glass products. Container glass is used in the alcoholic and non-alcoholic beverage industries due to its ability to maintain chemical inertness, sterility, and non-permeability. Glass packaging is valued for its unique properties, including its transparency, inertness, and ability to preserve the quality and integrity of its contents.
Oman container glass market is segmented by end-user vertical (beverages [alcoholic beverages (beer, wine, spirits, and other alcoholic beverages {cider and other fermented drinks}), non-alcoholic beverages (juices, carbonated drinks (CSDs), dairy product-based drinks, other non-alcoholic beverages)], food [jam, jelly, marmalades, honey, sausages and condiments, oil, pickles], cosmetics and personal care, pharmaceuticals (excluding vials and ampoules), and perfumery), by color (green, amber, flint and other colors). The report offers market forecasts and size in volume (kilotons) for all the above segments.
| Beverages | Alcoholic | Beer |
| Wine | ||
| Spirits | ||
| Other Alcoholic Beverages (Cider and Other Fermented Drinks) | ||
| Non-Alcoholic | Juices | |
| Carbonated Drinks (CSDs) | ||
| Dairy Product Based Drinks | ||
| Other Non-Alcoholic Beverages | ||
| Food (Jam, Jelly, Marmalades, Honey, Sausages and Condiments, Oil, Pickles) | ||
| Cosmetics and Personal Care | ||
| Pharmaceuticals (excluding Vials and Ampoules) | ||
| Perfumery | ||
| Green |
| Amber |
| Flint |
| Other Colors |
| By End-user | Beverages | Alcoholic | Beer |
| Wine | |||
| Spirits | |||
| Other Alcoholic Beverages (Cider and Other Fermented Drinks) | |||
| Non-Alcoholic | Juices | ||
| Carbonated Drinks (CSDs) | |||
| Dairy Product Based Drinks | |||
| Other Non-Alcoholic Beverages | |||
| Food (Jam, Jelly, Marmalades, Honey, Sausages and Condiments, Oil, Pickles) | |||
| Cosmetics and Personal Care | |||
| Pharmaceuticals (excluding Vials and Ampoules) | |||
| Perfumery | |||
| By Color | Green | ||
| Amber | |||
| Flint | |||
| Other Colors | |||


Key Questions Answered in the Report
What volume growth is expected for Oman's container glass demand by 2031?
The market is forecast to rise from 158.51 kilotons in 2026 to 229.83 kilotons by 2031, reflecting a 7.72% CAGR.
Which end-user segment currently drives the demand for glass in Oman?
Beverages hold the largest share at 47.02%, driven by carbonated soft-drink bottlers and growing bottled-water brands.
Why is amber glass usage increasing?
Pharmaceutical vials and premium spirits require UV protection, driving the demand for amber containers to a 9.23% CAGR through 2031.
How will the Sohar cullet plant affect production costs?
The 650 TPD facility supplies lower-melting cullet, cutting batch energy and raw material expenses for domestic furnaces.
What role do free-zones play in sector expansion?
Sohar, Salalah and Duqm zones offer tax holidays and 100% foreign ownership, attracting new furnaces and allied suppliers.
Is Oman positioned to export container glass?
Yes, port upgrades and rail links enable cost-efficient shipping to GCC, East Africa and South Asia, supporting export growth.
Page last updated on:


