South Africa Container Glass Market Size and Share
Market Overview
| Study Period | 2020 - 2031 |
|---|---|
| Forecast Data Period | 2026 - 2031 |
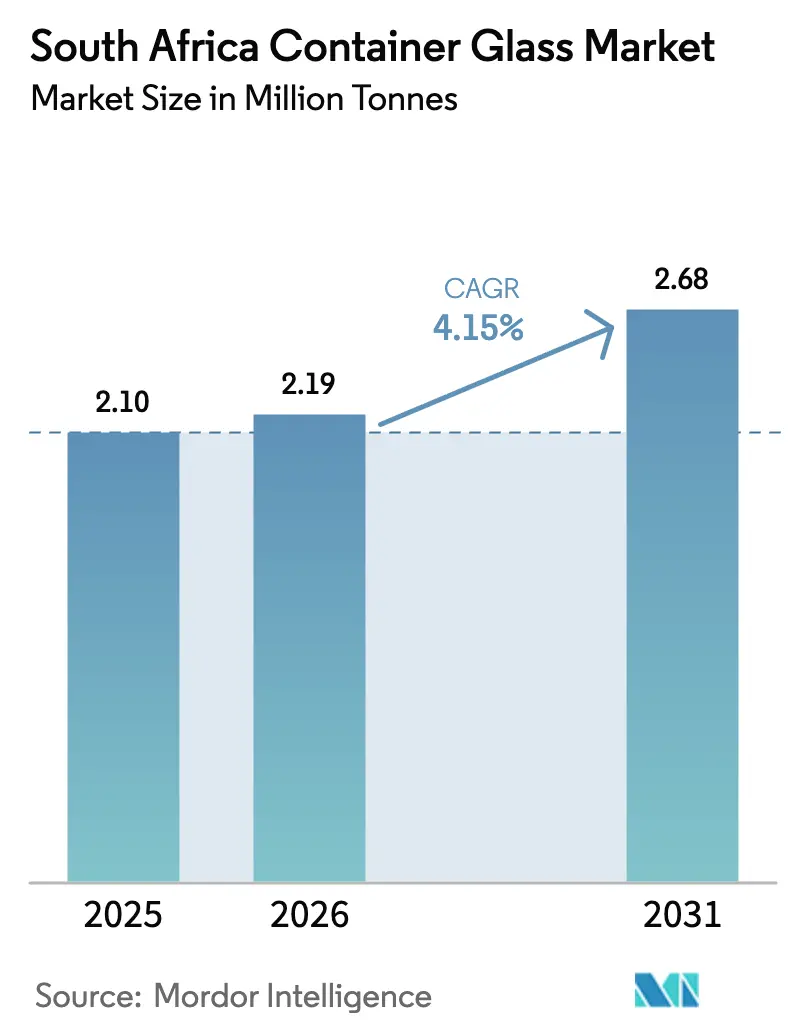
| Base Year Market Size (2025) | 2.10 Million tonnes |
| Market Volume (2026) | 2.19 Million tonnes |
| Market Volume (2031) | 2.68 Million tonnes |
| Growth Rate (2026 - 2031) | 4.15% CAGR |
| Market Concentration | High |
Major Players *Disclaimer: Major Players sorted in no particular order Image © Mordor Intelligence. Reuse requires attribution under CC BY 4.0. | |
South Africa Container Glass Market Analysis by Mordor Intelligence
South Africa Container Glass Market size in 2026 is estimated at 2.19 million tonnes, growing from 2025 value of 2.10 million tonnes with 2031 projections showing 2.68 million tonnes, growing at 4.15% CAGR over 2026-2031. This growth trajectory reflects the market's resilience despite significant structural challenges, including load-shedding disruptions and rising input costs. The market's expansion is underpinned by domestic beverage-production recovery and accelerating sustainability mandates, particularly the government's 75% recycling target by 2030, which is driving cullet demand and circular-economy investments. Strategic shifts toward decarbonization are reshaping operational priorities as South Africa's Climate Change Act 2024 came into force in March 2025, establishing carbon-budget frameworks for industrial emitters. Carbon-tax rates increased 19.49% to R190 per tonne CO₂e in 2024, with Phase Two implementation beginning in 2026, expected to eliminate current allowances and substantially raise effective tax burdens. These regulatory pressures are accelerating the adoption of electric-melting furnaces and hybrid technologies that can reduce CO₂ emissions by 43-60% compared with traditional methods.
Key Report Takeaways
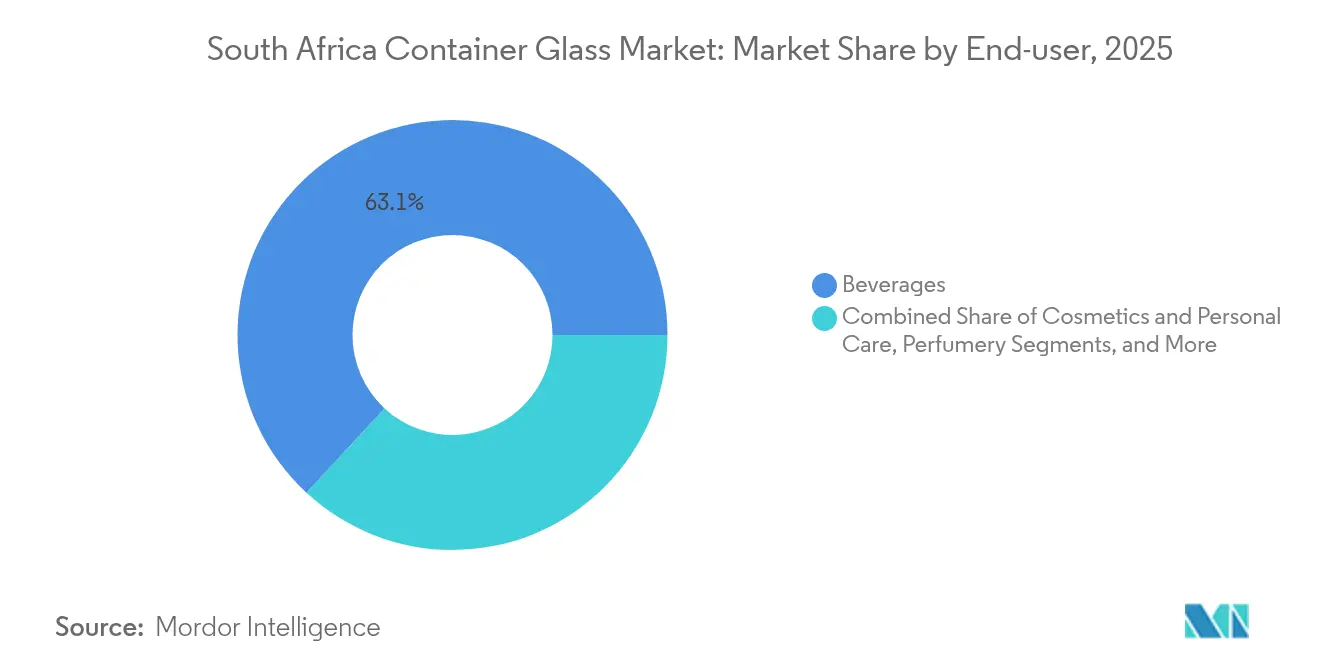
- By end-user, beverages captured 63.12% of the South Africa container glass market share in 2025.
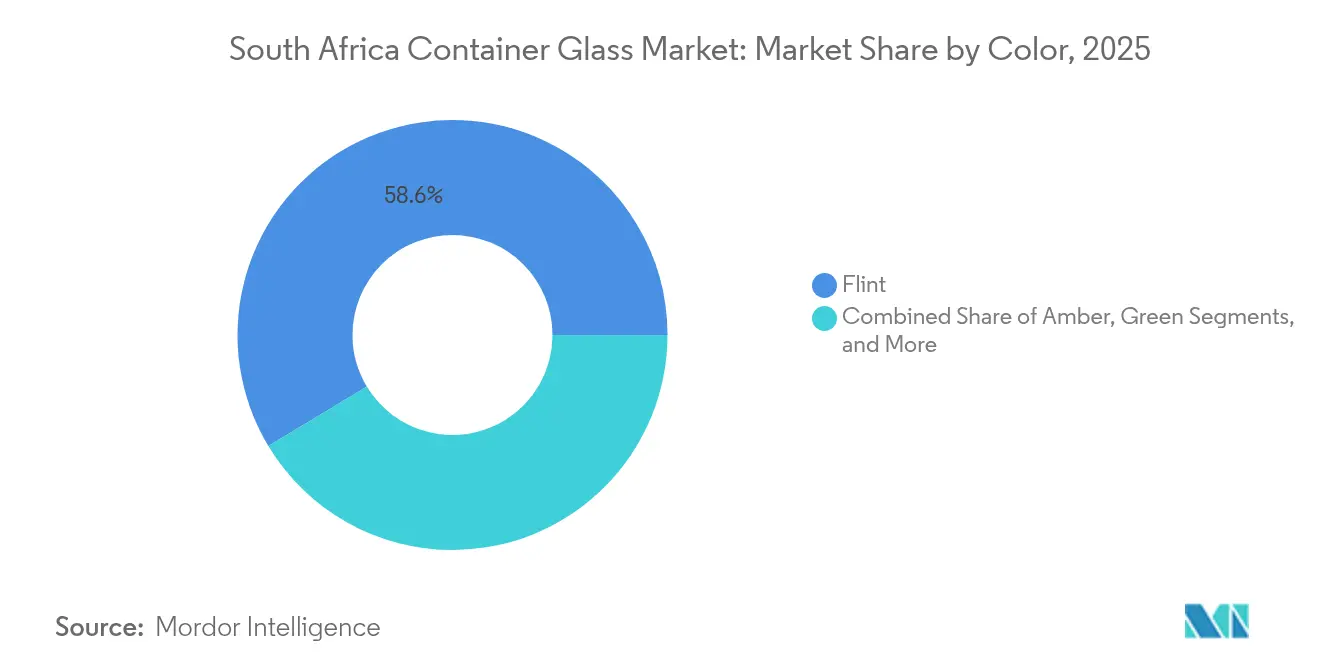
- By color, the South Africa container glass market for amber glass is projected to grow at a 5.58% CAGR between 2026-2031.
Note: Market size and forecast figures in this report are generated using Mordor Intelligence’s proprietary estimation framework, updated with the latest available data and insights as of 2026.
South Africa Container Glass Market Trends and Insights
Drivers Impact Analysis*
| Driver | (~) % Impact on CAGR Forecast | Geographic Relevance | Impact Timeline |
|---|---|---|---|
| Growth in domestic food and beverage output | +1.2% | National, concentrated in Gauteng and Western Cape | Medium term (2-4 years) |
| Sustainability push and 75% recycling target by 2030 | +0.8% | National, with early gains in Cape Town, Johannesburg, Durban | Long term (≥ 4 years) |
| Premiumisation of alcoholic beverages and cosmetics | +0.6% | National, premium segments in urban hubs | Medium term (2-4 years) |
| Furnace expansions lowering unit costs (AGP Nigel line) | +0.4% | National, manufacturing concentrated in Gauteng | Short term (≤ 2 years) |
| Refillable grocery e-commerce models in urban hubs | +0.3% | Urban centers, Gauteng and Western Cape focus | Medium term (2-4 years) |
| Tax incentives for cullet use > 40% (effective 2026) | +0.5% | National, manufacturing regions primarily | Medium term (2-4 years) |
| Source: Mordor Intelligence | |||
Growth in Domestic Food and Beverage Output
South Africa's food and beverage manufacturing sector is experiencing renewed momentum, with the food index reaching five-year highs and beverage-market projections indicating a 5.2% CAGR through 2028. This recovery directly translates to container-glass demand, as approximately 85% of glass packaging serves alcoholic beverages, with food applications representing the secondary growth vector. The sector's emphasis on waste reduction and energy efficiency is driving procurement preferences toward recyclable packaging formats, positioning glass favorably against single-use alternatives. Domestic production growth reduces import dependency for packaged goods, creating sustained demand for local glass-container manufacturing. The trend toward premiumization in bread, cereals, confectionery, and preserved foods is expanding glass-packaging applications beyond traditional beverage markets.
Sustainability Push and 75% Recycling Target by 2030
The government's ambitious 75% recycling target by 2030 is fundamentally restructuring glass supply chains and creating new revenue streams through cullet valorization. Extended Producer Responsibility regulations implemented in May 2021 mandate glass-packaging producers to establish collection and recycling schemes, driving investments in material-recovery facilities and reverse logistics. Cape Town's multi-year capital allocation of R647 million for waste-management infrastructure, including the Coastal Park Material Recovery Facility, demonstrates municipal commitment to supporting circular-economy objectives. Each tonne of recycled cullet reduces energy consumption by 322 kWh and CO₂ emissions by 185-300 kg, creating compelling economics for manufacturers facing rising electricity tariffs. The regulatory framework positions South Africa ahead of regional competitors in establishing a systematic glass-recovery infrastructure.
Premiumisation of Alcoholic Beverages and Cosmetics
Premium alcoholic-beverage segments are driving glass-packaging demand through format diversification and enhanced aesthetic requirements, with wine-glass packaging share increasing from 42.9% to 48.2% between 2005-2009. The cosmetics and personal-care market is projected to grow from USD 3.35 billion in 2023 to USD 4.2 billion by 2028, with premium and natural-product trends favoring glass packaging for perceived quality and sustainability credentials. Microbrewery expansion and craft spirit production are creating demand for specialized glass formats with custom embossing and unique color specifications. Export-oriented wine production is driving packaging-standardization requirements for international markets, supporting consistent glass-container demand. The trend toward smaller-format premium products is increasing unit volumes while maintaining value density for glass manufacturers.
Furnace Expansions Lowering Unit Costs
Ardagh Group's ZAR 3 billion investment program, including a third furnace at the Nigel facility, is expected to create over 250 direct jobs while achieving economies of scale that reduce per-unit production costs. The expansion addresses historical capacity constraints that limited market responsiveness and created supply bottlenecks during peak-demand periods. Advanced furnace technologies incorporating waste-heat recovery and improved thermal efficiency are reducing energy intensity per tonne of glass produced, critical given electricity-tariff increases of 12.74% for direct customers effective April 2025. Capacity expansion enables product diversification into specialty glass formats and reduces dependency on imports for niche applications. The investment demonstrates confidence in long-term domestic-demand growth despite current economic headwinds.
Restraints Impact Analysis*
| Restraint | (~) % Impact on CAGR Forecast | Geographic Relevance | Impact Timeline |
|---|---|---|---|
| PET and aluminium can substitution pressure | -1.1% | National, beverage-segment concentration | Medium term (2-4 years) |
| Load-shedding and volatile electricity tariffs | -0.9% | National, manufacturing regions primarily | Short term (≤ 2 years) |
| Industrial water-scarcity levies from 2027 | -0.4% | National, acute in Gauteng and Western Cape | Long term (≥ 4 years) |
| Proposed alcohol-content-based excise favoring lightweight packs | -0.3% | National, wine and spirits segments | Medium term (2-4 years) |
| Source: Mordor Intelligence | |||
PET and Aluminium Can Substitution Pressure
Alternative packaging formats are gaining market share through sustainability positioning and logistics advantages, with aluminum-can recycling rates reaching 76% in Europe compared with glass-container recycling at 32% globally. Nampak's sole domestic beverage-can production capacity of 3.4 billion units annually provides cost-competitive alternatives for beer and soft-drink applications, particularly in price-sensitive segments. PET packaging captured approximately 20.7% of wine packaging by 2009, with bag-in-box formats increasing from 22.2% to 26.9% during 2005-2009, demonstrating sustained format migration. The logistics advantages of lighter-weight packaging become more pronounced with rising transport costs and port-efficiency challenges. Consumer acceptance of alternative formats in traditional glass categories threatens long-term volume growth despite premium-segment resilience.
Load-shedding and Volatile Electricity Tariffs
Energy-supply instability continues to disrupt glass-manufacturing operations, with furnaces requiring continuous operation at costs exceeding R8 million per day to prevent solidification damage. NERSA-approved electricity tariff increases of 12.74% for direct customers and 11.32% for municipal bulk purchases, effective April 2025, substantially raise production costs for energy-intensive glass manufacturing. While Eskom's progress toward ending load-shedding provides operational-stability improvements, the structural tariff increases remain permanent cost pressures. Glass manufacturers face difficult capital-allocation decisions between investing in backup-generation capacity versus production-efficiency.
*Our forecasts treat driver/restraint impacts as directional, not additive. The impact forecasts reflect baseline growth, mix effects, and variable interactions.
Segment Analysis
By End-user: Beverages Dominate Despite Format Diversification
The beverages segment commands 63.12% market share in 2025, with cosmetics and personal care emerging as the fastest-growing segment at 5.11% CAGR through 2031. Within beverages, alcoholic applications represent approximately 85% of glass-packaging demand, concentrated in wine, spirits, and premium beer categories that prioritize glass for quality perception and shelf appeal. Non-alcoholic beverages, including juices and carbonated soft drinks, maintain steady demand, though facing competitive pressure from PET and aluminum alternatives in mass-market segments. Food applications encompassing jams, condiments, oils, and preserved goods provide stable demand with limited format-substitution risk due to product-compatibility requirements.
Pharmaceutical and perfumery segments, while smaller by volume, command premium pricing and demonstrate resilience to economic cycles due to essential-product classifications. The cosmetics segment's 5.11% growth rate reflects premiumization trends and expanding middle-class consumption, with glass packaging preferred for premium skincare and fragrance applications. Regulatory-compliance requirements under the Department of Forestry, Fisheries, and the Environment's Extended Producer Responsibility framework are driving end-user companies toward packaging suppliers with established recycling capabilities and sustainability credentials.


By Color: Flint Glass Leadership Challenged by Amber Growth
Flint glass maintains a 58.63% market share in 2025, driven by versatility across beverage and cosmetic applications, where product visibility enhances consumer appeal. Amber glass is expanding fastest at 5.58% CAGR through 2031, benefiting from pharmaceutical applications requiring UV protection and premium alcoholic-beverage positioning that associates amber coloring with quality and tradition. Green glass serves primarily wine applications with stable but limited growth prospects tied to specific varietal positioning and export-market requirements. Other color variants, including cobalt and custom colors, represent niche opportunities in premium cosmetics and specialty-beverage applications.
The color segmentation reflects broader premiumization trends, with amber and specialty colors commanding higher margins despite lower volumes compared with standard flint-glass production. Manufacturing-efficiency considerations favor longer production runs of standard colors, creating tension between margin optimization and customer-service requirements for specialty applications. Furnace changeover costs and color-contamination risks limit production flexibility, requiring strategic planning to balance color mix with demand patterns and profitability objectives.
Geography Analysis
The South Africa Container Glass Market operates within a concentrated geographic footprint, with manufacturing facilities clustered in Gauteng province to leverage proximity to major beverage producers and distribution networks. Ardagh Group's facilities in Bellville, Clayville, Nigel, Stellenbosch, and Wadeville represent the core production infrastructure, supplemented by Isanti Glass operations and smaller regional players. The Western Cape region serves as a secondary manufacturing hub, particularly for wine-industry applications where proximity to vineyards reduces logistics costs and enables responsive service to seasonal production cycles.
Port-infrastructure constraints significantly impact the geographic distribution of container-glass trade flows, with Durban handling approximately 60% of South Africa's container traffic despite ranking among the world's worst ports for operational efficiency. Cape Town and Port Elizabeth provide alternative export channels, though capacity limitations and equipment constraints restrict throughput to approximately 65% of theoretical capacity. The concentration of manufacturing in inland locations creates dependency on efficient rail and road transport to coastal ports, with Transnet's operational challenges adding logistics costs and delivery uncertainty.
Regional-demand patterns reflect economic concentration in Gauteng and Western Cape provinces, which together account for the majority of beverage consumption and premium-product demand. The Eastern Cape and KwaZulu-Natal regions represent growth opportunities tied to agricultural processing and emerging middle-class consumption, though infrastructure limitations constrain market development. Cross-border export opportunities to neighboring SADC countries remain underdeveloped due to logistics costs and competitive pressure from global suppliers serving those markets directly.
Competitive Landscape
The South Africa Container Glass Market exhibits extreme concentration with Ardagh Group controlling approximately 80% market share following its USD 1 billion acquisition of Consol Glass in 2022, creating substantial barriers to entry through scale economies and capital requirements exceeding R800 million per furnace. Isanti Glass operates as the primary challenger through its joint venture with SAB after acquiring 60% of Nampak Glass operations, focusing on beer and beverage applications where customer relationships and service responsiveness provide competitive differentiation.
The oligopolistic structure reflects the capital-intensive nature of glass manufacturing and the inability to economically shut down furnaces during demand fluctuations. Strategic positioning emphasizes vertical integration and customer lock-in through specialized product development, with Consol's 56 product innovations launched in 2017 demonstrating the innovation imperative in a concentrated market. Technology adoption focuses on process automation and energy-efficiency improvements, with Schneider Electric and Saint-Gobain's collaboration on software-defined automation systems indicating the direction of industry digitalization.
White-space opportunities exist in specialty applications, including pharmaceutical vials, premium cosmetics packaging, and export-oriented production leveraging South Africa's cost advantages. Regulatory compliance under the Climate Change Act 2024 and Extended Producer Responsibility frameworks creates competitive advantages for established players with sustainability-infrastructure investments.
South Africa Container Glass Industry Leaders
Ardagh Glass Packaging Holdings Africa (Pty) Ltd
O-I Glass, Inc.
Schott AG
SGD S.A.
Saverglass SAS
- *Disclaimer: Major Players sorted in no particular order

Recent Industry Developments
- August 2025: Unitrans won the Africa Supply Chain Excellence Awards for its partnership with Isanti Glass, recognizing supply-chain transformation that positioned the glass manufacturer for scalable growth, operational efficiency improvements.
- July 2025: Transnet container-terminal throughput improvements reported, supporting distribution capabilities for container-glass manufacturers and export opportunities despite ongoing port-efficiency challenges.
- March 2025: South Africa's Climate Change Act 2024 came into force, establishing a legislative framework for carbon budgets and industrial-emission-reduction targets that will materially impact energy-intensive glass-manufacturing operations and drive investments in decarbonization technologies.
- February 2025: South Africa Wine Industry Body opposed National Treasury's proposed alcohol-excise-tax changes targeting 16% retail price incidence versus the current 11%, with alcohol-content-based progressive taxation potentially favoring lightweight packaging alternatives to traditional glass bottles.


South Africa Container Glass Market Report Scope
Container glass is designed for crafting glass containers, including bottles, jars, drinkware, and bowls. Its key attributes include chemical inertness, sterility, and non-permeability, rendering it especially sought after in the beverage, food, pharmaceutical, and cosmetic sectors. The research also examines underlying growth influencers and significant industry vendors, all of which help to support market estimates and growth rates throughout the anticipated period. The market estimates and projections are based on the base year factors and arrived at top-down and bottom-up approaches.
South Africa container glass market is segmented by end-user vertical (beverages [alcoholic beverages (beer, wine, spirits, and other alcoholic beverages {cider and other fermented drinks}), non-alcoholic beverages (juices, carbonated drinks (CSDs), dairy product-based drinks, other non-alcoholic beverages)], food [jam, jelly, marmalades, honey, sausages and condiments, oil, pickles], cosmetics and personal care, pharmaceuticals (excluding vials and ampoules), and perfumery, by color (green, amber, flint and other colors). The report offers market forecasts and size in volume (kilotons) for all the above segments.
| Beverages | Alcoholic | Beer |
| Wine | ||
| Spirits | ||
| Other Alcoholic Beverages (Cider and Other Fermented Drinks) | ||
| Non-Alcoholic | Juices | |
| Carbonated Drinks (CSDs) | ||
| Dairy Product Based Drinks | ||
| Other Non-Alcoholic Beverages | ||
| Food (Jam, Jelly, Marmalades, Honey, Sausages and Condiments, Oil, Pickles) | ||
| Cosmetics and Personal Care | ||
| Pharmaceuticals (excluding Vials and Ampoules) | ||
| Perfumery | ||
| Green |
| Amber |
| Flint |
| Other Colors |
| By End-user | Beverages | Alcoholic | Beer |
| Wine | |||
| Spirits | |||
| Other Alcoholic Beverages (Cider and Other Fermented Drinks) | |||
| Non-Alcoholic | Juices | ||
| Carbonated Drinks (CSDs) | |||
| Dairy Product Based Drinks | |||
| Other Non-Alcoholic Beverages | |||
| Food (Jam, Jelly, Marmalades, Honey, Sausages and Condiments, Oil, Pickles) | |||
| Cosmetics and Personal Care | |||
| Pharmaceuticals (excluding Vials and Ampoules) | |||
| Perfumery | |||
| By Color | Green | ||
| Amber | |||
| Flint | |||
| Other Colors | |||


Key Questions Answered in the Report
What is the projected volume for South Africa’s container-glass demand by 2031?
Total demand is expected to reach 2.68 million tonnes by 2031, expanding at a 4.15% CAGR.
How dominant is Ardagh Group after acquiring Consol Glass?
The deal elevated Ardagh Group to roughly 80% share, making it the clear incumbent leader.
Which end-use application is expanding the fastest?
Cosmetics and personal-care packaging is on track for a 5.11% CAGR through 2031.
Why is amber glass growing quicker than other colors?
Pharmaceutical UV-protection needs and premium alcoholic-beverage positioning are propelling amber glass at a 5.58% CAGR.
How will higher carbon-tax rates influence producers?
Rising from R190 per tonne CO₂e in 2024, the tax and the impending Phase-Two allowance removal are accelerating investment in electric and hybrid furnaces.
What operational risk does load-shedding pose?
Forced furnace downtime can cause solidification damage costing about R8 million daily, plus electricity tariffs are up 12.74% for direct customers in 2025.
Page last updated on:


