Africa Container Glass Market Size and Share
Market Overview
| Study Period | 2020 - 2031 |
|---|---|
| Forecast Data Period | 2026 - 2031 |
| Historical Data Period | 2020 - 2024 |
| Market Volume (2026) | 4.99 Thousand kilotons |
| Market Volume (2031) | 6.36 Thousand kilotons |
| Growth Rate (2026 - 2031) | 4.97% CAGR |
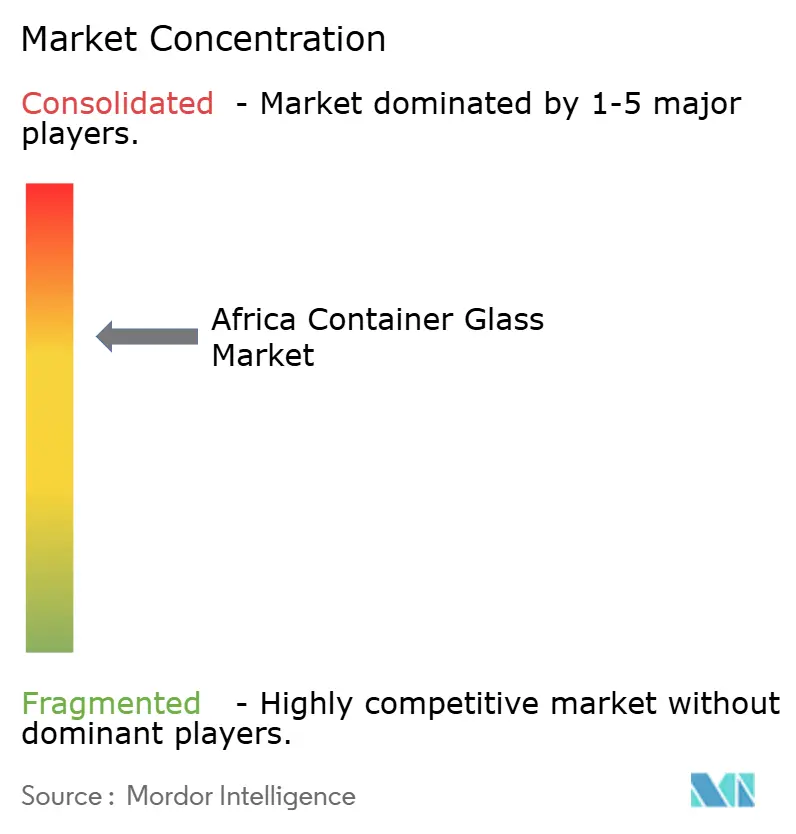
| Market Concentration | Medium |
Major Players *Disclaimer: Major Players sorted in no particular order Image © Mordor Intelligence. Reuse requires attribution under CC BY 4.0. | |

Africa Container Glass Market Analysis by Mordor Intelligence
The Africa container glass market size reached 4.99 thousand kilotons in 2026 and is projected to climb to 6.36 thousand kilotons by 2031, translating into a 4.97% CAGR over the forecast period. Demand is rising as beverage producers trade up to premium SKUs, regulators tighten extended-producer-responsibility rules, and pharmaceutical firms add fill-finish lines that favor infinitely recyclable containers. While South Africa’s mature furnace park underpins baseline output, Egypt is adding export-oriented capacity and West Africa is commissioning multi-color furnaces that cater to craft spirits and premium beer, gradually rebalancing volumes across the region. Brand owners in cosmetics and personal care are also shifting toward glass to enhance shelf impact, accepting the weight penalty because it signals sustainability. At the same time, cullet availability remains uneven, energy prices remain volatile, and lightweight PET and aluminum keep pressure on cost structures.
Key Report Takeaways
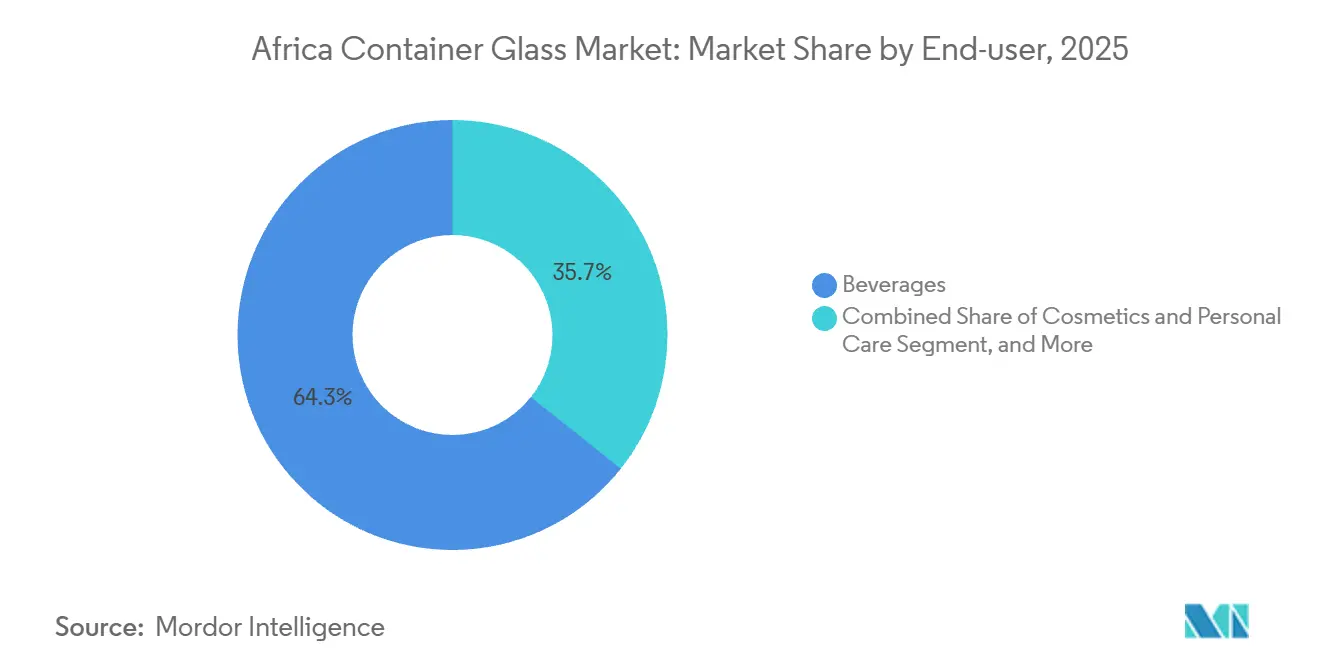
- By end-user, beverages commanded 64.32% of Africa container glass market share in 2025, while cosmetics and personal care is forecast to expand at a 5.43% CAGR through 2031.
- By color, flint captured 58.59% share of the Africa container glass market size in 2025, and amber is projected to grow at a 5.76% CAGR through 2031.
- By country, South Africa held 44.21% volume share of the Africa container glass market size in 2025, and Morocco is advancing at a 5.89% CAGR through 2031.
Note: Market size and forecast figures in this report are generated using Mordor Intelligence’s proprietary estimation framework, updated with the latest available data and insights as of January 2026.
Africa Container Glass Market Trends and Insights
Drivers Impact Analysis*
| Driver | (~) % Impact on CAGR Forecast | Geographic Relevance | Impact Timeline |
|---|---|---|---|
| Growing Demand from Food and Beverage Sector | +1.8% | South Africa, Nigeria, Egypt, broader Africa | Medium term (2-4 years) |
| Rapid Premiumisation of Alcoholic Beverages | +1.2% | South Africa, Kenya, Morocco, urban Nigeria | Medium term (2-4 years) |
| Sustainability Regulations Favoring Recyclable Packaging | +1.0% | South Africa, Kenya, Egypt, Morocco | Long term (≥ 4 years) |
| Expansion of Pharmaceutical Fill-Finish Capacity | +0.7% | Egypt, South Africa, Kenya | Long term (≥ 4 years) |
| Rising Multi-Color Furnace Investments | +0.5% | Nigeria, Ghana, Côte d’Ivoire | Short term (≤ 2 years) |
| Digitally Enabled Craft Brands Requiring Custom Glass | +0.3% | South Africa, Kenya, Nigeria | Medium term (2-4 years) |
| Source: Mordor Intelligence | |||
Growing Demand from Food and Beverage Sector
Beverage applications accounted for 64.32% of the 2025 volume, as brewers, soft-drink companies, and wineries adopted heavier embossed bottles that command double-digit price premiums over standard returnables. Coca-Cola’s returnable-glass strategy is normalizing reverse logistics, which indirectly lifts cullet supply in Nigeria.[1]Nile Breweries, “Circular Packaging,” nilebreweries.com Food jars remain niche because import costs keep them 40% above local plastic alternatives, so volume expands chiefly where brands can justify the higher price. The driver, therefore, centers on premium beverages rather than mass-market food, reinforcing the need for flexible furnace scheduling that prioritizes bottle mix over sheer tonnage.
Rapid Premiumisation of Alcoholic Beverages
Craft distilleries and microbreweries across South Africa, Kenya, and Lagos are ordering custom molds with tactile finishes that smaller batch runs now make economical. Saverglass ships luxury bottles into the region, proving that African consumers are willing to pay for distinctive packaging when it conveys authenticity. Local furnaces that invest in quick mold changes gain an opportunity to capture margin that currently leaves the continent, and the trend should intensify as direct-to-consumer channels proliferate.
Sustainability Regulations Favoring Recyclable Packaging
South Africa enforced extended producer responsibility rules in 2021; Kenya followed in 2024; and Egypt is drafting similar measures that would bind producers to higher collection targets. Middle East Glass installed cullet treatment in Egypt, lowering virgin-batch costs and securing supply contracts with multinational brewers. Furnaces that co-invest in kerbside programs strengthen their license to operate, whereas laggards risk being delisted by customers that now mandate ISO 14001 certification.
Expansion of Pharmaceutical Fill-Finish Capacity
African Union initiatives identify twenty-four priority medicines that require Type I or Type III glass.[2]AUDA-NEPAD, “African Pharmaceutical Roadmap,” nepad.org Shandong Linuo purchased a controlling stake in Egypt’s European Ampoules Company in 2024, targeting synergies in borosilicate vials. Development-finance institutions such as the IFC have already backed energy-efficient furnaces to service vaccine bottling, signaling long-term demand for amber containers that guard light-sensitive formulations.[3]International Finance Corporation, “IFC Invests in Leading Glass Manufacturer,” ifc.org
Restraints Impact Analysis*
| Restraint | (~) % Impact on CAGR Forecast | Geographic Relevance | Impact Timeline |
|---|---|---|---|
| High Energy and Fuel Costs in African Furnaces | -0.9% | Nigeria, South Africa, Egypt | Short term (≤ 2 years) |
| Competition from Lightweight PET and Aluminum | -0.7% | Nigeria, Kenya, Egypt, broader Africa | Medium term (2-4 years) |
| Logistics Fragility and Breakage Losses | -0.4% | Rest of Africa (ex-South Africa, Egypt, Morocco) | Medium term (2-4 years) |
| Limited Region-Wide Cullet Collection | -0.3% | Sub-Saharan Africa (ex-South Africa, Kenya) | Long term (≥ 4 years) |
| Source: Mordor Intelligence | |||
High Energy and Fuel Costs in African Furnaces
Glass melting consumes up to 6 gigajoules per tonne, and operators struggle with gas price swings plus unreliable grids. Beta Glass rebuilt a furnace in 2025 but still relies on diesel generators during outages, inflating costs. Consol Glass installed solar and battery systems at Nigel, yet the retrofit added USD 24.3 million to post-acquisition spending. Electric or oxy-fuel melting could cut fuel bills, but each line requires capital outlays of at least USD 30 million, and returns remain uncertain without carbon credits.
Competition from Lightweight PET and Aluminum
A life-cycle study shows PET cuts package weight by 90% and aluminum reaches a 71% recycling rate, outpacing glass at 51%. Egyptian beverage portfolios have steadily migrated toward PET and cans, retaining glass only for flagship SKUs. Coca-Cola now recycles 40% of PET in Kenya, proving that plastics can close the loop when logistics become efficient. Unless bottles are lightweighted and recycled content increases, glass risks losing share in price-sensitive segments.
*Our forecasts treat driver/restraint impacts as directional, not additive. The impact forecasts reflect baseline growth, mix effects, and variable interactions.
Segment Analysis
By End-User: Beverages Anchor Volume, Cosmetics Drive Margin
Beverages dominated with 64.32% of 2025 volume, reflecting strong demand from beer, wine, and spirits producers. Alcoholic subcategories supplied an estimated 72% of beverage tonnage, while soft drinks faced faster PET substitution. The Africa container glass market size for beverages is projected to expand steadily as brewers premiumize packaging and returnable-glass loops mature. Cosmetics and personal care, though smaller, grow at a 5.43% CAGR through 2031, leveraging glass’s tactile feel and recyclability to justify premium positioning among urban consumers.
The cosmetic uptrend is concentrated in South Africa and Kenya, where indie beauty brands use dropper bottles, jars, and perfume flacons. Consol Glass serves this niche via retail outlets that sell in unit quantities to contract fillers. Pharmaceuticals and perfumery together account for roughly 8% of volume yet generate higher margins due to stringent dimensional tolerances and Type III or borosilicate compositions. As a result, the Africa container glass market rewards producers that balance high-volume beverage runs with agile short runs for specialty customers.


By Color: Flint Dominates, Amber Gains in Pharma and Spirits
Flint glass held 58.59% of 2025 output owing to its versatility across beverages, food, and cosmetics. The Africa container glass market share for flint benefits from scale efficiencies, yet amber glass is advancing at a 5.76% CAGR, propelled by pharmaceutical vials and premium spirits that require ultraviolet shielding. Green glass, long favored for wine and beer, represented 22% of 2025 tonnage but now faces headwinds as wineries trial lighter flint bottles and mainstream lagers shift to aluminum cans.
Specialty colors such as blue and black remain below 4% of production but yield higher margins. Tunisia’s SOTUVER, now 41% owned by BA Glass, can change colors within a single shift, capturing premium orders from luxury brands. Consequently, the Africa container glass market size split by color underscores a strategic decision, either chase large flint runs or invest in multi-color flexibility to secure artisanal and pharmaceutical business.

Geography Analysis
South Africa maintains leadership with a 44.21% share, anchored by Ardagh’s USD 617 million Consol Glass acquisition in 2022 and a ZAR 3 billion furnace upgrade at Nigel that boosts technical efficiency. The 2021 sustainability regulations improved cullet availability, trimming raw-material costs by up to 20% and enabling closed-loop recycling. Private-equity interest surfaced when Nampak sold its division to Isanti Glass, and another divestment process began in 2025, signaling ongoing reshuffling. Premium wine and craft-spirit producers increasingly demand embossed bottles and glow-in-the-dark inks that converters such as Rotolabel supply. As core beer volumes plateau, growth hinges on premiumisation and exports.
Egypt ranks second at 26%, supported by Middle East Glass’s 385,000-tonne capacity that doubled under Gulf Capital stewardship. Glass exports reached USD 442 million in the first ten months of 2025, led by shipments to Turkey, Brazil, and Spain. New investments include Dr. Greiche’s USD 16.1 million facility and China Glass Holding’s USD 300 million complex in the Suez Canal zone, both of which are broadening the country’s glass ecosystem. The government plans to earmark EGP 252.8 billion in 2025-2026 manufacturing outlays, with two-thirds reserved for non-petroleum industries, such as container glass. Combined, these factors position Egypt as a continental export hub, especially for pharmaceutical formats.
Morocco shows the fastest trajectory with a 5.89% CAGR, leveraging BA Glass’s 41% stake in Tunisia’s SOTUVER, which brings 630 tonnes per day and nine production lines under one network. Nigeria secures 15% of regional volume through Beta Glass, yet chronic energy uncertainty means growth relies on premiumisation rather than expansion. Kenya, Ghana, Ethiopia, and Tanzania together hold 11%, and Kenya’s 2024 EPR framework is improving cullet supply that could spark furnace upgrades, provided logistics hurdles are mitigated. Overall, the Africa container glass market demonstrates a hub structure in which established producers feed smaller economies until local demand justifies standalone furnaces.
Competitive Landscape
The top five companies held roughly 60% of installed capacity in 2025, a level that keeps rivalry moderate. Ardagh strengthened its foothold by absorbing Consol Glass for USD 617 million, then invested ZAR 3 billion at Nigel to add flexible production cells, cullet handling, and solar power. Middle East Glass, once backed by Gulf Capital, doubled its capacity to 385,000 tonnes and now exports to more than twenty-five countries, illustrating how private capital can scale regional champions. BA Glass entered North Africa through its USD 171 million stake in SOTUVER, integrating luxury-bottle lines that feed European markets.
White-space opportunities persist in short runs for digitally native craft brands, Type I borosilicate vials, and lightweight bottles that cut freight costs. Shandong Linuo’s 2024 acquisition of Egypt’s European Ampoules Company signals Chinese interest in the pharmaceutical niche. Technology adoption remains uneven, only a handful of furnaces are ready for electric or oxy-fuel melting because each conversion costs at least USD 30 million. Operators that secure long-term gas contracts, automate mold changes, and co-invest in cullet collection will be best placed to defend their share as the Africa container glass market evolves.
Isanti Glass, formerly Nampak, highlights beverage brands' focus on securing supplies and ensuring furnace uptime. Beta Glass strengthens its position through debottlenecking and custom designs but faces higher costs due to diesel reliance during grid outages. New entrants like China Glass Holding, targeting float and photovoltaic markets, may retrofit their Suez Canal furnaces for container production, adding competition. Sustainability is key, with Middle East Glass operating Egypt's only full cullet-treatment line and Ardagh's South African plants using solar power and battery storage. Future leadership will depend on energy resilience, recycling, and customer adaptability.
Africa Container Glass Industry Leaders
Ardagh Group S.A.
Beta Glass Plc
United Glass Containers Company (UGC)
Societe dExploitation de Verrerie Au Maroc (SEVAM)
Middle East Glass Manufacturing Company
- *Disclaimer: Major Players sorted in no particular order

Recent Industry Developments
- July 2025: Beta Glass doubled its dividend to NGN 1.76 billion following a strong profit surge, highlighting resilience despite high fuel costs.
- July 2025: Egypt’s Ministry of Industry opened Al-Arabi Group’s USD 25 million architectural-glass plant, adding 2 million m² capacity and 300 jobs.
- April 2025: Dr. Greiche Group committed EGP 500 million to a new glass complex in Egypt, expanding both container and architectural output.
- March 2025: BA Glass acquired a 41% stake in Tunisia’s SOTUVER for USD 171 million, consolidating 630 tonnes per day of capacity.


Africa Container Glass Market Report Scope
Glass containers, such as bottles and jars, are hollow vessels designed primarily for holding and storing various items, particularly food and beverages. Container glass is used in the alcoholic and non-alcoholic beverage industries due to its ability to maintain chemical inertness, sterility, and non-permeability. Glass packaging is valued for its unique properties, including its transparency, inertness, and ability to preserve the quality and integrity of its contents. It is often chosen for products where purity, safety, and environmental sustainability are paramount concerns.
The Africa Container Glass Industry Report is Segmented by End-user (Beverages [Alcoholic: Beer, Wine, Spirits, Other Alocholic Beverages; Non-Alcoholic: Juices, CSDs, Dairy Based Drinks, Other Non Alcoholic Beverages], Food, Cosmetics and Personal Care, Pharmaceuticals, and Perfumery), Color (Flint, Amber, Green, and Other Colors), and Country (South Africa, Egypt, Nigeria, Morocco, Tunisia, Rest of Africa). The Market Forecasts are Provided in Terms of Volume (Thousand Kilotons).
| Beverages | Alcoholic | Beer |
| Wine | ||
| Spirits | ||
| Other Alcoholic Beverages (Cider and Other Fermented Drinks) | ||
| Non-Alcoholic | Juices | |
| Carbonated Drinks (CSDs) | ||
| Dairy-based Drinks | ||
| Other Non-Alcoholic Beverages | ||
| Food (Jam, Jelly, Marmalades, Honey, Sausages and Condiments, Oil, Pickles) | ||
| Cosmetics and Personal Care | ||
| Pharmaceuticals (excluding Vials and Ampoules) | ||
| Perfumery | ||
| Flint |
| Amber |
| Green |
| Other Colors |
| South Africa |
| Egypt |
| Nigeria |
| Morocco |
| Tunisia |
| Rest of Africa |
| By End-user | Beverages | Alcoholic | Beer |
| Wine | |||
| Spirits | |||
| Other Alcoholic Beverages (Cider and Other Fermented Drinks) | |||
| Non-Alcoholic | Juices | ||
| Carbonated Drinks (CSDs) | |||
| Dairy-based Drinks | |||
| Other Non-Alcoholic Beverages | |||
| Food (Jam, Jelly, Marmalades, Honey, Sausages and Condiments, Oil, Pickles) | |||
| Cosmetics and Personal Care | |||
| Pharmaceuticals (excluding Vials and Ampoules) | |||
| Perfumery | |||
| By Color | Flint | ||
| Amber | |||
| Green | |||
| Other Colors | |||
| By Country | South Africa | ||
| Egypt | |||
| Nigeria | |||
| Morocco | |||
| Tunisia | |||
| Rest of Africa | |||


Key Questions Answered in the Report
What is the current size of the Africa container glass market?
It reached 4.99 thousand kilotons in 2026 and is forecast to hit 6.36 thousand kilotons by 2031.
Which end-user segment is growing fastest within the Africa container glass market?
Cosmetics and personal care expands at a 5.43% CAGR through 2031, outpacing beverages.
Why is amber glass demand rising in Africa?
Pharmaceutical vials and premium spirits need ultraviolet protection, driving a 5.76% CAGR for amber containers.
Which country shows the highest growth rate in African container glass production?
Morocco leads with a projected 5.89% CAGR through 2031 as BA Glass integrates SOTUVER capacity.
How concentrated is competition among African container glass producers?
The five largest players hold about 60% of installed capacity, giving the market a moderate concentration score of 6.
What key restraint threatens profitability for African glass furnaces?
High energy and fuel costs, especially in Nigeria and South Africa, remain the most immediate cost pressure.
Page last updated on:


