Kenya Container Glass Market Size and Share
Market Overview
| Study Period | 2020 - 2031 |
|---|---|
| Forecast Data Period | 2026 - 2031 |
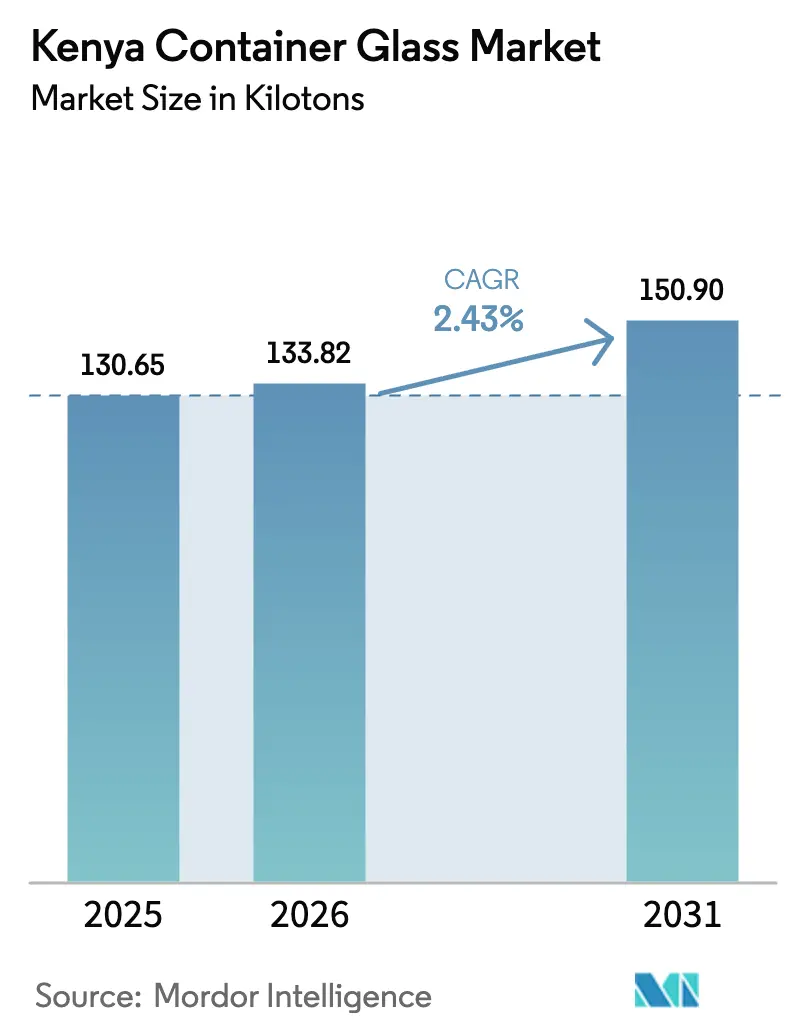
| Base Year Market Size (2025) | 130.65 kilotons |
| Market Volume (2026) | 133.82 kilotons |
| Market Volume (2031) | 150.9 kilotons |
| Growth Rate (2026 - 2031) | 2.43% CAGR |
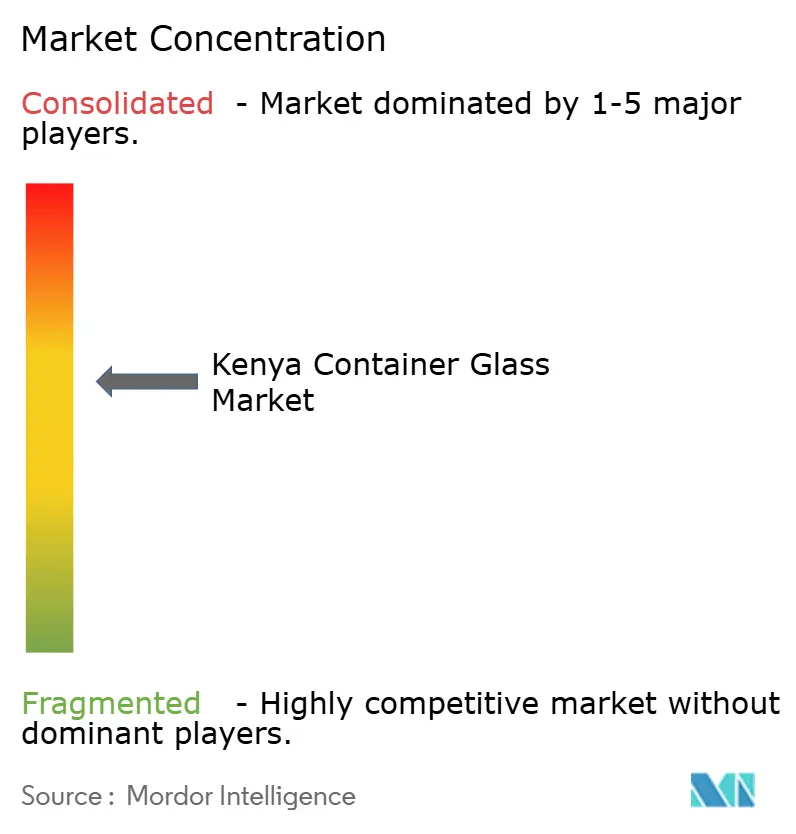
| Market Concentration | Medium |
Major Players *Disclaimer: Major Players sorted in no particular order Image © Mordor Intelligence. Reuse requires attribution under CC BY 4.0. | |
Kenya Container Glass Market Analysis by Mordor Intelligence
The Kenya container glass market size is expected to grow from 130.65 kilotons in 2025 to 133.82 kilotons in 2026 and is forecast to reach 150.9 kilotons by 2031 at 2.43% CAGR over 2026-2031. Demand growth tracks Kenya’s steady shift toward premium, circular packaging, even as elevated power tariffs and rising import volumes from Egypt and Tanzania squeeze domestic margins. Regulatory momentum, including the May 2025 rollout of Extended Producer Responsibility (EPR) rules, strengthens the glass value proposition by mandating end-of-life management and incentivizing the development of recycling infrastructure. Urbanization and retail footprint expansion in Nairobi and Mombasa lift on-premise beverage consumption, while e-commerce proliferation boosts demand for protective, high-quality packaging, especially for cosmetics and premium food categories.[1]The Coca-Cola Company, “The Coca-Cola System in Kenya Announces Major Investment,” coca-colacompany.com Concurrently, strong alcoholic-beverage output underpins base-level volume, evidenced by East African Breweries’ 15% domestic sales growth in 2024 and its collection of more than 17 million spirit bottles for recycling. Foreign direct investment in low-carbon furnaces and process automation remains critical for containing energy costs and sustaining competitiveness amid a national tariff of about KES 21 (USD 0.16) per kWh—five times Ethiopia’s rate.
Key Report Takeaways
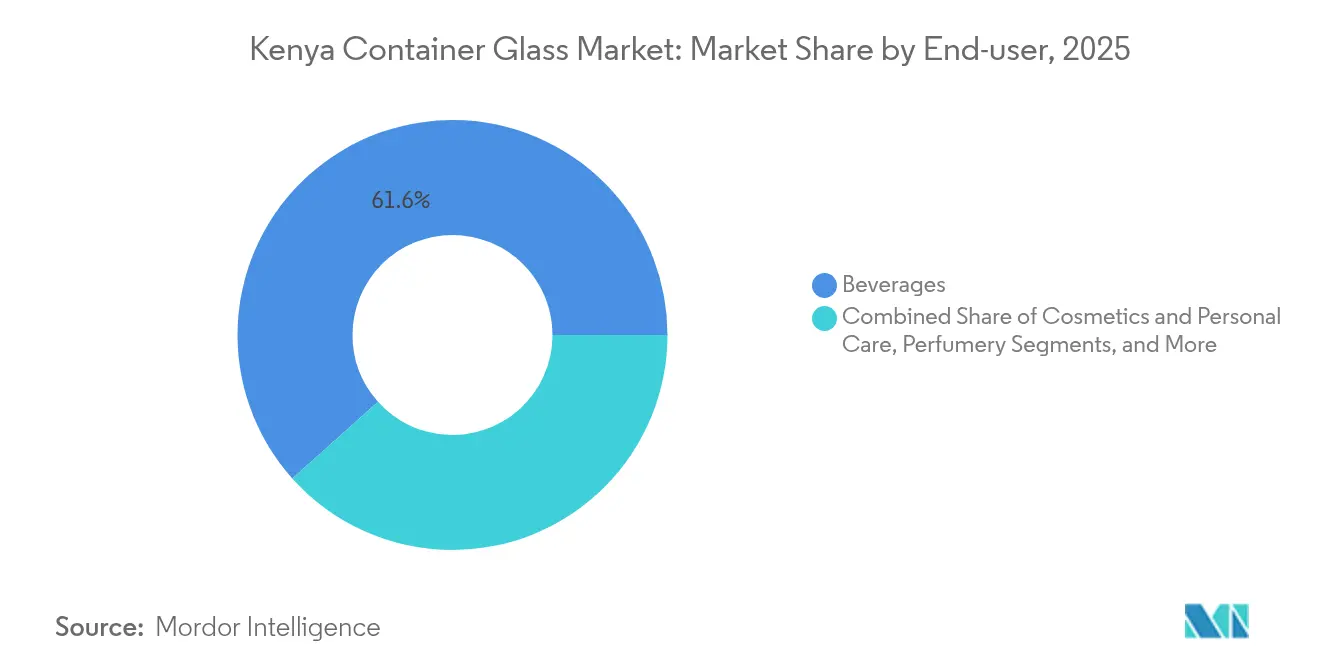
- By end-user, beverages captured 61.62% of the Kenya container glass market share in 2025.
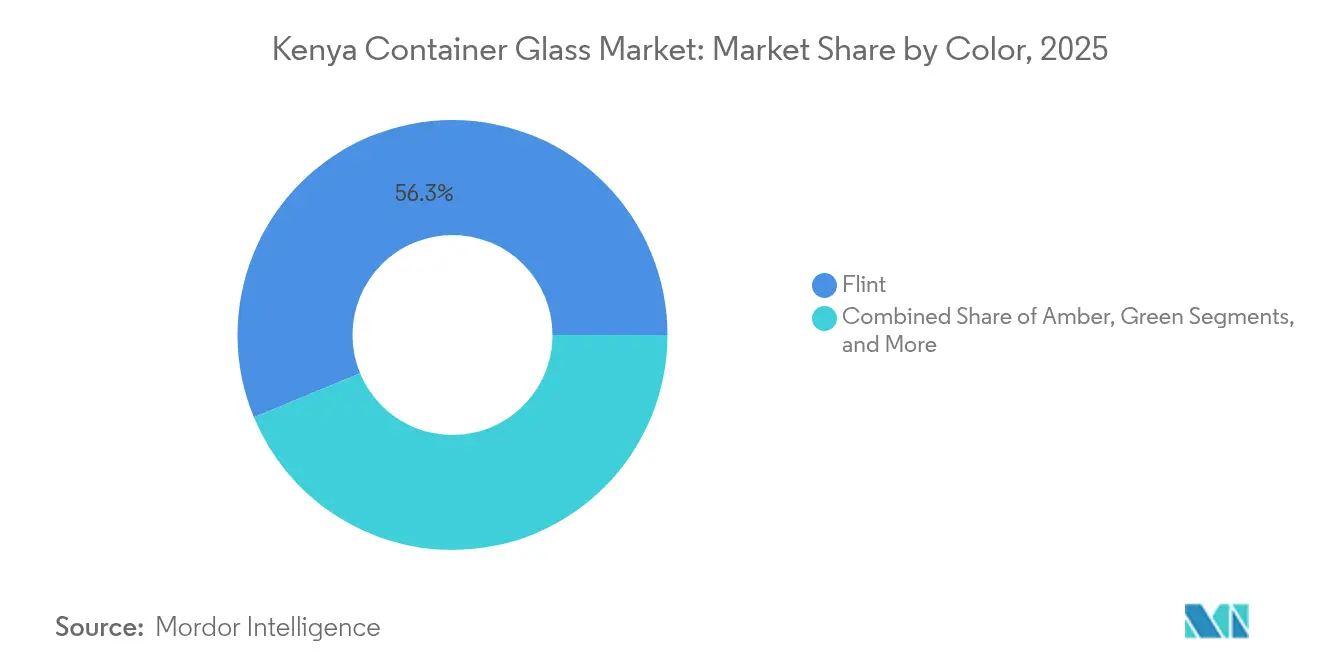
- By color, the Kenya container glass market size for the amber segment is projected to grow at a 3.61% CAGR between 2026-2031.
Note: Market size and forecast figures in this report are generated using Mordor Intelligence’s proprietary estimation framework, updated with the latest available data and insights as of 2026.
Kenya Container Glass Market Trends and Insights
Drivers Impact Analysis*
| Driver | (~) % Impact on CAGR Forecast | Geographic Relevance | Impact Timeline |
|---|---|---|---|
| Retail Expansion and Urbanization Accelerating On-premise Beverage Sales | +0.8% | National, with concentration in Nairobi and Mombasa | Medium term (2-4 years) |
| Rising Consumer Sustainability Awareness Favoring Glass Packaging | +0.6% | Urban centers, expanding to secondary cities | Long term (≥ 4 years) |
| Strong Growth of Domestic Alcoholic Beverage Production | +0.5% | National, with regional export spillover | Medium term (2-4 years) |
| Rapid Expansion of E-Commerce Requiring Premium Protective Packaging | +0.3% | Urban areas, Nairobi metropolitan region | Short term (≤ 2 years) |
| Government Ban on Single-use Plastics Boosting Glass Adoption | +0.4% | Protected areas expanding to national scope | Medium term (2-4 years) |
| Foreign Direct Investment in Low-Carbon Furnaces Enhancing Supply | +0.2% | Industrial zones, Naivasha and Mombasa corridors | Long term (≥ 4 years) |
| Source: Mordor Intelligence | |||
Retail Expansion and Urbanization Accelerating On-premise Beverage Sales
Kenya’s urban population continues to grow faster than its rural counterpart, creating concentrated demand for branded beverages packaged in returnable glass bottles. Coca-Cola’s pledge to invest up to USD 175 million in production and cold-chain assets through 2029 underscores its confidence in the growth of organized retail and modern trade penetration. Supermarket chains such as Quickmart and Naivas are scaling shelf space dedicated to premium glass-packaged beer, spirits, juice, and specialty water lines. As retail clusters expand to Kisumu, Eldoret, and Nakuru, glass visibility increases, reinforcing consumer perceptions of quality and safety. Breweries respond by expanding their product lines to include premium returnable glass, while casual dining venues adopt glass serviceware to align with sustainability and brand-image objectives.
Rising Consumer Sustainability Awareness Favoring Glass Packaging
Kenya’s EPR rules, effective May 2025, obligate producers to finance post-consumer collection, sorting, and recycling, with a focus on glass due to its infinite recyclability.[2]Sustainable Packaging Middle East and Africa, “Kenya’s Extended Producer Responsibility regulations to take effect on May 5 2025,” sustainabilitymea.com The Kenya Plastics Pact, endorsed by the government, aims to eliminate problematic plastics by 2030, promoting a shift in corporate preference towards glass in cosmetics, nutraceuticals, and gourmet food applications. Surveys from local retailers show growing willingness among middle-income shoppers to pay premiums of up to 8% for eco-friendly packaging. Brands leverage the narrative in marketing communication, positioning glass as a safe, chemical-free, and endlessly recyclable solution. Producer Responsibility Organizations (PROs), funded by beverage companies, expand bottle-buyback centers, further reinforcing their circular-economy credentials.
Strong Growth of Domestic Alcoholic Beverage Production
East African Breweries achieved a 1.2% volume increase across its regional footprint in fiscal 2024, with Kenya contributing the bulk of the gains in spirits and beer sales.[3]East African Breweries PLC, “2024 Integrated Report and Financial Statements,” eabl.com Duty remission on raw materials and tax incentives for low-alcohol beers spur product innovation that leans heavily on glass for product integrity. Craft breweries such as 254 Brewing and Sierra Premium remain glass-only, citing the advantages of flavor retention and premium positioning. Regional integration under COMESA and the African Continental Free Trade Area enhances export potential for Kenyan-made beverages, increasing furnace run-rates and demand for standard bottle formats. Recycling programs, such as Project Rudisha, channel recovered bottles back into circulation, improving container availability and lowering unit costs.
Rapid Expansion of E-Commerce Requiring Premium Protective Packaging
Kenya’s e-commerce sector experienced a 25% year-on-year growth in online gross merchandise volume in 2024, driven by improvements in digital payments and the expansion of motorcycle courier networks. Direct-to-consumer cosmetics and artisanal food brands prioritize glass jars and bottles to deliver a premium unboxing experience while minimizing contamination risks. Fulfillment centers near Nairobi’s Jomo Kenyatta International Airport require robust packaging that withstands the complex last-mile routes. Lighter-weight glass designs lower freight costs without compromising durability, a trend accelerated by Ardagh’s introduction of narrow-neck press-and-blow technology in its Nairobi plant. These attributes strengthen glass’s value proposition versus rigid plastics in high-margin product lines.
Restraints Impact Analysis*
| Restraint | (~) % Impact on CAGR Forecast | Geographic Relevance | Impact Timeline |
|---|---|---|---|
| High Production Costs from Energy-Intensive Furnaces | -0.7% | National, affecting all production facilities | Short term (≤ 2 years) |
| Price Competition from Cheaper PET and HDPE Packaging | -0.5% | National, with stronger impact in price-sensitive segments | Medium term (2-4 years) |
| Intermittent Power Supply Disrupting Continuous Furnace Operations | -0.4% | National grid-dependent areas | Short term (≤ 2 years) |
| Limited Domestic Silica Sand Sources Increasing Raw Material Imports | -0.3% | National production, affecting cost structures | Long term (≥ 4 years) |
| Source: Mordor Intelligence | |||
High Production Costs from Energy-Intensive Furnaces
Industrial electricity tariffs average KES 21 (USD 0.16) per kWh in 2025, compared to KES 4 (USD 0.031) per kWh in Ethiopia, widening a cost gap that erodes the competitiveness of the Kenya container glass market. Glass furnaces require 24-hour baseload power; any interruption threatens furnace integrity and drives costly rebuilds. Energy accounts for roughly 30% of ex-factory bottle costs, forcing producers to consider relocation to lower-cost grids or invest in captive solar and waste-heat recovery. While Kenya’s grid hits 90% renewable penetration, high network losses (23%) and premium industrial bands keep delivered tariffs elevated. A cap-and-trade proposal on carbon may raise fuel-oil prices further, adding to margin pressure.
Price Competition from Cheaper PET and HDPE Packaging
Lightweight PET bottles undercut glass by up to 40% on a unit-cost basis in mass-market carbonated drinks and edible oil categories. Freight cost advantages attributable to plastic’s lower weight extend the delivered-price differential in inland counties such as Turkana and Garissa. Multinational beverage players are diversifying into PET to cater to price-sensitive consumer segments, thereby slowing the penetration of glass despite its recycling credentials. Although EPR fees on plastics narrow the gap, the Kenya container glass market must still position itself as a premium, sustainable alternative rather than a cost-parity substitute. Ongoing consumer education drives and bottle-deposit incentives partially mitigate substitution threats.
*Our forecasts treat driver/restraint impacts as directional, not additive. The impact forecasts reflect baseline growth, mix effects, and variable interactions.
Segment Analysis
By End-User: Beverages Sustain Volume Leadership, Cosmetics Accelerate Upside
Beverages accounted for 61.62% of the Kenya container glass market share in 2025, primarily driven by high-volume beer and spirits production, which is linked to East African Breweries’ regional dominance. This segment’s scale ensures furnace utilization levels necessary for cost absorption, while standard bottle molds facilitate returnable-bottle logistics and lower per-unit carbon footprints. Across the beer industry, glass remains obligatory for on-premise channels, and premium craft brewers exclusively use flint and amber bottles for product integrity. Spirits favor heavier glass designs to emphasize quality cues in duty-free and urban retail outlets. Non-alcoholic beverages such as juices and craft sodas extend demand into adjacent categories, targeting health-conscious consumers.
Cosmetics and personal care are the fastest-growing sub-sectors, with a 3.08% CAGR through 2031, driven by urban middle-class expansion and digital beauty retail. Glass dropper bottles and jars effectively preserve active ingredients, providing premium shelf appeal crucial to the skincare and fragrance categories. Local contract fillers collaborate with fragrance houses from South Africa and France, requiring smaller-run, high-quality glass containers. Kenya's container glass market size for cosmetics benefited directly as international brands select Nairobi as their East African hub, driving demand for locally sourced flint bottles that reduce lead times. Pharmaceuticals and food each maintain steady mid-single-digit growth, leveraging glass’s barrier properties and compatibility with hot-fill processes, while perfumery remains niche but lucrative with high average selling prices per unit.


By Color: Flint Dominates Shelf Presence, Amber Outpaces on Protection
Flint glass held 56.25% of the Kenya container glass market size in 2025, providing transparency that showcases product color and purity in beverages, cosmetics, and gourmet foods. Standardized flint bottle designs enable fast changeovers, optimizing furnace uptime and inventory management. The Kenyan container glass market benefits from rising demand for clear packaging in artisanal jams, cold-pressed juices, and scented candles sold through e-commerce platforms. Flint’s recyclability also aligns with EPR mandates, simplifying color sorting for reclaimers.
Amber glass is projected to expand at a 3.61% CAGR from 2026-2031, outpacing the broader Kenya container glass market due to superior light-blocking capabilities valued by pharmaceutical and premium beer producers. Growth accelerates as Kenya positions itself as a regional pharmaceutical manufacturing hub under the East African Community’s localization agenda. Craft breweries like Bateleur leverage amber bottles to differentiate limited-edition IPAs, citing flavor stability and brand heritage. Green glass retains a foothold in mainstream beer, while cobalt and other specialty colors remain confined to niche spirits and fragrance lines where distinctiveness outweighs incremental color-sorting costs.
Geography Analysis
Kenya's container glass market demand clusters around Nairobi, Mombasa, and Nakuru, which collectively account for more than 70% of beverage production volume and nearly all cosmetics filling operations. Nairobi’s industrial zones host East African Breweries’ main brewery and Ardagh Glass Packaging Kenya Limited’s furnace, creating a vertically integrated supply chain with minimal lead times. Mombasa’s proximity to Port Reitz simplifies silica-sand imports and soda-ash exports, sustaining a steady flow of raw materials even during inland transport disruptions. Nakuru’s nascent industrial park is situated near soda-ash reserves in Magadi, which could potentially reduce freight costs for flux materials.
Regional export dynamics play a pivotal role in the Kenya container glass market. Central Glass Industries ships over 50% of its output to Uganda, Rwanda, and Burundi, leveraging duty-free access under. However, competition from Tanzania’s Kioo Ltd and Egypt’s subsidized manufacturers exerts downward price pressure, necessitating differentiation through quality and service reliability. Currency volatility, particularly the depreciation of the Kenyan shilling against the U.S. dollar, increases the cost of imported cullet and machinery spares, affecting furnace maintenance cycles.
Rising urbanization fuels consumption hubs beyond the capital. Kisumu and Eldoret are witnessing growth in bottled beer and premium juice sales, supported by improved logistics via the upgraded Standard Gauge Railway that reduces Nairobi-Kisumu transit time to eight hours. As inland demand deepens, smaller depots stock returnable bottles, lowering backhaul costs for producers. Nevertheless, intermittent grid reliability outside major metros poses operational risk for continuous-process furnaces, highlighting the need for embedded power solutions or redundant capacity.
Competitive Landscape
Kenya's container glass market is moderately concentrated, with the top five producers controlling an estimated 65% of national capacity. This concentration is led by Ardagh Glass Packaging Kenya Limited, following Ardagh Group’s 2022 USD 1 billion acquisition of Consol Holdings. Ardagh leverages global technical expertise to introduce lighter-weight bottles and automated inspection, reducing defect rates to below 0.5%. Local player Milly Glass Works operates a Malindi-based furnace but faces high fuel-oil prices and competition from Egyptian imports, which are priced 12% lower at the landed cost. Central Glass Industries focuses on the regional export niche, capitalizing on decades-long distribution partnerships with Ugandan breweries.
Strategic moves emphasize circularity and energy efficiency. Ardagh’s Money4Glass program incentivizes community-level cullet collection through mobile money payouts, raising furnace cullet ratios to 55% and reducing specific energy consumption. East African Breweries collaborates with recyclers based in Kisumu through Project Rudisha, retrieving spirit bottles and reintegrating them into the supply chain, thereby reducing procurement costs and enhancing the brand image. Meanwhile, foreign investors are exploring low-carbon oxy-fuel furnace retrofits in Naivasha’s industrial park, targeting a 20% reduction in energy intensity once commercialized in 2027.
Technology licensing and design innovation offer further avenues for differentiation. Kenya Industrial Property Institute records show a rise in proprietary bottle-shaping patents filed by beverage and cosmetic companies, signaling growing aesthetic competition. Automated forming machines with in-line digital vision systems now achieve speeds of 500 bottles per minute, improving throughput and reducing labor per unit. However, capital intensity and a depreciating shilling create barriers for smaller entrants, reinforcing the existing market hierarchy.
Kenya Container Glass Industry Leaders
Milly Glass Works Ltd
Arichem Limited
Ardagh Glass Packaging–Africa (AGP–A)
Vivek Investments Ltd
Kitengela Hot Glass Ltd.
- *Disclaimer: Major Players sorted in no particular order

Recent Industry Developments
- May 2025: Kenya’s EPR regulations take effect, requiring container-glass producers and importers to register with the National Environment Management Authority and finance end-of-life waste management systems.
- October 2024: Ardagh Group’s Money4Glass initiative in Africa marks its first anniversary, highlighting progress on cullet collection programs.
- September 2024: East African Breweries confirms the recovery of more than 17 million spirit bottles through Project Rudisha.
- May 2024: The Coca-Cola System announces up to USD 175 million investment in Kenya over five years to expand filling and cold-chain capacity.


Kenya Container Glass Market Report Scope
Glass Containers refer to clean bottles and jars made from glass. The scope excludes windows and other non-container glass products. Container glass is used in the alcoholic and non-alcoholic beverage industries due to its ability to maintain chemical inertness, sterility, and non-permeability. Glass packaging is valued for its unique properties, including its transparency, inertness, and ability to preserve the quality and integrity of its contents.
Kenya Container Glass Market is segmented by end-user vertical (beverages [alcoholic beverages (beer, wine, spirits, and other alcoholic beverages {cider and other fermented drinks}), non-alcoholic beverages (juices, carbonated drinks (CSDs), dairy product-based drinks, other non-alcoholic beverages)], food [jam, jelly, marmalades, honey, sausages and condiments, oil, pickles], cosmetics and personal care, pharmaceuticals (excluding vials and ampoules), and perfumery, and by color (green, amber, flint and other colors). The market sizes and forecasts are provided in terms of volume (kilotons) for all the above segments.
| Beverages | Alcoholic | Beer |
| Wine | ||
| Spirits | ||
| Other Alcoholic Beverages (Cider and Other Fermented Drinks) | ||
| Non-Alcoholic | Juices | |
| Carbonated Drinks (CSDs) | ||
| Dairy Product Based Drinks | ||
| Other Non-Alcoholic Beverages | ||
| Food (Jam, Jelly, Marmalades, Honey, Sausages and Condiments, Oil, Pickles) | ||
| Cosmetics and Personal Care | ||
| Pharmaceuticals (excluding Vials and Ampoules) | ||
| Perfumery | ||
| Green |
| Amber |
| Flint |
| Other Colors |
| By End-user | Beverages | Alcoholic | Beer |
| Wine | |||
| Spirits | |||
| Other Alcoholic Beverages (Cider and Other Fermented Drinks) | |||
| Non-Alcoholic | Juices | ||
| Carbonated Drinks (CSDs) | |||
| Dairy Product Based Drinks | |||
| Other Non-Alcoholic Beverages | |||
| Food (Jam, Jelly, Marmalades, Honey, Sausages and Condiments, Oil, Pickles) | |||
| Cosmetics and Personal Care | |||
| Pharmaceuticals (excluding Vials and Ampoules) | |||
| Perfumery | |||
| By Color | Green | ||
| Amber | |||
| Flint | |||
| Other Colors | |||


Key Questions Answered in the Report
How large is the Kenya container glass market in 2026?
The market stands at 133.82 kilotons in 2026 and is projected to reach 150.9 kilotons by 2031, reflecting a 2.43% CAGR.
Which end-user segment dominates glass consumption in Kenya?
Beverages lead with 61.62% of national volume, driven by beer and spirits production.
What is driving growth in cosmetics-related glass packaging?
Urban middle-class expansion and online beauty retail push cosmetics and personal care to a 3.08% CAGR through 2031.
Why is amber glass growing faster than other colors?
Amber’s light-protection benefits make it the preferred choice for pharmaceuticals and premium craft beverages, supporting a 3.61% CAGR.
How do Kenya’s EPR regulations affect glass packaging producers?
From May 2025, producers must finance collection and recycling, favoring infinitely recyclable glass and encouraging investment in cullet infrastructure.
What challenges do local glass manufacturers face?
High electricity tariffs of about KES 21 per kWh and competition from lower-cost PET and imported glass constrain margins and growth.
Page last updated on:


