Panama Container Glass Market Size and Share
Market Overview
| Study Period | 2020 - 2031 |
|---|---|
| Forecast Data Period | 2026 - 2031 |
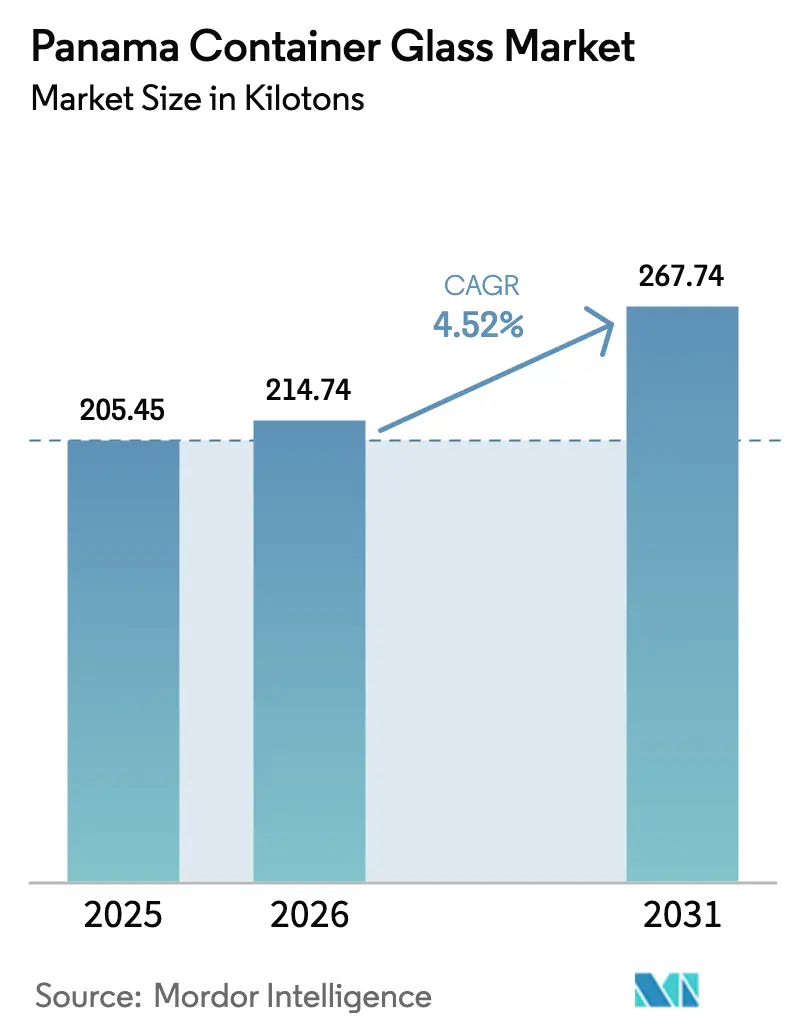
| Base Year Market Size (2025) | 205.45 kilotons |
| Market Volume (2026) | 214.74 kilotons |
| Market Volume (2031) | 267.74 kilotons |
| Growth Rate (2026 - 2031) | 4.52% CAGR |
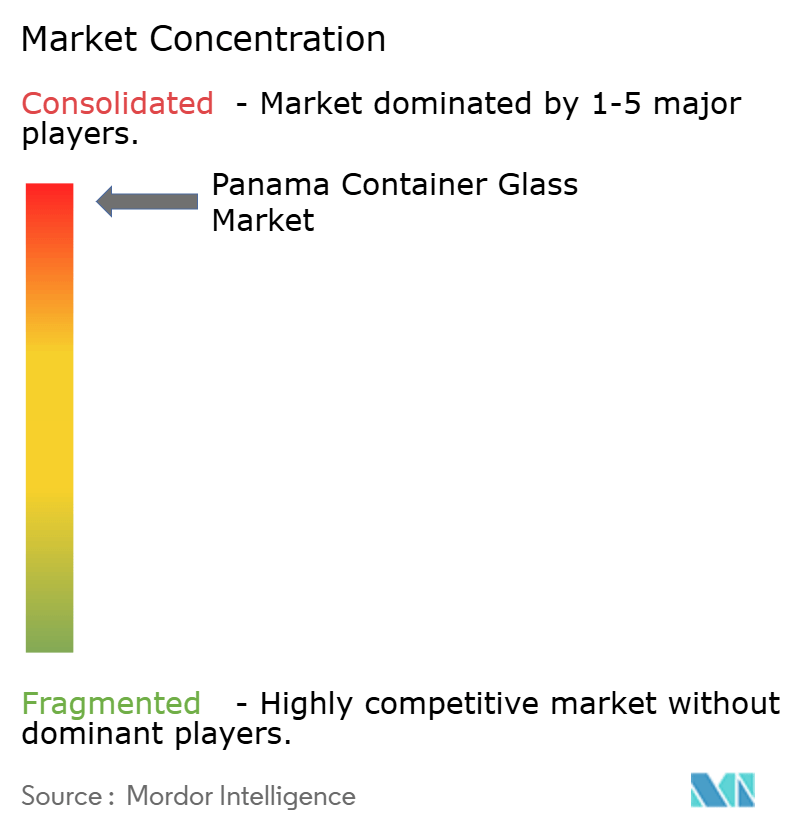
| Market Concentration | High |
Major Players *Disclaimer: Major Players sorted in no particular order Image © Mordor Intelligence. Reuse requires attribution under CC BY 4.0. | |
Panama Container Glass Market Analysis by Mordor Intelligence
The Panama container glass market size was valued at 205.45 kilotons in 2025 and estimated to grow from 214.74 kilotons in 2026 to reach 267.74 kilotons by 2031, at a CAGR of 4.52% during the forecast period (2026-2031). Expansion is underpinned by Panama’s role as a logistics hub, rising food-and-beverage exports, modernized pharmaceutical regulations, and government-backed recycling mandates that favor glass cullet use. Sustained foreign investment in bottling operations, long-term renewable-energy contracts for industrial users, and craft beverage premiumization further reinforce volume growth. Producers tap duty-free raw-material imports via the Colon Free Zone, lowering landed costs and enabling competitive regional distribution.[1]Colon Free Trade Zone, “Colon Free Zone,” colonfreetradezone.com Meanwhile, substitution risk from PET and aluminum is contained in premium segments where barrier performance and brand positioning keep glass indispensable.
Key Report Takeaways
- By end-user, beverages captured 67.62% of the Panama container glass market share in 2025.
- By color, the Panama container glass market for amber glass is projected to grow at a 5.32% CAGR between 2026-2031.
Note: Market size and forecast figures in this report are generated using Mordor Intelligence’s proprietary estimation framework, updated with the latest available data and insights as of 2026.
Panama Container Glass Market Trends and Insights
Drivers Impact Analysis*
| Driver | % Impact on CAGR Forecast | Geographic Relevance | Impact Timeline |
|---|---|---|---|
| Food and beverage export-led demand growth | +1.2% | National (Colon Free Zone focus) | Medium term (2-4 years) |
| Government recycling and sustainability mandates | +0.8% | National (Panama City pilots) | Long term (≥ 4 years) |
| Pharmaceutical packaging safety standards | +0.6% | National | Short term (≤ 2 years) |
| Colon Free Zone expansion enabling bulk trade | +0.7% | Regional (Central America and Caribbean) | Medium term (2-4 years) |
| Craft rum and artisanal beverage boom | +0.4% | National | Medium term (2-4 years) |
| EPR law accelerating closed-loop recycling investment | +0.5% | National | Long term (≥ 4 years) |
| Source: Mordor Intelligence | |||
Food and beverage export-led demand growth
The Colon Free Zone channels more than USD 5 billion in yearly trade to 525 million consumers, enabling bottlers to consolidate production and drive predictable glass call-offs. Coca-Cola FEMSA’s 177.0 million unit cases shipped from its Central America South cluster in 2024 illustrate scale, while a 35.3% share of refillable presentations underlines continued reliance on returnable glass.[2]Coca-Cola FEMSA, “Form 20-F 2024,” coca-colafemsa.com Export-oriented rum producers such as Diplomático meet varied destination-market standards, pushing suppliers to deliver specialized bottle designs with embossing and tamper-evident finishes. As regional beverage makers co-locate in Panama to exploit duty-free logistics, order volumes become large enough to justify furnace upgrades, fostering economies of scale.
Government recycling and sustainability mandates
Law 223 offers tax credits to material recovery firms, while a planned 300,000-ton sorting facility in Panama City aims to lift glass recovery above the current 2% separation rate. Municipal zero-waste policies, reinforced by World Bank and IDB funding, incentivize manufacturers to integrate cullet, cutting sand use and furnace energy by up to 30%. Glassmakers aligned with these mandates lock in cost advantages and mitigate regulatory risk as EPR rules tighten.
Pharmaceutical packaging safety standards
Law 419/2024 modernizes pharma oversight, mandating chemically inert containers, serialized tracking, and Spanish labeling for all health products. Executive Decree 2/2025 speeds approval of medicines vetted by WHO-listed agencies, pulling overseas brands into the market and enlarging demand for type I flint vials. Institutional tenders from the Social Security Fund amplify volumes, creating a defensible, premium niche for compliant suppliers.
Colon Free Zone expansion enabling bulk trade
Five ocean ports, a trans-isthmian rail line, and warehouse rent as low as USD 0.40 per m² per month reduce landed costs for heavy glass shipments. Duty-free import of silica and soda ash further compresses input expenses, letting manufacturers meet regional orders on a just-in-time basis. New quay cranes and cold-ironing power upgrades shorten vessel turnaround, reinforcing Panama’s status as a regional staging ground for container glass distribution.
Restraints Impact Analysis*
| Restraint | (~) % Impact on CAGR Forecast | Geographic Relevance | Impact Timeline |
|---|---|---|---|
| PET and can substitution | -1.1% | National (cost-sensitive SKUs) | Short term (≤ 2 years) |
| Volatile energy costs | -0.9% | National (furnace-intensive sites) | Medium term (2-4 years) |
| Skilled labor shortages in furnace maintenance | -0.6% | National (technical roles) | Long term (≥ 4 years) |
| Limited rural cullet collection | -0.4% | Rural zones | Long term (≥ 4 years) |
| Source: Mordor Intelligence | |||
PET and can substitution
PET container weight advantages translate into lower freight spend, and aluminum’s portability fits on-the-go trends. Coca-Cola FEMSA processed 31.5 kilotons of recycled PET in 2024, signaling enduring plastic commitment despite a 32.5% resin price hike that year. Glass therefore concentrates on premium beverages and refills where sensory integrity and brand heritage outweigh cost. Export shipments exacerbate the challenge, as glass weight inflates freight rates, urging producers to prioritize high-margin segments.
Volatile energy costs
Furnaces running at 2,732 °F account for up to 20% of unit costs. Panama’s electricity rose 33.5% between 2021 and mid-2024, while natural-gas prices jumped 43.2%, compressing margins for smaller plants. Long-term renewable contracts through 2046 promise stability yet necessitate multi-million-dollar retrofits. Players with oxygen-fuel or waste-heat recovery already installed can weather spikes; those without risk consolidation or exit.
*Our forecasts treat driver/restraint impacts as directional, not additive. The impact forecasts reflect baseline growth, mix effects, and variable interactions.
Segment Analysis
By End-user: Beverages dominate but specialty categories gain ground
The beverages segment accounted for 67.62% of the Panama container glass market in 2025, underscoring the bottling sector’s influence on furnace throughput. Returnable bottles support circularity targets and extend asset life up to 40 trips, securing predictable cullet supply for remelt. Alcoholic beverages, led by rum exports of USD 24.54 million in 2022, pull premium flint and embossed bottles that lift average selling prices by 12-15%.
Cosmetics and personal care, while currently a minor volume slice, is projected to post a 5.62% CAGR and grab share as high-end regional brands choose glass for luxury cues. Pharmaceutical buyers tendering under Law 419/2024 specify flint or amber vials with tamper-evident finishes, anchoring a resilient premium segment. Food applications use jars for gourmet condiments targeting tourists transiting Tocumen International Airport’s duty-free clusters, reinforcing small-batch demand patterns.


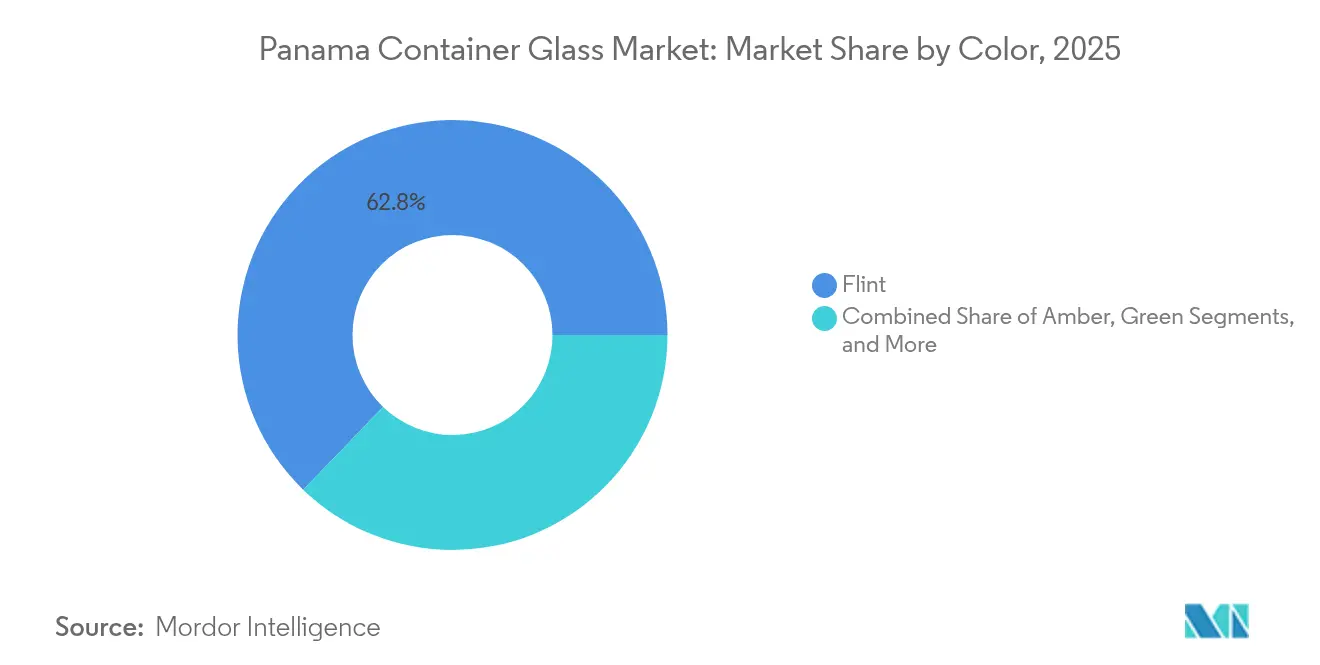
By Color: Flint leads; amber posts fastest gains
Flint captured 62.78% of 2025 volume, making it the largest contributor to the Panama container glass market size at 128.98 kilotons. Clear visibility, chemical inertness, and premium shelf appeal support its dominance in pharma, spirits, and fragrances. Glassmakers maintain stringent iron-oxide thresholds below 0.05% to secure high clarity demanded by brand owners.
Amber, growing at 5.32% CAGR, benefits from UV-blocking capability necessary for light-sensitive formulations such as craft rum, essential oils, and certain antibiotics. Recycling streams rich in brown beer bottles enable cost-effective cullet incorporation while meeting color-consistency specs. Green and specialty hues serve niche SKUs, yet contribute to brand differentiation in duty-free retail channels favored by cruise traffic.
Geography Analysis
Panama’s latitude at the nexus of Atlantic-Pacific trade grants the Panama container glass market unrivaled logistics savings for regional exports. Roughly 12,000 merchant vessels sail through the Canal annually, slashing voyage time by up to two weeks compared with Cape Horn routes. Bottlers cluster near Balboa and Cristóbal ports, ensuring backhauls for empty bottles and reducing inland truck mileage.
The Colon Free Zone processes over USD 5 billion in yearly re-exports, acting as a de-facto distribution hub for glass headed to Guatemala, the Dominican Republic, and Colombia. Manufacturers exploit duty-free storage to stage pallets, allowing customers to draw inventory on demand without clearing customs multiple times.
Rural provinces lag behind urban recycling infrastructure, limiting cullet supply outside Panama City. The government’s planned 300,000-ton sorting facility will narrow the gap by funneling city-collected glass into remelt channels, but outreach programs must scale to capture post-consumer material in remote districts.
Competitive Landscape
The Panama container glass market is moderately concentrated, with the top five suppliers controlling 42% of 2024 output. Owens-Illinois leverages Colombian and Mexican cullet hubs to feed Panamanian furnaces, reducing virgin raw-material reliance and meeting brand sustainability KPIs. O-I Mexico’s 2024 Chihuahua recycling facility adds capacity for 150,000 tons of glass annually, ensuring cross-border cullet availability.
Firms pursue decarbonization via DOE-backed furnace rebuilds that promise 20-30% fuel savings, aligning with export customers’ Scope 3 goals. Smaller domestic players specialize in short-run, high-design bottles for craft rum labels, capitalizing on artisanal demand not economical for mass producers.
Upstream, Sibelco’s 2024 acquisition of Strategic Materials secures a 10-million-ton North American cullet footprint, offering Panamanian plants diversified feedstock options.[3]Sibelco, “Glass Recycling North America,” sibelco.com Downstream, global beverage conglomerates negotiate multi-year supply deals, bolstering line-capacity utilization and cushioning cyclical swings.
Panama Container Glass Industry Leaders
VICAL Centroamérica
BPS Glass
VETROelite S.r.l.
Owens Illinois Argentina, S.A
VIDRIOS Y ESPEJOS AMÉRICA, S.A
- *Disclaimer: Major Players sorted in no particular order

Recent Industry Developments
- January 2025: Panama implemented Executive Decree 2/2025 simplifying sanitary registration for medicines from WHO-listed regulators, expediting packaging demand.
- July 2024: O-I Mexico and SILICE opened a cullet hub in Chihuahua to secure recycled feedstock for regional furnaces.
- May 2024: Owens-Brockway Glass Container issued USD 300 million in senior notes to refinance debt and support Latin American operations.
- February 2024: Panama enacted Law 419/2024 overhauling pharmaceutical regulation and codifying stringent glass-packaging norms.


Panama Container Glass Market Report Scope
Glass containers are vessels made from glass used to store and protect products such as food, beverages, pharmaceuticals, cosmetics, and chemicals. Available in diverse shapes and sizes, such as bottles, jars, these containers provide airtight seals and protect contents from external contaminants. Glass packaging is valued for its non-reactive nature, preservation of product quality, and high recyclability. These attributes make glass containers a preferred choice for packaging across multiple industries.
The Panama container glass market is segmented by end-user vertical (beverages [alcoholic beverages (beer, wine, spirits, and other alcoholic beverages {cider and other fermented drinks}), non-alcoholic beverages (juices, carbonated drinks (CSDs), dairy product-based drinks, other non-alcoholic beverages)], food [jam, jelly, marmalades, honey, sausages and condiments, oil, pickles], cosmetics and personal care, pharmaceuticals (excluding vials and ampoules), and perfumery), by color (green, amber, flint and other colors). The report offers market forecasts and size in volume (kilotons) for all the above segments.
| Beverages | Alcoholic | Beer |
| Wine | ||
| Spirits | ||
| Other Alcoholic Beverages (Cider and Other Fermented Drinks) | ||
| Non-Alcoholic | Juices | |
| Carbonated Drinks (CSDs) | ||
| Dairy Product Based Drinks | ||
| Other Non-Alcoholic Beverages | ||
| Food (Jam, Jelly, Marmalades, Honey, Sausages and Condiments, Oil, Pickles) | ||
| Cosmetics and Personal Care | ||
| Pharmaceuticals (excluding Vials and Ampoules) | ||
| Perfumery | ||
| Green |
| Amber |
| Flint |
| Other Colors |
| By End-user | Beverages | Alcoholic | Beer |
| Wine | |||
| Spirits | |||
| Other Alcoholic Beverages (Cider and Other Fermented Drinks) | |||
| Non-Alcoholic | Juices | ||
| Carbonated Drinks (CSDs) | |||
| Dairy Product Based Drinks | |||
| Other Non-Alcoholic Beverages | |||
| Food (Jam, Jelly, Marmalades, Honey, Sausages and Condiments, Oil, Pickles) | |||
| Cosmetics and Personal Care | |||
| Pharmaceuticals (excluding Vials and Ampoules) | |||
| Perfumery | |||
| By Color | Green | ||
| Amber | |||
| Flint | |||
| Other Colors | |||


Key Questions Answered in the Report
How large is the Panama container glass market in 2026?
The market reached 214.74 kilotons in 2026 and is on track for 4.52% CAGR growth to 2031.
Which end-user segment currently dominates demand?
Beverages command 67.62% of 2025 volume thanks to Panama’s role as a regional bottling hub.
What color category is expanding fastest?
Amber glass is projected to post a 5.32% CAGR through 2031, fueled by craft rum and UV-sensitive pharma products.
How are energy costs affecting producers?
Electricity and natural-gas price hikes exceeding 30% since 2021 squeeze margins, but renewable contracts through 2046 offer relief.
What regulatory change most benefits glass suppliers?
Law 419/2024 tightens pharmaceutical packaging rules, steering demand toward chemically inert glass containers.
Where do companies source recycled glass?
Regional cullet hubs in Colombia and Mexico, along with a planned 300,000-ton sorting facility in Panama City, feed growing recycled-content needs.
Page last updated on:


