Tanzania Telecom MNO Market Size and Share
Market Overview
| Study Period | 2020 - 2031 |
|---|---|
| Forecast Data Period | 2026 - 2031 |
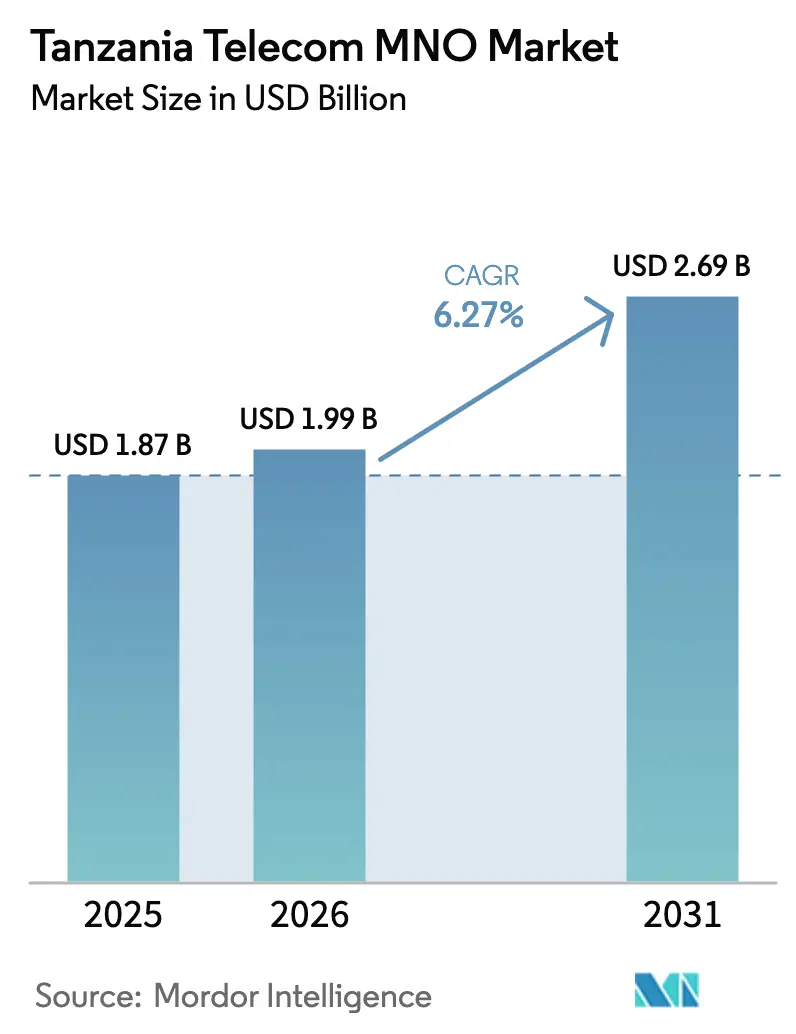
| Base Year Market Size (2025) | USD 1.87 Billion |
| Market Size (2026) | USD 1.99 Billion |
| Market Size (2031) | USD 2.69 Billion |
| Growth Rate (2026 - 2031) | 6.27% CAGR |
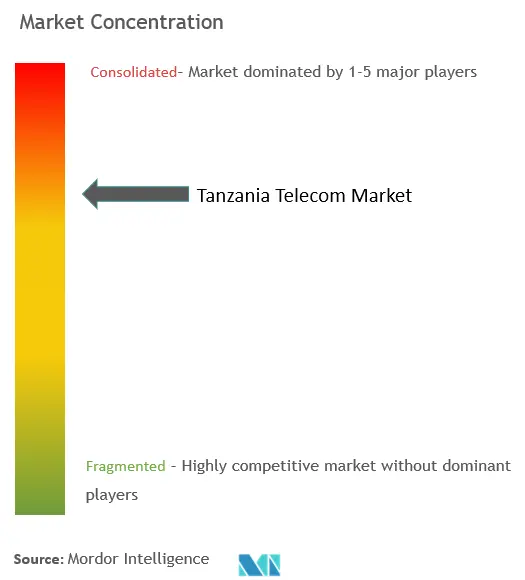
| Market Concentration | High |
Major Players *Disclaimer: Major Players sorted in no particular order Image © Mordor Intelligence. Reuse requires attribution under CC BY 4.0. | |
Tanzania Telecom MNO Market Analysis by Mordor Intelligence
The Tanzania Telecom MNO Market size was valued at USD 1.87 billion in 2025 and estimated to grow from USD 1.99 billion in 2026 to reach USD 2.69 billion by 2031, at a CAGR of 6.27% during the forecast period (2026-2031).
Growing data consumption, mobile-money monetization layers, and sustained network-investment mandates provide the primary lift for this growth trajectory. Despite mobile penetration exceeding 110%, smartphone ownership remains below 40%, which leaves significant headroom for higher-ARPU 4G and 5G services. Data and internet products already contribute nearly half of total operator revenue, and transaction-based financial services now account for more than one-third of service turnover for the leading carrier. Infrastructure consolidation, exemplified by Vodacom’s acquisition of Smile Communications, has intensified competition around network quality and accelerated 5G rollouts rather than pure price discounting. Parallel government programs—including the USD 150 million Digital Tanzania Project and a technology-neutral spectrum policy—further underpin the sector’s medium-term investment case.
Key Report Takeaways
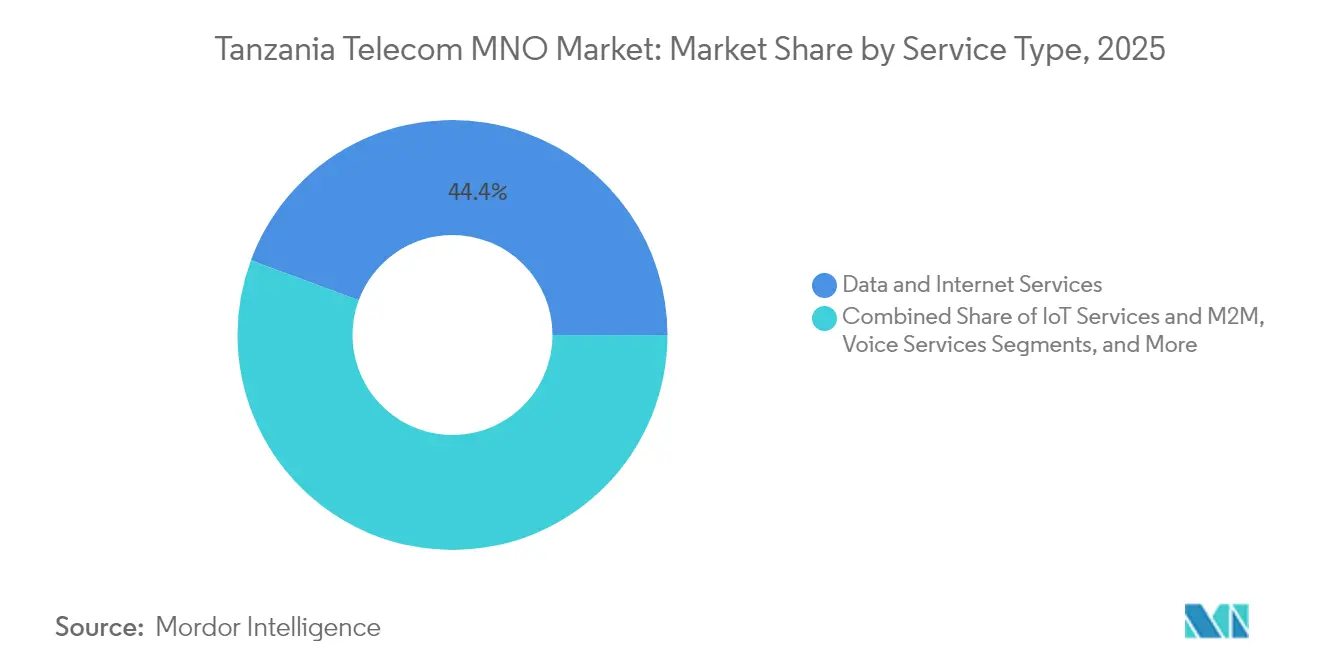
- By service type, data and internet offerings led with 44.35% revenue share in 2025, while IoT and M2M connections are forecast to expand at a 6.71% CAGR through 2031.
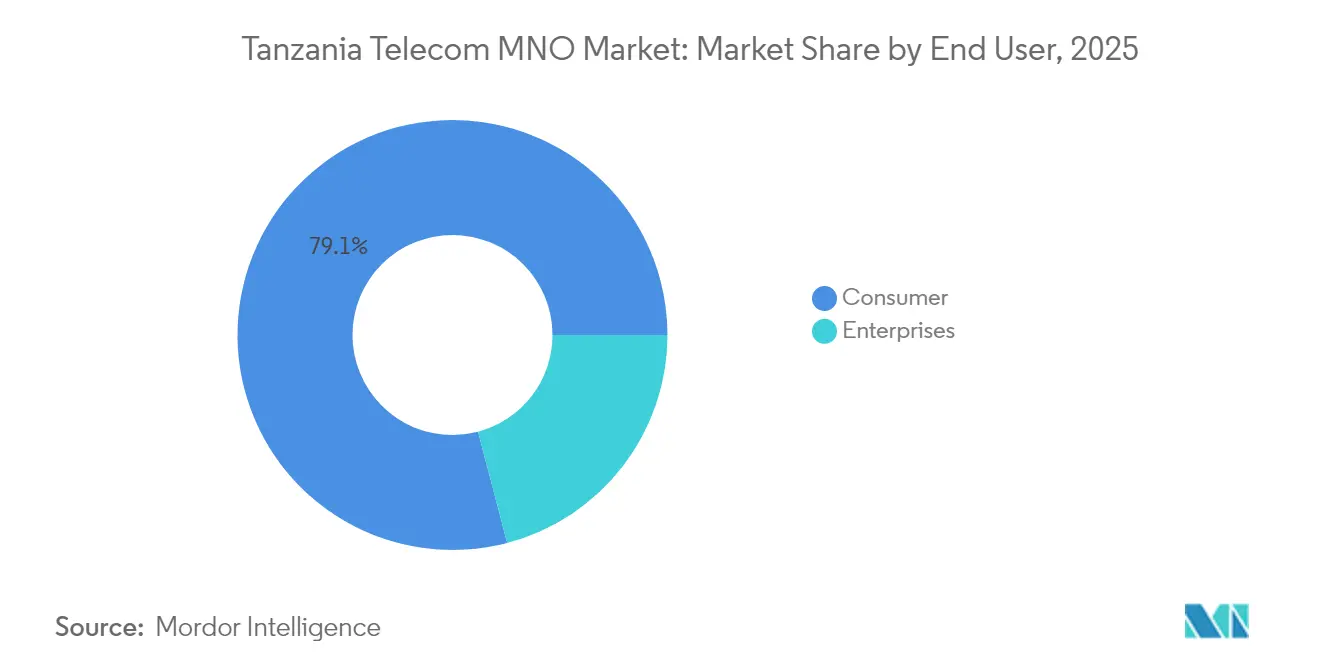
- By end user, the consumer segment held 79.10% of the Tanzania telecom MNO market share in 2025, whereas enterprise services are advancing at a 7.05% CAGR to 2031.
Note: Market size and forecast figures in this report are generated using Mordor Intelligence’s proprietary estimation framework, updated with the latest available data and insights as of 2026.
Tanzania Telecom MNO Market Trends and Insights
Drivers Impact Analysis*
| Driver | (~) % Impact on CAGR Forecast | Geographic Relevance | Impact Timeline |
|---|---|---|---|
| Expanding 4G footprint & imminent 5G spectrum release | +1.8% | National; strongest in Dar es Salaam and Dodoma | Medium term (2-4 years) |
| Surge in mobile-data traffic from rising smartphone adoption | +1.5% | Nationwide with accelerating rural uptake | Long term (≥ 4 years) |
| Government digital-transformation and e-service programs | +1.2% | Nationwide with pilot schemes in major cities | Medium term (2-4 years) |
| Booming mobile-money ecosystem elevating ARPU layers | +1.0% | Nationwide; highest penetration in rural districts | Short term (≤ 2 years) |
| New subsea-cable landings reducing international bandwidth cost | +0.8% | Coastal regions; national spill-over via fiber backbone | Short term (≤ 2 years) |
| Solar-powered micro-towers improving rural last-mile coverage | +0.4% | Northern and western rural zones | Long term (≥ 4 years) |
| Source: Mordor Intelligence | |||
Expanding 4G Footprint and Imminent 5G Spectrum Release
4G coverage surpassed 65% by late 2024, yet fewer than one in five connections currently use LTE, leaving an ample monetization gap for operators who densify their radio footprints. Vodacom’s September 2022 5G launch targeted 45% population coverage by 2024, and the carrier has since leveraged 700 MHz and 3500 MHz holdings to boost rural and enterprise speeds. Airtel followed with its own 5G switch-on in August 2023 after purchasing USD 60.1 million in additional spectrum, and Yas has signaled a 2025 commercial go-live. A technology-neutral licensing policy means operators can deploy 4G, 4.5G, and 5G layers on the same frequencies without extra fees, lowering rollout barriers relative to neighboring markets.[1]Tanzania Communications Regulatory Authority, “Quarterly Communications Statistics Q1 2025,” tcra.go.tzThe resulting capacity uplift is already translating into average downlink speeds above 40 Mbps on upgraded sites.
Government Digital-Transformation and E-Service Programs
President Samia Suluhu Hassan’s Digital Transformation Agenda includes an 80% broadband-penetration target by 2025 and early adoption of metaverse-related services for public administration. The National ICT Broadband Backbone expanded from 8,300 km in 2020 to 15,000 km by 2023, delivering low-latency links that support national ID, e-procurement, and e-judiciary platforms. World Bank financing has reduced the fiscal burden on operators by underwriting open-access backhaul into underserved districts. Parallel personal-data-protection regulations adopted in 2023 have raised compliance needs, encouraging large enterprises to outsource secure connectivity and cloud routing to licensed mobile-network operators. These combined measures have created a ready pipeline of enterprise demand, particularly for managed VPN and SD-WAN services.
Booming Mobile-Money Ecosystem Elevating ARPU Layers
Registered mobile-money wallets surged from 29.8 million in 2020 to 65.7 million by March 2025, underpinning a 36.3% service-revenue contribution for Vodacom’s M-Pesa platform. [2]Vodacom Tanzania, “Integrated Report 2025,” vodacom.co.tz High rural adoption shows how agent networks bridge gaps left by formal banks—only 17% of Tanzanians hold conventional bank accounts. Merchant payments, micro-loans, and savings products now sit on the same rails as peer-to-peer transfers, creating multi-product engagement that lifts ARPU even as voice usage declines. Smaller rivals such as Viettel’s Halopesa reported 47% year-on-year transaction growth in Q1 2025, indicating headroom for differentiated offerings. Regulatory support remains favorable after the 2024 removal of excise levies on airtime and mobile-money transfers.
New Subsea-Cable Landings Reducing International Bandwidth Cost
The 192 Tbps PEACE Cable, activated in December 2022, linked Dar es Salaam directly to Asia, Europe, and South Africa, slashing wholesale IP transit fees by more than 30% within its first full operating year. Earlier connections, such as SEACOM and EASSy, had already driven an 88% price drop between 2010 and 2015, demonstrating how each incremental landing resets the cost base. Lower international-capacity cost allows operators to offer larger data bundles without sacrificing margins, supporting the Tanzania telecom MNO market’s pivot toward video streaming and gaming. The national backbone’s extension to the Mozambique frontier positions the country as a carrier-neutral transit hub for land-locked neighbors, providing an emerging wholesale revenue stream. However, the May 2024 dual cable cut that crippled regional access for almost five days underscored the urgency of route diversity and satellite backup links.
Restraints Impact Analysis*
| Restraint | (~) % Impact on CAGR Forecast | Geographic Relevance | Impact Timeline |
|---|---|---|---|
| Elevated spectrum and sector-specific tax burden | −1.2% | Nationwide; heavier strain on smaller licensees | Long term (≥ 4 years) |
| Intensifying price wars pressuring ARPU and margins | −0.9% | High-density urban markets | Short term (≤ 2 years) |
| Fiber-optic vandalism inflating maintenance OPEX | −0.5% | Rural and peri-urban routes | Medium term (2-4 years) |
| Extreme-weather damage to microwave backhaul links | −0.3% | Coastal and northern corridors | Medium term (2-4 years) |
| Source: Mordor Intelligence | |||
Elevated Spectrum and Sector-Specific Tax Burde
Mobile-specific levies, including a 17% excise duty on airtime and a 0.3% mobile-money levy, inflate the total tax take to roughly 23% of end-user prices. Operators must also observe a 25% domestic-listing requirement, which only Vodacom fully met by 2025, and pre-pay multi-million-dollar license fees. Airtel’s USD 60.1 million 2023 spectrum purchase illustrates the capital intensity of remaining competitive when frequencies are auctioned at premium reserve prices. High fiscal outlays divert capital from rural network rollout and prolong payback horizons, particularly for 5G where demand maturation lags radio-access investment. The knock-on effect is a slower overall revenue ramp, trimming the long-term growth curve for the Tanzania telecom MNO market.
Intensifying Price Wars Pressuring ARPU and Margins
Average blended ARPU stabilized at USD 2.6 in FY 2024 despite 19.4% service-revenue growth for the market leader, indicating a volume-driven rather than yield-driven expansion path. [3]Airtel Africa, “FY 2024 Third-Quarter Results,” airtel.africa Rapid SIM-based promotions and data bundle discounts, especially in Dar es Salaam, have capped tariff-rebalancing opportunities. Currency depreciation further compresses reported earnings, as external debt servicing rises in USD even while local-currency top-line shows double-digit growth. Combined with regulatory directives that redirect fine payments into mandatory coverage upgrades, carriers find themselves juggling network-quality mandates with slim EBITDA headroom. This margin squeeze could delay international-gateway investments or postpone satellite-backhaul diversification that would otherwise buttress service resilience.
*Our forecasts treat driver/restraint impacts as directional, not additive. The impact forecasts reflect baseline growth, mix effects, and variable interactions.
Segment Analysis
By Service Type: Data Services Lead the Shift from Voice to Digital Solutions
Data and internet products controlled 44.35% of 2025 revenue, yet only 17.8% of connections were on 4G, signaling ample upside for higher-capacity tiers. The Tanzania telecom MNO market size for IoT and M2M applications is projected to climb at a 6.71% CAGR between 2026 and 2031 as logistics, agriculture, and utilities digitize asset monitoring. Voice revenue continues to shrink by low single-digits annually as OTT messaging substitutes for SMS, but usage remains sticky in lower-income segments. Carrier-billing video and cloud-gaming services remain nascent due to median download speeds of 12.5 Mbps, although expanded fiber-to-the-home footprints and 5G fixed-wireless pilots are expected to catalyze adoption after 2026. Operators increasingly bundle cybersecurity and cloud storage with data plans, turning connectivity into a gateway for B2B value-added services.
The transition is further supported by the technology-neutral spectrum regime, which lets operators repurpose 900 MHz and 1800 MHz holdings for 4G without surrendering 2G coverage. As a result, the Tanzania telecom MNO market size attributable to data-centric services could exceed USD 1.12 billion by 2031 if current smartphone import levies are relaxed to close the affordability gap. OTT content partnerships—such as Vodacom’s tie-up with Showmax—also allow carriers to piggy-back incremental revenue on streaming subscriptions without heavy capex outlays. Meanwhile, IoT smart-agriculture pilots supported by GSMA AgriTech grants have demonstrated 25% yield improvements, reinforcing the addressable enterprise case.


By End User: Enterprise Uptake Gains Momentum Amid Consumer Saturation
The consumer segment retained 79.10% revenue weight in 2025, yet its growth rate is moderating as SIM saturation approaches 115%. Conversely, enterprise connectivity and managed services are registering a 7.05% CAGR, double the consumer pace, and are forecast to push their share of the Tanzania telecom MNO market size to nearly 24% by 2031. Key demand nodes include cloud-based accounting for SMEs, secure APN services for financial-service providers, and smart-city infrastructure for municipal authorities.
Growth has accelerated following the 2023 adoption of personal-data-protection rules, which obligate corporations to host data in certified facilities or under government-approved cross-border frameworks. Mobile operators have responded with colocation and managed-security bundles that reduce compliance complexity for enterprises lacking in-house IT resources. Consumers, meanwhile, continue to drive cashless growth through mobile-money platforms, a pillar that anchors operator financial performance despite tempering voice and SMS yields. The Personal Financial Inclusion Framework aims to lift digital-payments volume by 100% between 2025 and 2030, ensuring a robust runway for wallet-driven ARPU expansion.
Geography Analysis
Dar es Salaam generates over 35.20% of national telecom revenue, fueled by high smartphone penetration and early 5G availability. Dodoma’s smart-government initiatives and burgeoning student population underpin above-average data-traffic growth, while Arusha benefits from tourism-led demand for roaming and high-definition streaming. Rural zones—home to more than 60% of Tanzanians—still rely on 2G and 3G for basic connectivity, although solar-powered micro-towers have begun to shift cost-economics favorably, leading to 11% year-on-year subscriber gains in remote wards.
Coastal regions enjoy latency advantages from proximity to subsea landing stations, positioning them for data-center development and regional transit revenue. By contrast, the rugged Western Corridor suffers frequent fiber cuts that raise OPEX by up to 15% relative to flat coastal routes. The government’s mobile-money adoption drive has seen wallet penetration top 90% in several Lake Zone districts, highlighting how digital finance can flourish even where broadband lags. Zanzibar, separated by a 50 km channel, depends on microwave and subsea spur links; its seasonal tourism peaks drive elastic data-bundle sales that operators augment with short-term roaming passes.
The Tanzania telecom MNO market share for rural sub-segments is expected to edge up as public funding for last-mile coverage obliges licensees to deploy at least 1,500 new sites by 2027. Competitive wholesale rates on the National ICT Backbone further improve business cases for fiber extension into Mwanza and Kigoma, although redundancy remains limited to single-route paths. Cross-border fiber links with Rwanda and Mozambique are poised to convert Tanzania into a regional bandwidth crossroads, birthing wholesale opportunities that offset domestic price pressure.
Competitive Landscape
Three carriers—Vodacom, Yas (formerly Tigo), and Airtel—jointly command 83.4% of subscriptions, reinforcing the Tanzania telecom MNO market’s oligopolistic character. Vodacom capitalizes on scale and spectrum depth to lead 5G deployments, recording 20.5% local-currency top-line growth in FY 2025 on the back of M-Pesa diversification. Yas has repositioned through network modernization and brand refresh, aiming to lift data’s contribution to 50% of service revenue by 2027. Airtel’s strategy centers on aggressive bundle pricing and tower rollouts; a 758-site expansion plan is underway to shore up rural coverage and comply with TCRA quality-of-service benchmarks.
Infrastructure sharing via tower firms such as Helios Towers lowers capex per site by roughly 35%, freeing operator budgets for fiber backhaul and 5G small-cell infill in high-traffic zones. Halotel, the fourth-ranked player, demonstrates that niche focus can yield outsized growth; a concentration on rural agent distribution and competitively priced financial-service suites delivered 29% revenue growth in Q1 2025. Satellite-terrestrial integration is emerging as a competitive lever: Vodacom’s non-terrestrial-network trial with AST SpaceMobile promises near-ubiquitous direct-to-device coverage, a differentiator that rivals may struggle to replicate quickly.
Regulatory shifts have also altered competitive calculus. The TCRA’s move from punitive fines to mandatory network-investment orders reallocates cash from penalties to capex, favoring operators with stronger balance sheets. Meanwhile, personal-data-protection rules elevate switching costs for enterprise clients, embedding stickiness once an operator secures a managed-service account. Collectively, these dynamics sustain a high, but not prohibitive, barrier to entry, reinforcing current market structure but still leaving whitespace for specialized or MVNO plays.
Tanzania Telecom MNO Industry Leaders
Vodacom Tanzania PLC
Airtel Tanzania PLC
MIC Tanzania Limited (Yas)
Halotel
Tanzania Telecommunications Corporation (TTCL)
- *Disclaimer: Major Players sorted in no particular order

Recent Industry Developments
- May 2025: Vodacom Group reported strong Tanzania performance with 20.5% revenue growth and 25.2% EBITDA growth, driven by M-Pesa expansion and network investment programs.
- April 2024: Vodacom Tanzania completed its USD 26.5 million acquisition of Smile Communications Tanzania, expanding spectrum depth for 4G and 5G rollouts.
- April 2024: Tanzania announced a national metaverse leadership strategy, including a digital college in Dodoma and a lab partnership with Turku University of Applied Sciences.
- August 2023: Airtel Tanzania launched commercial 5G services after securing new spectrum for USD 60.1 million.


Tanzania Telecom MNO Market Report Scope
Telecom is the long-range transmission of information by electromagnetic means. The Tanzanian telecom market includes in-depth trend analysis based on connectivity like fixed networks, mobile networks, and telecom towers. The Tanzanian telecom market is segmented by services (voice services (wired and wireless), data and messaging services, and OTT and pay TV services).
The report offers the market size in value terms in USD for all the abovementioned segments.
| Voice Services |
| Data and Internet Services |
| Messaging Services |
| IoT and M2M Services |
| OTT and PayTV Services |
| Other Services (VAS, Roaming and International Services, Enterprise and Wholesale Services, etc.) |
| Enterprises |
| Consumer |
| Service Type | Voice Services |
| Data and Internet Services | |
| Messaging Services | |
| IoT and M2M Services | |
| OTT and PayTV Services | |
| Other Services (VAS, Roaming and International Services, Enterprise and Wholesale Services, etc.) | |
| End-User | Enterprises |
| Consumer |


Key Questions Answered in the Report
How large is the Tanzania telecom MNO market in 2026?
The market is valued at USD 1.99 billion in 2026 and is forecast to reach USD 2.69 billion by 2031.
What growth rate is expected for mobile-money services?
Mobile-money revenue is growing faster than 25% annually and already contributes more than one-third of service revenue for the leading operator.
Which segment is expanding fastest within the service mix?
IoT and M2M connectivity is projected to register a 6.71% CAGR between 2026 and 2031, outpacing voice and broadband growth.
Who holds the largest subscriber share in Tanzania?
Vodacom leads with about 31.9% of SIM subscriptions, followed by Yas and Airtel.
What is driving enterprise revenue growth?
Government digitization mandates and new data-protection rules are pushing businesses to adopt managed connectivity and cloud-security services, resulting in a 7.05% CAGR for enterprise revenue streams.
How is the government supporting network expansion?
A USD 150 million World Bank-backed program extends the national broadband backbone to underserved regions, while a technology-neutral spectrum policy lowers rollout costs for 4G and 5G services.
Page last updated on:


