
Market Overview
| Study Period | 2020 - 2031 |
|---|---|
| Forecast Data Period | 2026 - 2031 |
| Base Year Market Size (2025) | USD 3.23 Billion |
| Market Size (2026) | USD 3.33 Billion |
| Market Size (2031) | USD 3.88 Billion |
| Growth Rate (2026 - 2031) | 3.08 % |
| Market Concentration | High |
Major Players *Disclaimer: Major Players sorted in no particular order Image © Mordor Intelligence. Reuse requires attribution under CC BY 4.0. | |
Egypt Telecom MNO Market Analysis by Mordor Intelligence
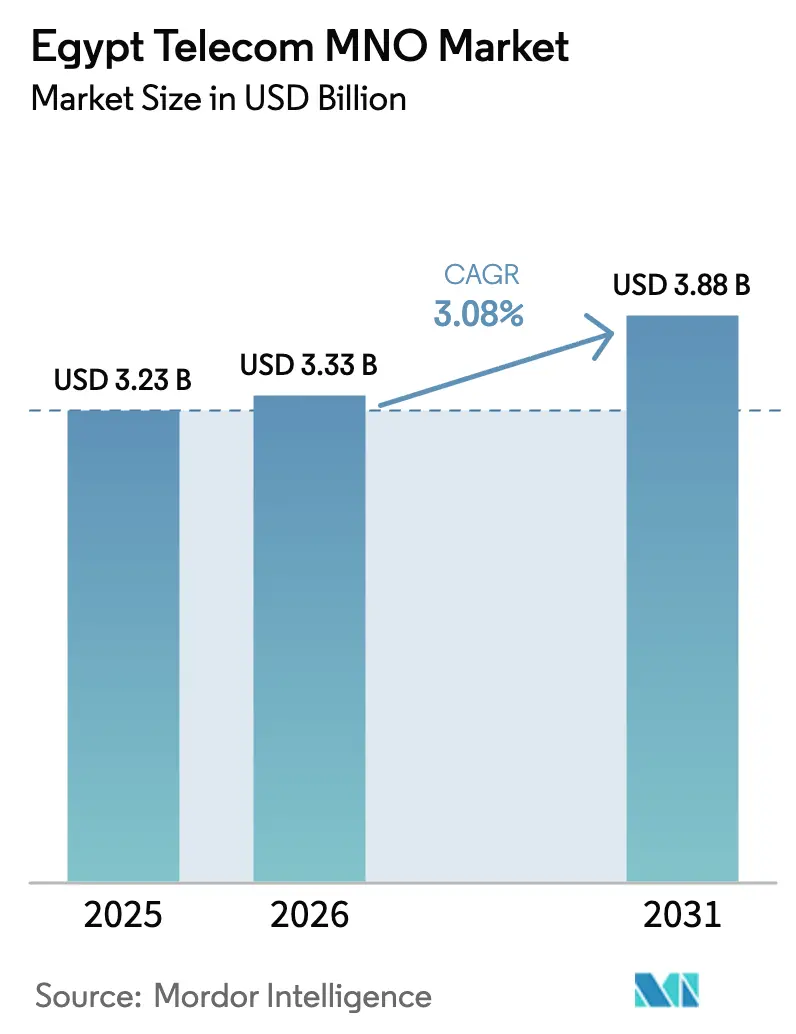
The Egypt Telecom MNO market size is expected to grow from USD 3.23 billion in 2025 to USD 3.33 billion in 2026 and is forecast to reach USD 3.88 billion by 2031 at 3.08% CAGR over 2026-2031.
Resilient revenue growth stems from widespread 4G upgrades, scheduled 5G launches in 2025, and the government’s USD 4.2 billion digital-infrastructure drive. Data services already contribute more than half of sector revenue, and operators expect enterprise IoT and cloud connectivity to offset slowing voice use. International wholesale bandwidth income is rising thanks to new subsea cable routes, while mobile financial services deepen customer engagement across rural districts. Competitive intensity remains elevated because four national licensees vie for subscribers, yet infrastructure-sharing agreements and smart-city partnerships temper capital needs and unlock fresh revenue pools. Currency devaluation and sector-specific taxes pressure margins; however, diversified service bundles, tower-sharing, and fintech integrations support stable cash flow and protect the Egypt Telecom MNO market against macroeconomic shocks.
Key Report Takeaways
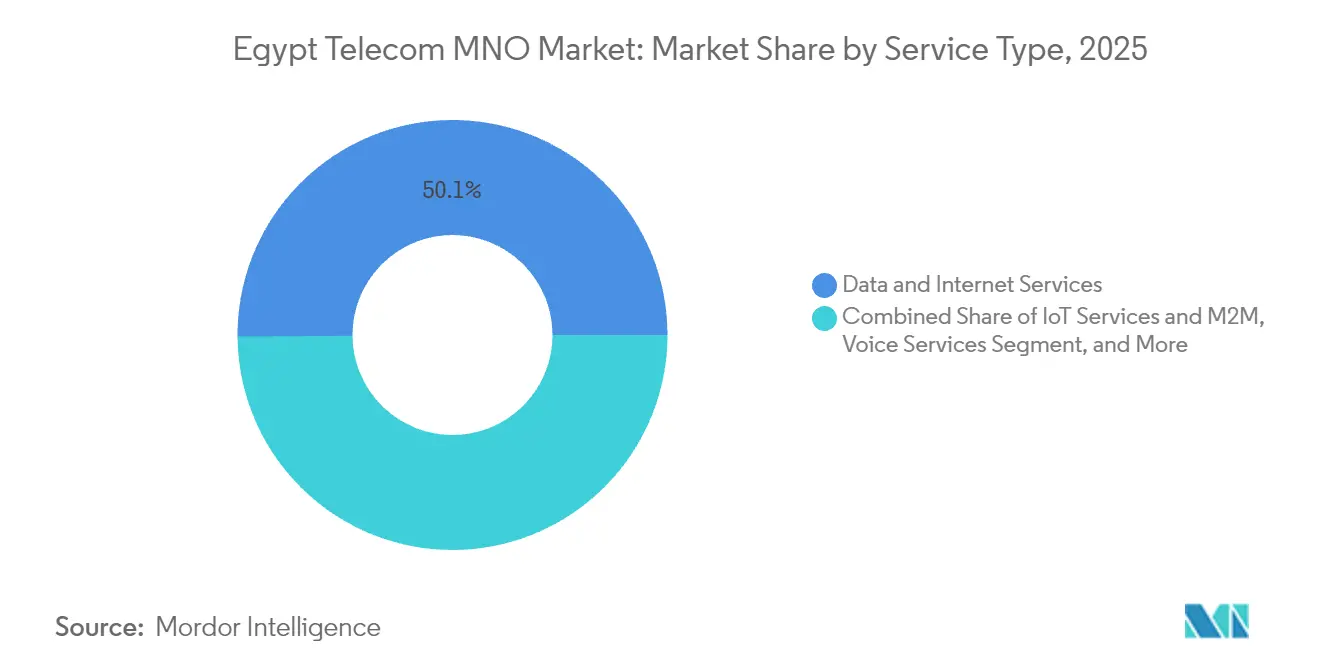
- By service type, Data and Internet Services commanded 50.12% revenue share in 2025. IoT and M2M Services are projected to expand at a 3.20% CAGR from 2026 to 2031.
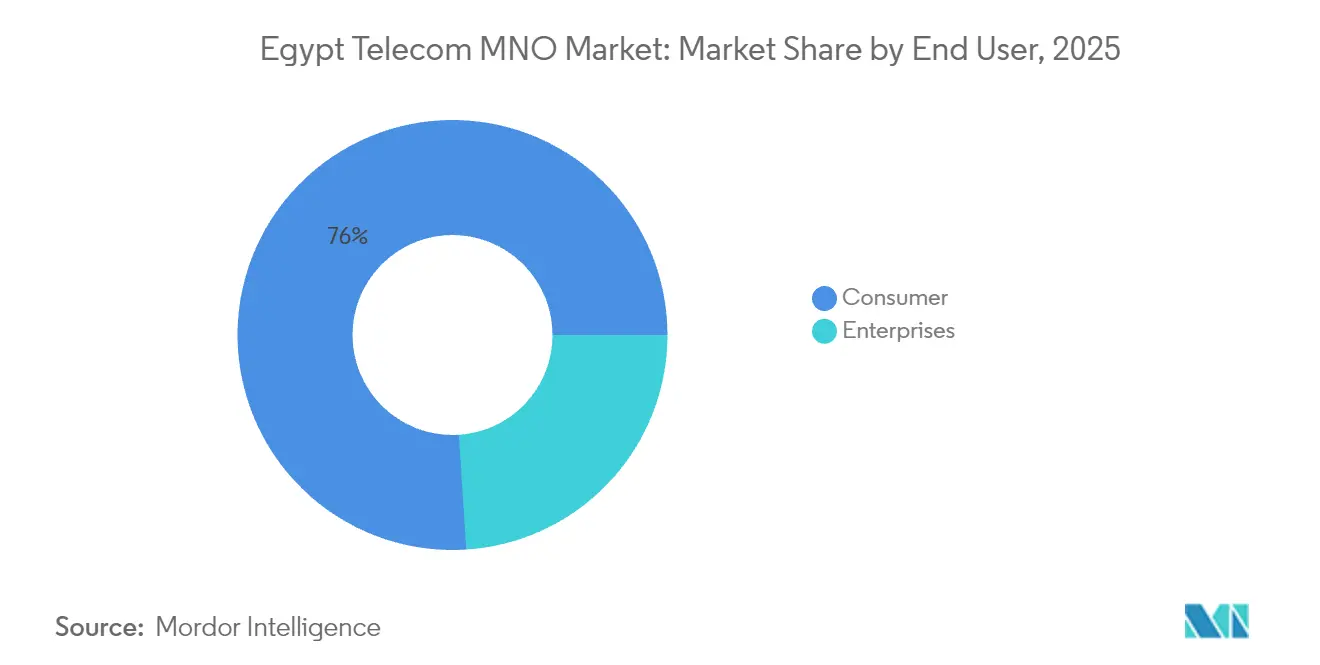
- By end user, the Consumer segment held 76.02% of the Egypt Telecom MNO market share in 2025. The Enterprise segment is forecast to record the fastest growth at 3.49% CAGR through 2031.
Note: Market size and forecast figures in this report are generated using Mordor Intelligence’s proprietary estimation framework, updated with the latest available data and insights as of 2026.
Egypt Telecom MNO Market Trends and Insights
Drivers Impact Analysis*
| Driver | (~) % Impact on CAGR Forecast | Geographic Relevance | Impact Timeline |
|---|---|---|---|
| Explosion of mobile data traffic and 4G/5G upgrades | +1.2% | National; early gains in Cairo, Alexandria, Giza | Medium term (2-4 years) |
| Fast-growing demand from fintech and super-apps | +0.8% | Urban centers expanding to rural areas | Short term (≤ 2 years) |
| Government-backed digital-nation projects | +0.9% | Nationwide; priority in New Administrative Capital | Long term (≥ 4 years) |
| Rapid expansion of subsea cable landings | +0.6% | Coastal regions; nationwide benefit | Medium term (2-4 years) |
| Growth in enterprise cloud / data-center outsourcing | +0.4% | Cairo and Alexandria business districts | Medium term (2-4 years) |
| Untapped rural consumer base addressable by FWA and satellite | +0.3% | Rural governorates and remote areas | Long term (≥ 4 years) |
| Source: Mordor Intelligence | |||
Explosion of mobile data traffic and 4G/5G upgrades
License fees totaling USD 825 million allowed all four operators to secure 5G spectrum in late-2024, and commercial launches are slated for H1 2025. WE already posts 92.5% 4G availability and 33.38 Mbps average downloads, while USD 2.7 billion in planned RAN modernization through 2027 underpins nationwide low-latency coverage. Higher spectral efficiency and edge-compute nodes enable massive IoT workloads and AR/VR entertainment that traditional 4G networks cannot sustain. As traffic per smartphone crosses 25 GB per month, operators prioritize carrier aggregation, small-cell densification, and cloud-native cores. These actions keep the Egypt Telecom MNO market on a stable upgrade path while protecting network quality.
Fast-growing demand from fintech and super-apps for bundled data
Vodafone Cash surpassed 7.5 million wallets in 2025, equal to 8.4% of operator service revenue, validating telecom-fintech convergence. eand Egypt’s “eand Neo” digital bank widens the ecosystem by offering micro-loans, insurance, and ride-hailing discounts within a single app interface. Because 65% of citizens outside major cities remain under-banked, bundled connectivity plus payments services lock in data usage and lift ARPU. Government financial-inclusion goals targeting a 70% banked population by 2030 offer a durable runway. As super-apps scale, demand for secure APIs, SMS one-time passwords, and real-time analytics yields fresh enterprise business for MNOs.[1]Investegate Analysts, “Vodafone Egypt FY 2024 results,” Investegate.co.uk
Government-backed digital-nation projects (Digital Egypt, Vision 2030)
Public-private investments topping EGP 150 billion since 2018 expand fiber backbones, data centers, and cloud platforms. The national Data and Cloud Computing Center opened in 2024 to support AI workloads and e-government portals. Smart-city rollouts in the New Administrative Capital have already stimulated private 5G indoor coverage deals for ministries and foreign embassies. Telecom licensees benefit from multi-year contracts for managed WAN, IoT sensors, and security services tied to ISO 27001 mandates. These long-term contracts underpin steady enterprise revenue and de-risk the Egypt Telecom MNO market against cyclical consumer spending. [2]CIO Correspondent, “Digital Egypt data center goes live,” CIO.com
Rapid expansion of subsea cable landings boosting international bandwidth
Five new trans-Mediterranean and Red Sea cables—Africa-1, IEX, ICE IV, WeConnect, and the Albania-Egypt Express—raise total design capacity landing in Egypt beyond 126 Tbps. Telecom Egypt earns recurring wholesale fees by offering dual-path redundancy that bypasses the congested Suez terrestrial route. Content-delivery networks and hyperscalers now colocate in local carrier-neutral facilities, increasing IP transit sales and improving end-user latency. The subsea boom positions Cairo as a low-cost East-West traffic hub, anchoring foreign-currency inflows that support equipment imports despite EGP depreciation. [3]Telecom Talk Bureau, “Africa-1 cable lands in Egypt,” TelecomTalk.info
Restraints Impact Analysis*
| Restraint | (~) % Impact on CAGR Forecast | Geographic Relevance | Impact Timeline |
|---|---|---|---|
| EGP depreciation pressuring CAPEX | -0.7% | National | Short term (≤ 2 years) |
| High sector-specific taxes and levies | -0.5% | National regulatory impact | Medium term (2-4 years) |
| Fibre roll-out delays due to right-of-way | -0.3% | Urban expansion corridors | Medium term (2-4 years) |
| Persistent SIM-box fraud and grey-route traffic | -0.2% | Cross-border voice gateways | Short term (≤ 2 years) |
| Source: Mordor Intelligence | |||
EGP depreciation pressuring CAPEX and imported equipment costs
The local currency remains undervalued by about 30%, forcing operators to re-price network contracts and seek dollar-denominated loans. Spectrum fees, power-backup systems, and radio units are imported, so cost spikes compress EBITDA margins. To cope, Vodafone Egypt and Orange Egypt expanded tower-sharing and vendor-financing deals, while Telecom Egypt securitized wholesale receivables to lock in hard-currency funding. Although inflationary headwinds reduce discretionary spend, data demand remains non-elastic, enabling gradual tariff rationalization approved by the regulator.
High sector-specific taxes and revenue-share levies eroding margins
Operators pay 5% of mobile service revenue to the NTRA, plus a 22.5% corporate income tax and 14% VAT on devices and top-ups. Combined fiscal pressure constrains 5G roll-out speed and limits rural cell-site density. Industry groups lobby for accelerated depreciation allowances and tax credits on power-efficient gear, pointing to the broader digital-economy multiplier effect. While the Ministry of Finance signaled openness to reviewing levies in its 2026 budget cycle, uncertainty keeps the weighted average cost of capital elevated for all Egypt Telecom MNO market participants.
*Our forecasts treat driver/restraint impacts as directional, not additive. The impact forecasts reflect baseline growth, mix effects, and variable interactions.
Segment Analysis
By Service Type: Data Services Drive Revenue While IoT Emerges
The Egypt Telecom MNO market size for Data and Internet Services reached USD 1.62 billion in 2025, equal to 50.12% of total revenue. Ongoing 4G densification and the pending 5G launch support median mobile download speeds of 23.2 Mbps, spurring OTT video, cloud gaming, and e-learning traffic. Vodafone Egypt tops fixed-broadband charts with 13.29 Mbps average rates, while WE leverages 18,000 km of fiber to upsell converged bundles. Voice usage continues to decline, yet HD Voice and VoLTE preserve premium niches among enterprise accounts. Messaging revenue pivots toward A2P traffic, where Telecom Egypt’s Mada partnership targets financial-services OTP codes and government alerts.
IoT and M2M Services will expand the Egypt Telecom MNO market size by an expected USD 79 million between 2026 and 2031, translating to the segment’s 3.20% CAGR. Smart-meter pilots in Alexandria, waste-collection telemetry in Cairo, and nationwide logistics-fleet tracking already leverage NB-IoT overlays. An academic study links every 10-point uptick in IoT penetration to a 0.7% boost in emerging-economy GDP, reinforcing public-sector support for bypassing legacy meter-reading costs. OTT and Pay-TV services gain traction as content providers secure edge-caching racks within carrier facilities, lowering buffering times and raising stickiness.



By End User: Enterprise Digitization Accelerates Growth
Consumer subscribers generated 76.02% of Egypt Telecom MNO market revenue in 2025 on the back of 85.46 million mobile internet users. Promotional 4G bundles, parental-control add-ons, and loyalty cashback points maintain churn below 2% per month. Vodafone Egypt alone added 836,000 new customers in 2024, and NTRA-approved inflation pass-throughs helped sustain ARPU despite economic headwinds. Deeper financial-services penetration in rural districts, where Hayah Karima upgrades energy, water, and broadband infrastructure, increases data usage and wallet top-ups.
Enterprise accounts will post a 3.49% CAGR through 2031, lifting their Egypt Telecom MNO market share from 23.98% in 2025 to almost 27% by 2031. Cloud-native SMEs migrate workloads to the national data-center campus, while multinational BPO operators such as Konecta invest USD 100 million to set up 3,000-seat AI and cybersecurity hubs in New Cairo. 5G private-network trials at automotive plants and seaports show latency below 10 ms, enabling machine-vision QA and automated guided vehicles. Mandatory data-localization rules further drive demand for domestic MPLS, SD-WAN, and virtual-firewall services.
Geography Analysis
Cairo, Giza, and Alexandria account for more than 55% of Egypt Telecom MNO market size, thanks to dense populations and early 5G deployments. Median mobile download speeds exceed 28 Mbps in Cairo, supporting cloud-gaming cafés and on-demand HD video. The New Administrative Capital, with its fully fibered districts and tier-III data center, acts as a showcase for smart-lighting, connected-parking, and e-government portals.
Coastal governorates host the majority of the 14 subsea cable landing stations, anchoring international wholesale traffic and colocation demand. Recent Africa-1 and IEX landings deliver route diversity from East Africa to Europe, sparking hyperscaler edge-node investments that enlarge the Egypt Telecom MNO market. Telecom Egypt’s USD 600 million ten-year fiber joint venture with Hungary’s 4iG targets six million new FTTH passes, particularly in second-tier cities such as Mansoura and Tanta.
Rural Upper Egypt and Sinai remain under-served but represent high-growth corridors. Fixed Wireless Access trials over 3.5 GHz 5G spectrum deliver 100 Mbps average downlink speeds to households previously limited to 4 Mbps DSL. Satellite backhaul augments border-security communications and tourism sites near Luxor and Aswan, ensuring ubiquitous voice and broadband coverage. Government subsidy programs lower device costs, allowing farmers and micro-enterprises to tap e-commerce and digital-finance platforms delivered via cellular.
Regulatory Landscape
Egypt’s mobile sector is governed by the National Telecommunications Regulatory Authority (NTRA), which oversees licensing, competition and spectrum management across the four national operators (Vodafone Egypt, Orange Egypt, e& Egypt and WE/Telecom Egypt). A major policy anchor is the Egypt Mobile Spectrum Roadmap 2026-2030, introduced in October 2025, which formalizes a multi-year planning approach for spectrum releases and refarming rather than ad hoc assignments.
In 2026, the NTRA approved price adjustments on selected mobile and fixed internet packages, including mandated low-cost digital inclusion packages. The regulatory agenda also includes device-side measures, such as import requirements for mobile phones enforced from January 21, 2026 to support local manufacturing, and a spectrum expansion program under a large multi-operator agreement (410 MHz across bands including 1800 MHz, 2600 MHz and 3500 MHz) moving into allocation phases in 2026.
Competitive Landscape
Four nationwide licensees keep the Egypt Telecom MNO market moderately concentrated. Vodafone Egypt holds 44% revenue share, leveraging 9,200 macro sites and a wholesale bandwidth agreement with Telecom Egypt, its 44.94% shareholder. It differentiates through “Giganet” LTE branding and a telco-fintech suite that bundles micro-insurance and merchant QR payments.
Orange Egypt captures 33% share and secured an EGP 15 billion, seven-year transmission contract with Telecom Egypt in February 2025 that guarantees dark-fiber capacity for its 5G build. eand Egypt owns 22% market share and focuses on digital-banking synergies plus smart-city concessions, including the USD 1 billion Ras El Hekma coastal megaproject. WE, the mobile arm of Telecom Egypt, has 10% share but leads in 4G availability and targets value-seeking youth through flexible eSIM plans.
Strategic moves cluster around infrastructure monetization, vendor co-financing, and AI-driven customer analytics. Operators increasingly share passive towers—raising tenancy ratios above 1.6—to cut diesel-generator opex amid volatile fuel prices. Cloud partnerships with Huawei, Nokia, and Amazon Web Services accelerate core-network virtualization, slash time-to-market for new tariffs, and enhance real-time fraud mitigation. Cyber-resilience gains urgency after 2024 DDoS incidents that briefly disrupted Vodafone Egypt’s digital payment gateway, prompting multi-layered scrubbing-center investments.
Egypt Telecom MNO Industry Leaders
Vodafone Egypt
Orange Egypt
Etisalat Egypt
WE (Telecom Egypt)
- *Disclaimer: Major Players sorted in no particular order


Market Opportunities and Future Outlook
Spectrum policy clarity and new spectrum availability create room for differentiated 5G and capacity-led offers, including fixed wireless access for underserved areas and higher-quality mobile broadband in dense urban clusters. The NTRA Mobile Spectrum Roadmap 2026-2030 and the spectrum agreement covering 410 MHz give operators a basis to tune coverage and experience across consumer data bundles, while also supporting enterprise-grade service level commitments.
Enterprise digital infrastructure also creates adjacent revenue pools beyond connectivity, especially in cloud, data center and managed services. Telecom Egypt’s decision in 2026 to keep its Regional Data Center Hub (RDH) wholly owned points to continued focus on domestic data center and cloud enablement, aligning with data localization-driven enterprise demand in government digital programs and smart-city deployments. For the mass market, mandated digital inclusion packages and regulatory actions around price adjustments support redesign of entry-level plans, bundling of value-added services (payments, security and parental controls), and retention through zero-rated access to government and educational sites in lower income segments.
Recent Industry Developments
- July 2026: The National Telecommunications Regulatory Authority allocated 410 MHz of additional mobile spectrum to Telecom Egypt, Vodafone Egypt, Orange Egypt, and e& Egypt after a February 2026 agreement. The spectrum expansion broadens capacity for 4 MNOs. This strengthens 5G rollout and data-traffic management across Egypt's MNO market.
- July 2026: Telecom Egypt terminated plans to divest 75%-80% of its Regional Data Center Hub RDH to Helios Investments, keeping RDH 100% owned. Maintains centralized ownership of RDH to optimize monetization of data-center-capable assets.
- June 2026: Vodafone Egypt announced a PHP 20 billion (EGP) capex program for the year focused on network infrastructure, 5G deployment, and AI-enabled data-center expansion. Accelerates 5G deployment and data-center capacity. Enhances network reach and back-end capabilities to sustain market competitiveness.


Research Methodology Framework and Report Scope
Market Definition and Coverage
For this study, the market is defined as telecom service revenue generated in Egypt by mobile network operators, covering core connectivity services sold to consumers and enterprises.
Scope exclusions: Excludes handset and device sales, pure network equipment spending, and standalone ICT services that are not billed as operator telecom services.
Segmentation Overview
- Overall Telecom Revenue and ARPU
- Service Type
- Voice Services
- Data and Internet Services
- Messaging Services
- IoT and M2M Services
- OTT and PayTV Services
- Other Services (VAS, Roaming and International Services, Enterprise and Wholesale Services, etc.)
- End-User
- Enterprises
- Consumer
Data Sources, Market Sizing, and Validation
Desk Research
Desk research starts with establishing the demand and supply context in Egypt, then mapping it to operator service revenues. We reviewed public telecom indicators and sector rules from official sources such as Egypts telecom regulator publications, the Ministry of Communications and Information Technology dashboards, and operator disclosures.
To keep assumptions grounded, we also used datasets and references such as ITU statistics, World Bank macro indicators, and UN Comtrade trade series where relevant for network imports, along with peer-reviewed papers on broadband and mobile adoption trends. Company filings, investor presentations, and reputable press releases helped validate service mix shifts and major network events. In parallel, we used paid subscriptions for company financials and intelligence, patent databases, and shipment-level import-export data to cross-check timelines and the direction of network and device-related moves. The sources listed here are illustrative, and many other public documents and data points were also used for collection, validation, and clarification.
Primary Interviews and Surveys
Primary work was used to pressure test what we saw in public numbers, especially around service revenue drivers and the timing of price moves. We spoke with operator and channel professionals, enterprise connectivity buyers, and sector specialists across Egypt. Their input was used to refine assumptions on ARPU movement, customer mix, and adoption of newer services (such as IoT and fixed wireless access where applicable).
Distribution of primary research fieldwork respondents
| Company type | Respondent position |
|---|---|
| Top tier: 30% | CXOs: 13% |
| Mid tier: 53% | Functional/Unit leaders: 38% |
| Smaller Players: 17% | Managers: 49% |
Market-Sizing & Forecasting
The sizing logic starts from a top-down build where telecom service revenue pools are reconstructed using operator reported financials, service mix shares, and subscriber and traffic indicators that explain how usage turns into billed revenue. Once that total is formed, we corroborate it through selective bottom-up checks, such as sampled ARPU by service type multiplied by active subscriber bases, and reasonableness tests against known price plan changes.
Key inputs used in the model include mobile subscriber base trends, smartphone and data usage direction, the data-to-voice revenue mix, enterprise versus consumer contribution, and the pace of network upgrades that can lift achievable speeds and data monetization. Where a variable is not consistently published for every year, we handle gaps by using the closest official time series, back casting with observable proxies, and then validating the implied results with interview feedback.
Forecasting is done using scenario analysis supported by time series smoothing, so that macro shifts such as inflation-driven pricing actions and FX effects can be tested without forcing a single straight-line growth path. Final assumptions are kept explainable so the steps can be repeated when new regulator releases and operator updates arrive.
Data Validation & Update Cycle
Validation is done in layers, starting with consistency checks across independent signals such as subscribers, service mix, and revenue per user movements. When the model shows an unusual jump or drop, we trace the driver back to the exact assumption (for example, a pricing step, a customer mix shift, or a reporting change) and review it again before sign-off.
We also run variance checks versus related indicators like broadband adoption direction and operator margin commentary, then have results reviewed by another analyst to catch input errors or weak logic. Reports are refreshed annually, and interim updates are made when a material event changes market direction. Before delivery, a final pass is completed so clients receive the latest updated view.
Mordor Intelligence's Egypt Telecom Market Size Measured Against Other Published Estimates
Published estimates for Egypt telecom often differ because the scope is not always aligned, and because revenue treatments can vary by what is counted as operator service income. Differences also come from currency conversion timing, whether inflation-driven price resets are modeled as immediate or gradual, and how fast newer services are assumed to scale.
The main gap comes from whether the number is limited to mobile network operator service revenue only, where Mordor Intelligence counts voice, data and internet, messaging, and adjacent operator billed services, but leaves out device sales and broader ICT spending that can inflate totals.
Benchmark comparison
| Source | Market Size | Gaps in Research Methodology |
|---|---|---|
| Mordor Intelligence | USD 3.23 B (2025) | |
| Global Consultancy A | USD 3.49 B (2026) | Uses a later base year and appears to assume faster ARPU uplift from pricing and 5G readiness, and may treat some non core operator revenues as part of telecom service totals. |
| Trade Journal B | USD 3.05 B (2025) | Likely reflects a narrower core services cut that undercounts data and digital add ons, and may apply conservative FX conversion and inflation assumptions that reduce USD reported revenue. |
The spread across the table is explained mostly by scope and timing choices, followed by how price increases and currency are translated into USD. By keeping inclusions tied to operator billed telecom services and by checking ARPU, subscriber trends, and service mix together, the final total stays traceable to clear inputs and can be updated in repeatable steps.


Key Questions Answered in the Report
What is the current value of the Egypt Telecom MNO market?
The sector generated USD 3.33 billion in 2026 and is forecast to reach USD 3.88 billion by 2031.
Which operator holds the largest subscriber share in Egypt?
Vodafone Egypt leads with 44% revenue share and over 44 million customers.
How fast will enterprise revenue grow for Egyptian mobile operators?
How fast will enterprise revenue grow for Egyptian mobile operators? Enterprise accounts are projected to expand at a 3.49% CAGR between 2026 and 2031 as digitization accelerates.
When will nationwide 5G services launch in Egypt?
All four MNOs plan commercial 5G launches during the first half of 2025 after securing licenses in late-2024.
What role do subsea cables play for Egypt’s telecom sector?
New Mediterranean and Red Sea landings raise capacity beyond 126 Tbps, positioning Egypt as a preferred Eurasian transit hub and boosting wholesale revenue.
How are operators mitigating currency depreciation?
Strategies include tower-sharing, vendor-financing, securitized receivables, and NTRA-approved tariff adjustments that offset import-cost inflation.
Page last updated on:


 Your data is secure and never sold or shared.


