Ghana Telecom MNO Market Size and Share
Market Overview
| Study Period | 2020 - 2031 |
|---|---|
| Forecast Data Period | 2026 - 2031 |
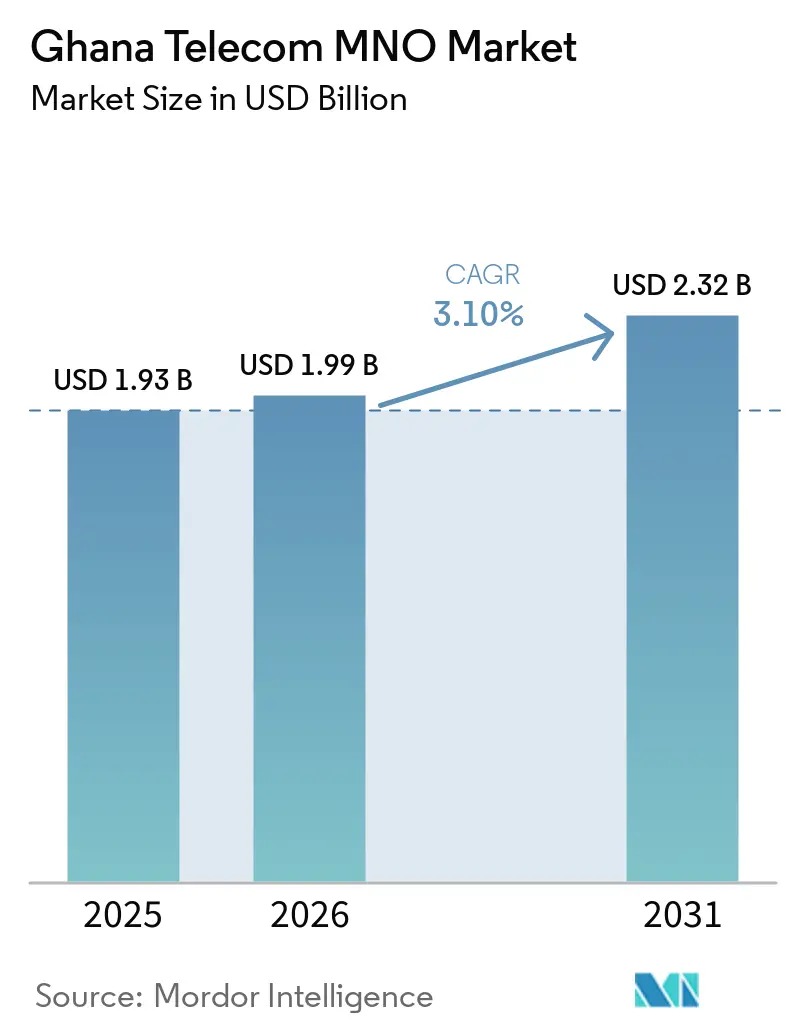
| Base Year Market Size (2025) | USD 1.93 Billion |
| Market Size (2026) | USD 1.99 Billion |
| Market Size (2031) | USD 2.32 Billion |
| Growth Rate (2026 - 2031) | 3.10% CAGR |
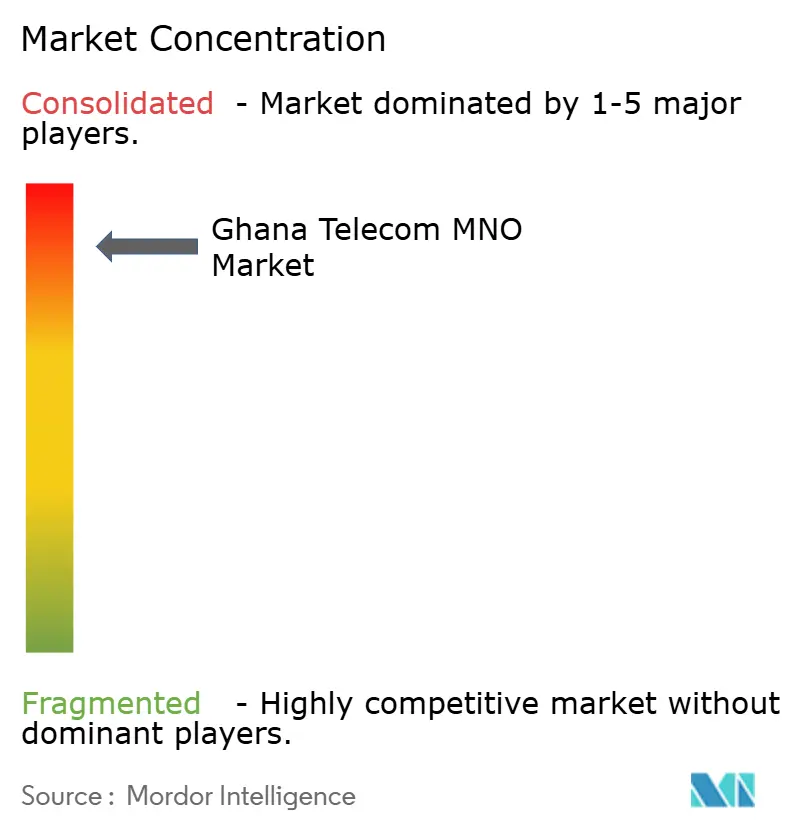
| Market Concentration | High |
Major Players *Disclaimer: Major Players sorted in no particular order Image © Mordor Intelligence. Reuse requires attribution under CC BY 4.0. | |
Ghana Telecom MNO Market Analysis by Mordor Intelligence
The Ghana telecom market size is expected to increase from USD 1.93 billion in 2025 to USD 1.99 billion in 2026 and reach USD 2.32 billion by 2031, growing at a CAGR of 3.1% over 2026-2031. Operators are shifting from voice-centric to data-centric revenues as nationwide mobile penetration already exceeds 118%, which tempers net-add growth and redirects strategy toward higher data usage, enterprise connectivity, and value-added mobile money services. Consolidation has created a de facto duopoly, intensifying competition over network quality and digital payment ecosystems rather than headline subscriber gains. Government reforms such as the Dig Once policy and spectrum refarming underpin long-term capacity expansion, while cedi volatility and right-of-way fees continue to weigh on capital efficiency. The Ghana telecom market is therefore proceeding on a steady but disciplined investment path that favors fiber backhaul, enterprise circuits, and enhancements to rural coverage.
Key Report Takeaways
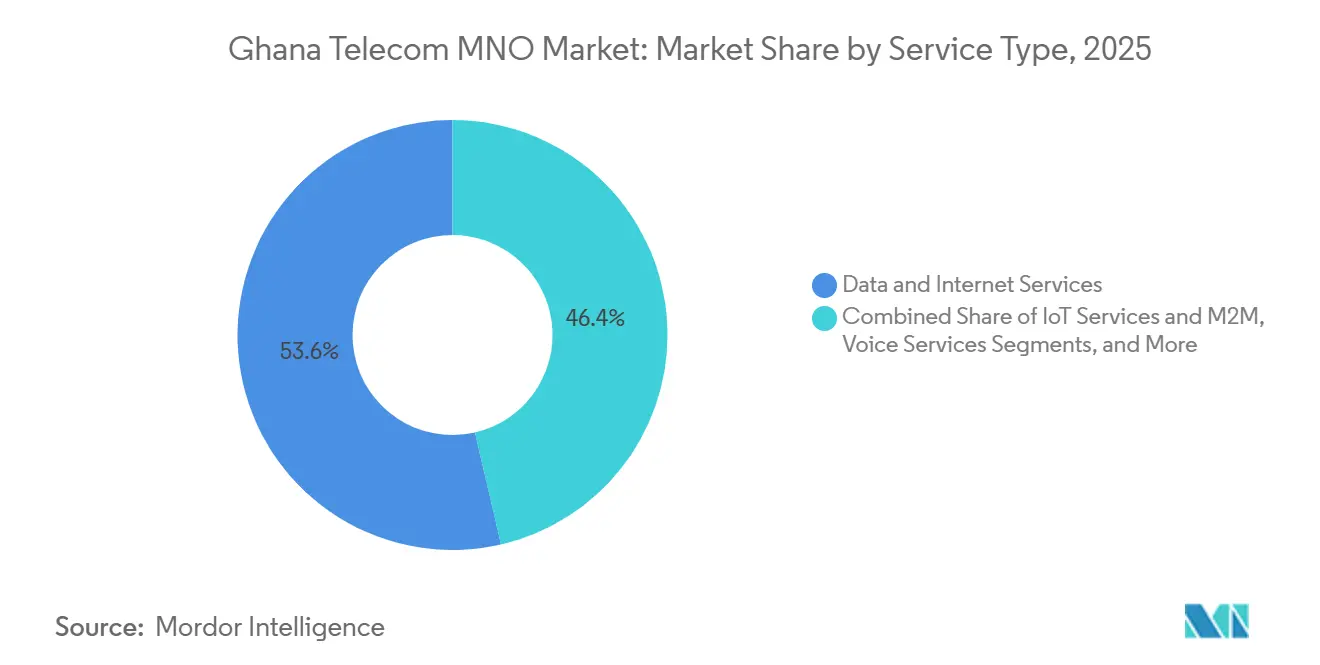
- By service type, data and internet services accounted for 53.62% of 2025 revenue and continue to anchor topline growth as operators monetize surging 4G usage. By service type, IoT and M2M Services are projected to expand at a 4.52% CAGR between 2026-2031, the fastest pace among all categories, reflecting demand from logistics, agriculture, and utilities.
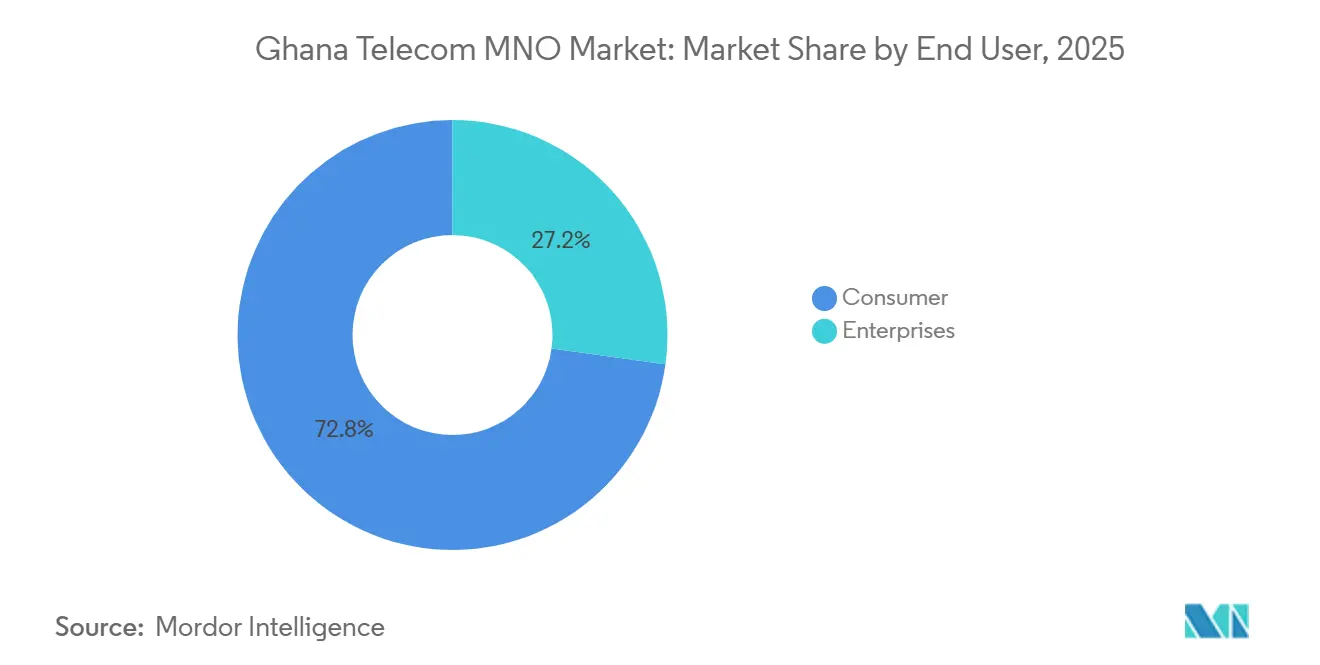
- By end user, the consumer segment accounted for 72.83% of 2025 revenue, yet enterprises are forecast to grow at a 5.01% CAGR through 2031 as dedicated internet access, cloud links, and managed security gain traction.
Note: Market size and forecast figures in this report are generated using Mordor Intelligence’s proprietary estimation framework, updated with the latest available data and insights as of 2026.
Ghana Telecom MNO Market Trends and Insights
Drivers Impact Analysis*
| Driver | (~) % Impact on CAGR Forecast | Geographic Relevance | Impact Timeline |
|---|---|---|---|
| Explosive 4G Data Consumption | +1.2% | Greater Accra, Ashanti, Western | Short term (≤ 2 years) |
| Mobile Money Ecosystem Expansion | +0.9% | Urban and peri-urban corridors | Medium term (2-4 years) |
| Government-Led Rural Fiber Roll-Out (GIFEC) | +0.6% | Underserved rural districts | Long term (≥ 4 years) |
| Growing Enterprise Demand for Dedicated Access | +0.5% | Accra, Kumasi, Takoradi | Medium term (2-4 years) |
| Sub-1 GHz Spectrum Refarming for IoT | +0.3% | National | Long term (≥ 4 years) |
| Anticipated 5G Auction and Local R&D Incentives | +0.4% | Urban centers | Medium term (2-4 years) |
| Source: Mordor Intelligence | |||
Explosive 4G Data Consumption
Average monthly mobile data usage rose to 14.7 GB in 2025, a 36.6% year-on-year increase, as budget Android handsets and aggressive data bundles broadened streaming and social media use.[1]MTN Ghana, “Annual Report and Financial Statements 2024,” MTN.COM.GH Data traffic on MTN’s network grew 55.4% during the same period, outpacing revenue, which squeezed per-megabyte yields and spurred capacity upgrades. The surge is concentrated where 4G population coverage nears 99%, yet a 62% usage gap persists because many SIMs remain voice-only.[2]National Communications Authority, “Quarterly Statistical Bulletin on Communications in Ghana,” NCA.ORG.GH Operators now bundle data with voice and subsidize entry-level smartphones, a tactic that lifts traffic but postpones 5G commitments until spectrum is finalized. Network congestion in evening peaks is being managed through carrier aggregation and 256-QAM enhancements, buying time before the expected 5G auction.
Mobile Money Ecosystem Expansion
Transaction values climbed to GHS 4.5 trillion (USD 291 billion) in 2025 after the e-levy repeal, a 50% annual rise that underscores mobile money’s centrality to digital commerce.[3]Bank of Ghana, “Payment Systems Statistics,” BOG.GOV.GH MTN Mobile Money commands about 90% share and logged a 54.4% revenue spike as value-added products such as micro-insurance deepened wallet share. Active accounts reached 26.7 million, exceeding 120% penetration on a multi-SIM basis and simultaneously generating incremental data sessions through mini-apps and QR payments. Real-time settlement rules have lowered merchant friction, creating a self-reinforcing loop of greater acceptance and higher transaction velocity. This expansion lifts data consumption and justifies broader 4G rollouts in peri-urban retail corridors.
Government-Led Rural Fiber Roll-Out (GIFEC)
GIFEC had built 1,010 rural sites by 2025, 569 of which were active, and is committed to building 2,016 by 2027 to reach 95% population coverage. In March 2026, Huawei was tapped to survey 1,542 candidate sites for fiber backhaul, signaling a pivot from satellite to terrestrial links that can support telemedicine and e-learning. Cabinet’s Dig Once mandate embeds ducts in new roads, cutting deployment timelines by roughly 30% and easing right-of-way disputes. Co-location terms allow private operators to lease capacity, turning GIFEC into a wholesale facilitator rather than a pure subsidy body. Remaining obstacles include land-acquisition delays and off-grid power, which add USD 15,000-20,000 per site when hybrid solar-diesel systems are required.
Growing Enterprise Demand for Dedicated Internet Access
Enterprises are migrating from shared mobile data to dedicated circuits as cloud workloads, remote work, and real-time supply-chain tools proliferate. MTN Ghana’s Business Fiber, launched in 2024, offers symmetrical 10 Mbps-1 Gbps links with 99.5% uptime SLAs aimed at banks and ministries. Telecel Ghana’s E-Connecta bundles connectivity with cybersecurity and SD-WAN, positioning the operator as a managed-services partner. Spectrum Fiber operates about 7,000 km of network supporting Takoradi and Tema industrial clients that demand low-latency ERP links. Domestic lit fiber capacity hit 41,661 Gbps in 2024, of which MTN controls 90%, creating leasing bottlenecks that inflate rivals’ costs. Enterprise ARPU ranges from USD 200 to 2,000 per month, compared with consumer ARPU of roughly USD 3 to 5, which explains the strategic pivot to this segment.
Restraints Impact Analysis*
| Restraint | (~) % Impact on CAGR Forecast | Geographic Relevance | Impact Timeline |
|---|---|---|---|
| Persistently High Right-of-Way Fees | -0.8% | National urban cores, forest reserves | Short term (≤ 2 years) |
| FX Volatility and Import Duties on Equipment | -0.7% | National | Medium term (2-4 years) |
| Low Digital Literacy Outside Urban Centers | -0.4% | Rural and peri-urban districts | Long term (≥ 4 years) |
| Domestic Credit Crunch Constraining Capex | -0.3% | National, heavier on small players | Short term (≤ 2 years) |
| Source: Mordor Intelligence | |||
Persistently High Right-of-Way Fees
Operators spent roughly USD 70 million on fiber-cut repairs between 2021 and 2025 as uncoordinated construction severed cables in the absence of centralized duct registries.[4]GSMA, “The Mobile Economy: West Africa 2025,” GSMA.COM District assemblies charge annual land-rental fees that can reach USD 900,000 in dense municipalities, elevating opex and delaying breakeven for new fiber routes. While the Dig Once policy reduces costs for future roads, it does not retroactively solve legacy trenches, forcing operators to negotiate piecemeal permits. Environmental and zoning clearance processes last up to 18 months, extending holding costs on leased plots. An electronic permitting portal is proposed, yet district assemblies resist reforms that would dilute a key revenue source.
FX Volatility and Import Duties on Network Equipment
The cedi lost about 25% of its value against the USD between 2020 and 2025, raising local costs for imported base stations, routers, and antennas. Hardware imports reached USD 223.8 million in 2024 and face cumulative taxes of 20-25%, eroding returns on capital and nudging operators toward software-defined upgrades rather than new hardware. MTN disclosed a USD 39.5 million jump in duty liabilities due to devaluation and now hedges procurement with forward contracts. Smaller firms lack similar hedging capacity and remain exposed to sudden currency swings that can derail quarterly capex plans. Government reviews acknowledge telco levies account for 39% of retail bundle pricing, but, as of mid-2026, have not provided fiscal relief.
*Our forecasts treat driver/restraint impacts as directional, not additive. The impact forecasts reflect baseline growth, mix effects, and variable interactions.
Segment Analysis
By Service Type: Data Revenue Dominates, IoT Ascends
Data and Internet Services generated 53.62% of 2025 revenue, reflecting the structural pivot from voice to data, with MTN reporting 48.8% data-revenue growth during the year. The Ghana telecom market size for data services is positioned to widen further as average monthly usage climbs and operators bundle zero-rated social platforms to defend share. IoT and M2M, while only a mid-single-digit portion today, is forecast to post the fastest expansion at a 4.52% CAGR, supported by fleet-tracking, smart-metering, and precision-agriculture pilots. Operators are packaging dedicated APNs, tiered analytics dashboards, and managed hardware leasing to monetize these connections, improving stickiness and diversifying income beyond consumer traffic.
Voice services still contribute material absolute revenue but face secular erosion as over-the-top calling substitutes international minutes. Messaging revenue remains under pressure amid SMS cannibalization, though enterprise A2P traffic partially offsets the decline. Operators exploit carrier aggregation and 256-QAM to optimize spectral efficiency, delaying 5G capital outlays while maintaining user experience. Pay-TV and other value-added categories lag because limited fixed broadband availability constrains high-resolution streaming, yet mobile-first IPTV bundles are being tested to capture cord-cutters. Collectively, these trends keep the Ghana telecom market on a data-driven trajectory where IoT layers incremental growth atop a maturing mobile broadband base.


By End-User: Enterprise Margins Outpace Consumer Volumes
Consumer accounts delivered 72.83% of 2025 revenue, driven by mobile money, prepaid data bundles, and voice usage. Competitive promotions keep consumer ARPU in the USD 3-5 range, spurring churn and frequent SIM swaps. To defend share, operators cross-sell savings accounts, micro-insurance, and merchant cash advances within mobile money, embedding financial services in daily routines and raising switching costs. Nonetheless, rising smartphone adoption and social-media engagement sustain traffic volumes, helping carriers monetize spectrum assets.
Enterprises, while smaller in absolute terms, are projected to expand at a 5.01% CAGR through 2031, supplying much needed margin diversification. The Ghana telecom market share for dedicated internet links is already skewed toward MTN, which leverages its 90% control of lit fiber to bundle connectivity with cloud peering and cybersecurity. Telecel counters with SD-WAN and managed-security offerings, positioning itself as an integrator. Industrial corridors around Takoradi and Tema as well as mining hubs demand low-latency uptime, supporting premium monthly fees of USD 200-2,000 and underpinning stronger cash conversion than the consumer base. This bifurcation aligns capital allocation toward metro fiber and fixed-wireless access that can serve both SMEs and large corporates.
Geography Analysis
The Greater Accra and Ashanti regions together generate roughly 60% of sector revenue, reflecting dense commercial activity, higher disposable income, and near-ubiquitous 4G coverage, which reached 99% by 2024. These corridors are first in line for 5G once spectrum rules stabilize, buoyed by early enterprise pilots that require enhanced mobile broadband. Western and Central regions, anchored by cocoa and mining, are adopting IoT for supply-chain traceability, presenting niche enterprise revenue to complement consumer traffic. Northern territories lag in both coverage and digital literacy, with feature phone usage still over 30%, prompting GIFEC-led rural site builds to bridge the divide.
International bandwidth supplied by the West Africa Cable System and MainOne provides ample headroom, 8,525.9 Gbps available with only 3,646.2 Gbps active as of 2024, meaning domestic middle-mile constraints, not subsea capacity, limit user experience. Cross-border links to Côte d’Ivoire, Burkina Faso, and Togo support roaming and wholesale traffic, though ECOWAS tariff harmonization remains unfinished and inhibits seamless regional data bundles. The Dig Once policy should accelerate last-mile fiber in underserved areas by embedding ducts in new roads, reducing trenching costs roughly 30% and smoothing right-of-way negotiations. However, land disputes and intermittent grid power in off-grid communities continue to slow rural activation.
Overall, the Ghana telecom market remains nationally regulated, but regional disparities in income, literacy, and infrastructure steer investment patterns such as dense southern corridors secure early upgrades, while GIFEC subsidizes reach in sparsely populated north. This phased approach balances commercial returns with universal-service goals.
Competitive Landscape
The Ghana telecom market is highly concentrated, with MTN holding the majority of voice and data subscriptions as of 2025. Government-facilitated consolidation moved AirtelTigo’s 3.2 million lines to Telecel in September 2025, reinforcing a duopoly with MTN and eliminating sub-scale competitors. MTN’s dominance is anchored by control of about 90% of lit fiber and an expanding tower portfolio, including 500 sites purchased from IHS in February 2026 that shave USD 15 million in annual lease costs.
Telecel, bolstered by a USD 70 million Huawei financing pact in November 2025, plans to increase sites from 5,000 to 9,000 and upgrade its backhaul, shifting its proposition from a price play to a quality challenger. Both carriers leverage mobile money, but MTN’s 90% share of that vertical cements customer stickiness and cross-sell potential. White-space niches include fixed-wireless access in peri-urban belts where fiber remains uneconomic, IoT for agriculture logistics, and managed security for SMEs. Next-Gen InfraCo launched wholesale 5G in March 2026, but exclusivity is under regulatory review and may open millimeter-wave bids to retail operators, though only capital-rich players are likely to participate.
Strategically, MTN has earmarked USD 1 billion for 2026-2028 to add 800 sites and deploy AI-driven optimization, while Telecel invests in SD-WAN and cybersecurity bundles. Smaller entrants such as Surfline and Glo have exited, underscoring the tough economics for sub-scale networks. The Ghana telecom market therefore functions with two aggressively investing leaders, limited threat of new entrants, and regulatory moves focused on affordability and universal access rather than fostering additional facilities-based competition.
Ghana Telecom MNO Industry Leaders
MTN Ghana
Telecel Ghana
AT Ghana
Glo Ghana
Surfline Communications
- *Disclaimer: Major Players sorted in no particular order

Recent Industry Developments
- April 2026: MTN Ghana announced a USD 1 billion network program for 2026-2028 to build 800 base stations and deploy AI optimization tools.
- March 2026: Next-Gen InfraCo began commercial 5G service in Accra and Kumasi under a neutral-host model.
- March 2026: Huawei partnered with GIFEC to assess 1,542 rural sites for fiber upgrades.
- May 2026: Cabinet approved the Dig Once policy mandating fiber ducts in all new road projects.


Ghana Telecom MNO Market Report Scope
The Ghana Telecom MNO Market Report is Segmented by Service Type (Voice Services, Data and Internet Services, Messaging Services, IoT and M2M Services, OTT and PayTV Services, Other Services), End-user (Enterprises, Consumer), and Geography (Ghana). The Market Forecasts are Provided in Terms of Value (USD) and Volume (Subscriptions, Traffic).
| Voice Services |
| Data and Internet Services |
| Messaging Services |
| IoT and M2M Services |
| OTT and PayTV Services |
| Other Services (VAS, Roaming and International Services, Enterprise and Wholesale Services, Rest of Service Type) |
| Enterprises |
| Consumer |
| By Service Type | Voice Services |
| Data and Internet Services | |
| Messaging Services | |
| IoT and M2M Services | |
| OTT and PayTV Services | |
| Other Services (VAS, Roaming and International Services, Enterprise and Wholesale Services, Rest of Service Type) | |
| By End-user | Enterprises |
| Consumer |


Key Questions Answered in the Report
What is the current Ghana telecom market size and its growth outlook?
The Ghana telecom market size is projected at USD 1.99 billion in 2026 and is forecast to reach USD 2.32 billion by 2031, reflecting a 3.1% CAGR over 2026-2031 (Mordor Intelligence).
Which service type is growing fastest in Ghana’s telecom space?
IoT and M2M Services are expected to grow at a 4.52% CAGR through 2031, the highest among all service categories, driven by logistics tracking, smart metering, and agriculture sensors (Mordor Intelligence).
How concentrated is mobile money in Ghana?
MTN Mobile Money holds about 90% share of transaction volumes, supported by 26.7 million active accounts and GHS 4.5 trillion in value processed during 2025 (Mordor Intelligence).
What are the main obstacles to rural telecom expansion in Ghana?
High right-of-way fees, land acquisition delays, and intermittent grid power inflate rollout costs, though GIFEC subsidies and the Dig Once policy aim to mitigate these barriers (Mordor Intelligence).
How will the anticipated 5G auction affect competition?
If the National Communications Authority lifts Next-Gen InfraCo’s exclusivity, qualified retail operators may bid directly for millimeter-wave spectrum, potentially enhancing service rivalry in urban corridors (Mordor Intelligence).
Page last updated on:


