Tail Spend Management Solutions Market Size and Share
Market Overview
| Study Period | 2019 - 2030 |
|---|---|
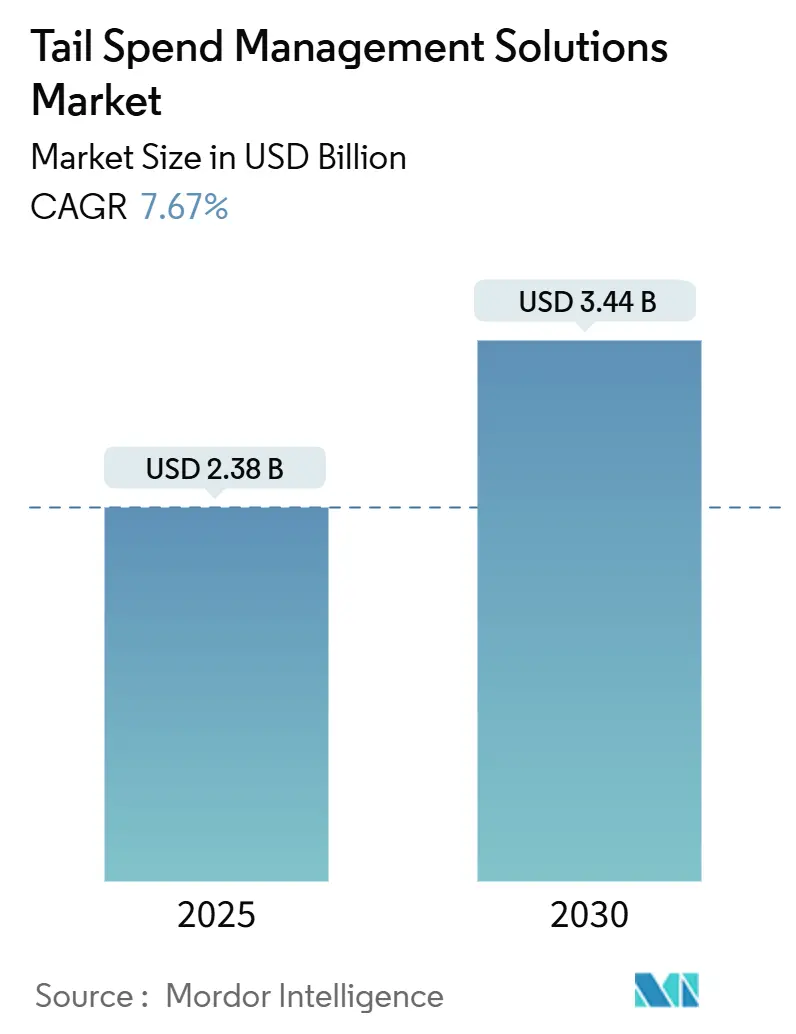
| Market Size (2025) | USD 2.38 Billion |
| Market Size (2030) | USD 3.44 Billion |
| Growth Rate (2025 - 2030) | 7.67% CAGR |
| Fastest Growing Market | Asia Pacific |
| Largest Market | North America |
| Market Concentration | Medium |
Major Players *Disclaimer: Major Players sorted in no particular order Image © Mordor Intelligence. Reuse requires attribution under CC BY 4.0. | |
Tail Spend Management Solutions Market Analysis by Mordor Intelligence
The tail spend management solutions market size stands at USD 2.38 billion in 2025 and is forecast to expand to USD 3.44 billion by 2030, reflecting a 7.67% CAGR. Heightened pressure to eliminate hidden procurement costs, combined with AI-driven consolidation of fragmented supplier data, anchors short-term growth. Enterprises view predictive analytics, autonomous buying desks, and real-time supplier risk scoring as levers that turn previously unmanaged invoices into measurable savings. Mature cloud security frameworks are lowering adoption barriers, while venture funding continues to push feature velocity and user-experience innovation. Strategic alliances between ERP giants and best-of-breed vendors further validate the market’s long-run opportunity.
Key Report Takeaways
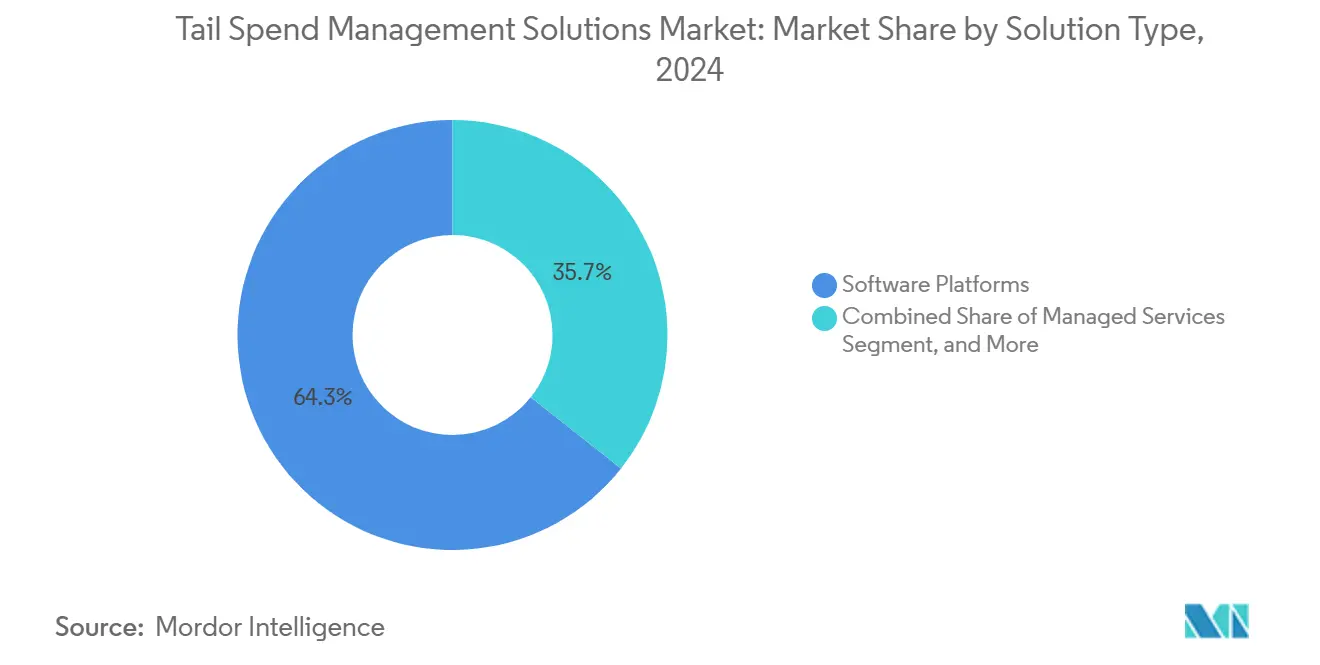
- By Solution Type, software platforms held 64.33% of the tail spend management solutions market share in 2024; managed services are projected to grow at 9.56% CAGR through 2030.
- By Deployment Mode, cloud deployment captured 69.24% of the tail spend management solutions market size in 2024, whereas hybrid deployment is on track for a 9.67% CAGR to 2030.
- By Organization Size, large enterprises accounted for 55.42% of the tail spend management solutions market share in 2024, yet small and medium enterprises (SMEs) represent the fastest-growing band at 9.93% CAGR.
- By Industry Vertical, manufacturing generated 22.46% of the tail spend management solutions market size in 2024; healthcare and life sciences lead forecast expansion with a 7.89% CAGR.
- By Geography, North America controlled 37.82% of the tail spend management solutions market share in 2024, while Asia-Pacific is advancing at an 8.14% CAGR toward 2030.
Global Tail Spend Management Solutions Market Trends and Insights
Drivers Impact Analysis*
| Driver | (~) % Impact on CAGR Forecast | Geographic Relevance | Impact Timeline |
|---|---|---|---|
| AI-driven spend analytics adoption | +1.8% | Global; North America and Europe lead | Medium term (2-4 years) |
| SaaS and cloud migration | +1.5% | Global; strongest in Asia-Pacific and North America | Short term (≤ 2 years) |
| Enterprise cost-optimization initiatives | +1.2% | Global; North America and Europe | Short term (≤ 2 years) |
| Regulatory push for visibility and ESG | +1.0% | Europe and North America | Medium term (2-4 years) |
| Gen-AI autonomous buying desks | +0.9% | North America and Europe early adoption | Long term (≥ 4 years) |
| Trade-war tariff complexity | +0.7% | Global; emphasis on US-China corridors | Medium term (2-4 years) |
| Source: Mordor Intelligence | |||
AI-driven Spend Analytics Adoption Accelerates Decision Intelligence
Machine-learning classification now processes thousands of low-value transactions in minutes, surfacing consolidation opportunities that legacy rules miss. Arkestro’s Predictive Procurement Orchestration platform claims savings acceleration of 2–5 times versus traditional methods. Mid-size manufacturers deploy these tools to rationalize indirect materials and unlock working capital. Real-time market intelligence layers on top of historical data to guide optimal buy timing. Seamless ERP connectors shorten deployment, reducing IT burden and widening C-suite sponsorship. As proof points accumulate, adoption moves from pilot projects to enterprise-wide rollouts.
SaaS Cloud Migration Democratizes Advanced Procurement Capabilities
Subscription pricing now links platform cost to realized savings, a structure that lowers risk for budget-constrained teams. Multi-tenant architectures push new features weekly without on-premise upgrade cycles. Healthcare providers spread across multiple facilities centralize visibility while avoiding local IT staffing. Security certifications such as ISO 27001 and SOC 2 address buyer concerns, reinforcing trust. SMEs embrace cloud because rapid activation delivers ROI within quarters, a timeline aligned to board-level performance goals.
Enterprise Cost-Optimization Initiatives Drive Procurement Transformation
CFOs target tail spend because it consumes up to 30% of procurement volume, yet historically lacked governance. [1]Hays Talent Solutions, “The Digitalisation of Procurement,” haystalentsolutions.com Financial-services groups use automated approval chains to curtail maverick professional-services spending, realizing 15–25% savings. The narrative has shifted: procurement tech is now framed as a direct earnings enhancer rather than discretionary IT. Workflow digitization also frees buyers to focus on supplier innovation programs, an intangible yet strategic dividend that boards increasingly monitor.
Regulatory Push for Spend Visibility and ESG Compliance
The German Supply Chain Due Diligence Act obliges firms with more than 1,000 employees to audit every supplier, including tail categories. [2]EcoVadis, “German Supply Chain Due Diligence Act Explained,” ecovadis.com Platforms respond by embedding automated questionnaires, risk scoring, and carbon-intensity analytics. Manufacturers that once tracked only primary vendors now map maintenance contractors and local logistics providers. Early adopters turn compliance into an advantage by flagging high-risk vendors before competitors do, safeguarding continuity and brand reputation.
Restraints Impact Analysis*
| Restraint | (~) % Impact on CAGR Forecast | Geographic Relevance | Impact Timeline |
|---|---|---|---|
| Cyber-security and data-sovereignty concerns | -0.8% | Global; Europe and Asia-Pacific | Short term (≤ 2 years) |
| Integration debt with legacy ERPs | -0.6% | Global; strongest in North America and Europe | Medium term (2-4 years) |
| Shortage of procurement data-science talent | -0.5% | Global; acute in North America and Europe | Long term (≥ 4 years) |
| Supplier fatigue from platform proliferation | -0.4% | Global; affects SME suppliers | Medium term (2-4 years) |
| Source: Mordor Intelligence | |||
Cyber-Security and Data-Sovereignty Concerns Constrain Cloud Adoption
GDPR and similar statutes restrict cross-border data flows, prompting vendors to invest in regional data centers. [3]LevaData, “How Digital Transformation Is Shaping Procurement,” levadata.com Financial services and healthcare buyers often insist on private-cloud or hybrid deployments, lengthening sales cycles. High-profile breaches amplify scrutiny of third-party SaaS vendors. Some buyers delay full-suite adoption, starting with analytics modules that handle anonymized data. While security certifications mitigate worry, the perception gap remains and slows near-term penetration.
Integration Debt with Legacy ERPs Limits Platform Effectiveness
Many Fortune 1000 firms run decades-old ERP stacks that lack modern APIs. Custom middleware raises implementation cost and prolongs project timelines, diluting ROI narratives. In response, solution providers launch pre-built connectors, yet complex multi-instance architectures still require bespoke tuning. Where friction persists, some buyers resort to manual data uploads that undermine real-time visibility goals. The result is a drag on uptake until legacy modernization programs advance.
*Our forecasts treat driver/restraint impacts as directional, not additive. The impact forecasts reflect baseline growth, mix effects, and variable interactions.
Segment Analysis
By Solution Type: Platforms Dominate, Services Accelerate
In 2024, software platforms commanded 64.33% of the tail spend management solutions market share. The segment benefits from unified modules that cover requisition, analytics, supplier risk, and payment reconciliation in a single interface. Continuous AI innovation keeps switching costs high, reinforcing vendor stickiness. Managed services, forecast at 9.56% CAGR, attract organizations lacking internal category depth, especially in indirect commodities. Advisory services remain steady as enterprises seek roadmap design and change-management support. The tail spend management solutions market size gains momentum as platforms embed predictive sourcing bots that auto-suggest supplier consolidation opportunities, reducing manual analysis hours.
Vendor roadmaps now emphasize no-code workflow builders and generative-AI assistants that draft negotiation messages. Manufacturing groups deploying platform suites enjoy standardized processes across global plants, a scale advantage difficult for services-only models to match. Yet hybrid “technology-plus-expertise” bundles emerge, melding platform speed with managed analytics, a synthesis likely to redefine competitive boundaries in the tail spend management solutions market over the next decade.


By Deployment Mode: Cloud Leads, While Hybrid Bridges Compliance Gaps
Cloud held 69.24% of the tail spend management solutions market size in 2024 as buyers pursued faster implementation and lower infrastructure overhead. Auto-scaling features align cost with transaction peaks, a priority for retailers during holiday seasons. Hybrid approaches are growing at a 9.67% CAGR, enabling sensitive invoice data to remain on-premise while analytics reside in the cloud. On-premise remains a niche for defense contractors and public-sector entities bound by stringent sovereignty clauses.
Maturing encryption, tokenization, and regional hosting ease earlier fears, yet hybrid adoption indicates that universal cloud trust is still evolving. Healthcare groups choose a hybrid to protect patient-linked purchase orders while leveraging SaaS collaboration tools. This coexistence model anchors near-term growth, ensuring the tail spend management solutions market reaches risk-averse buyers without forcing binary deployment choices.
By Organization Size: SME Adoption Surges Past Enterprise Pace
Large enterprises generated 55.42% of the tail spend management solutions market share in 2024, justified by global supplier footprints and multilayer approval chains that magnify savings potential. Feature depth, such as multi-entity governance and advanced audit trails, keeps this cohort loyal to top-tier vendors. SMEs, however, are advancing at 9.93% CAGR as subscription pricing removes the traditional capital-expenditure hurdle. SaaS wizards and templates allow deployment within weeks, aligning procurement maturity with fast-moving business models.
Mid-sized manufacturers, for example, now track maintenance, repair, and operations spend across multiple plants without adding headcount. Community forums and vendor-led academies fill skills gaps, ensuring self-service onboarding. The democratization effect broadens the tail spend management solutions market, making sophisticated control frameworks attainable regardless of company size and thereby accelerating total addressable market expansion.

By Industry Vertical: Manufacturing Remains Anchor, Healthcare Gains Speed
Manufacturing controlled 22.46% of the tail spend management solutions market size in 2024, reflecting high indirect-materials complexity from tooling, MRO supplies, and contract labor. Predictive sourcing bots help plants rationalize thousands of low-value suppliers into strategic panels. Healthcare and life sciences are set for a 7.89% CAGR, propelled by compliance with device-traceability and anti-kickback regulations. Automated supplier credentialing within platforms trims audit preparation time, a critical metric for hospital administrators.
Financial-services buyers increasingly target professional-services leakage, while IT-telecom companies automate software license renewals to curb shadow-IT risk. Retailers use AI to align promotional spend with vendor funding rules. Collectively, these vertical dynamics diversify the tail spend management solutions market revenue base, reducing reliance on any single industry and cushioning cyclical swings.
Geography Analysis
North America held 37.82% of the tail spend management solutions market share in 2024. Early cloud adoption, seasoned procurement teams, and dense vendor ecosystems all reinforce leadership. U.S. corporations integrate AI-powered spend analytics to benchmark category performance, while Canadian energy majors use platforms to harmonize site-level purchasing and comply with ESG disclosure mandates. Mexican manufacturers embrace centralized buying centers to navigate USMCA rules, extending platform demand across the trade corridor.
Asia-Pacific posts the fastest trajectory with an 8.14% CAGR toward 2030. Chinese conglomerates deploy predictive procurement to manage plant expansions, often selecting Mandarin-localized dashboards for user adoption. Japanese electronics firms focus on component obsolescence risk, integrating supplier risk scores into replenishment orders. India’s pharma exporters use cloud suites to accelerate vendor onboarding under global good-manufacturing-practice audits. Australia and ASEAN markets, aided by government digital-trade incentives, heighten demand among mining and logistics operators, leading to further broadening of the tail spend management solutions market.
Europe maintains momentum driven by stringent due diligence acts and carbon-accounting mandates. German automakers leverage hybrid deployments to keep data within EU borders while benefiting from cloud-based analytics. U.K. financial institutions pilot autonomous buying desks to offset post-Brexit import-cost volatility. Nordic retailers, early sustainability adopters, integrate eco-label scoring into requisition approval flows. Elsewhere, the Middle East and Africa experience first-wave adoption in public infrastructure projects, whereas South American multinationals prioritize platform rollouts in Brazil to navigate complex tax codes and supplier-invoicing rules, cementing regional relevance for the tail spend management solutions market.


Competitive Landscape
Competition is moderate, characterized by tier-one ERP providers, procurement-suite specialists, and AI-native upstarts. SAP and Oracle leverage installed ERP bases to cross-sell embedded tail spend modules, often bundling with finance automation to increase wallet share. GEP, JAGGAER, and Ivalua differentiate through vertical accelerators and deep category taxonomies. Vista Equity Partners’ 2025 acquisition of JAGGAER signals ongoing consolidation aimed at end-to-end platform breadth that reduces customer integration burden.
Challengers such as Zip, Arkestro, and Procurify elevate ease-of-use and AI as primary selling points. Zip’s USD 190 million Series D, valuing the firm at USD 2.2 billion, underscores investor conviction in consumer-grade procurement experiences. Arkestro partners with Infor LN to penetrate discrete manufacturing, demonstrating that ecosystem integration is a critical battleground. Feature roadmaps converge on self-service sourcing bots, autonomous purchase-order creation, and embedded ESG scoring. As capabilities converge, vendor credibility and implementation speed emerge as decisive factors for customer selection in the tail spend management solutions market.
Strategic alliances also shape dynamics. ERP vendors open marketplaces to certified partners, smoothing data exchanges and shortening proof-of-concept timelines. Managed-service providers white-label AI analytics to package outcome-based pricing. This cooperative-competitive mix elevates barriers for new entrants yet simultaneously expands solution choice for buyers. Market share evolution over the next five years hinges on balancing rapid functional rollouts with enterprise-grade governance, ensuring sustainable differentiation.
Tail Spend Management Solutions Industry Leaders
Coupa Software Incorporated
SAP SE
Oracle Corporation
GEP Worldwide LLC
JAGGAER LLC
- *Disclaimer: Major Players sorted in no particular order


Recent Industry Developments
- January 2025: Arkestro relocated its Museum of Procurement to Arizona State University, creating an academic hub for predictive purchasing research
- December 2024: Arkestro joined the Infor Marketplace with an Infor LN connector, deepening manufacturing reach.
- October 2024: Zip completed a USD 190 million Series D at a USD 2.2 billion valuation, the decade’s largest procurement-tech raise
- October 2024: Procurify secured new venture funding led by CIBC Innovation Banking to scale mid-market offerings


Global Tail Spend Management Solutions Market Report Scope
| Software Platforms |
| Managed Services |
| Advisory/Consulting Services |
| Cloud |
| On-Premise |
| Hybrid |
| Large Enterprises |
| Small and Medium Enterprises (SMEs) |
| Manufacturing |
| Healthcare and Life Sciences |
| Financial Services |
| IT and Telecom |
| Retail and E-commerce |
| Other Industry Vertical |
| North America | United States | |
| Canada | ||
| Mexico | ||
| Europe | Germany | |
| United Kingdom | ||
| France | ||
| Russia | ||
| Rest of Europe | ||
| Asia-Pacific | China | |
| Japan | ||
| India | ||
| South Korea | ||
| Australia | ||
| Rest of Asia-Pacific | ||
| Middle East and Africa | Middle East | Saudi Arabia |
| United Arab Emirates | ||
| Rest of Middle East | ||
| Africa | South Africa | |
| Egypt | ||
| Rest of Africa | ||
| South America | Brazil | |
| Argentina | ||
| Rest of South America | ||
| By Solution Type | Software Platforms | ||
| Managed Services | |||
| Advisory/Consulting Services | |||
| By Deployment Mode | Cloud | ||
| On-Premise | |||
| Hybrid | |||
| By Organization Size | Large Enterprises | ||
| Small and Medium Enterprises (SMEs) | |||
| By Industry Vertical | Manufacturing | ||
| Healthcare and Life Sciences | |||
| Financial Services | |||
| IT and Telecom | |||
| Retail and E-commerce | |||
| Other Industry Vertical | |||
| By Geography | North America | United States | |
| Canada | |||
| Mexico | |||
| Europe | Germany | ||
| United Kingdom | |||
| France | |||
| Russia | |||
| Rest of Europe | |||
| Asia-Pacific | China | ||
| Japan | |||
| India | |||
| South Korea | |||
| Australia | |||
| Rest of Asia-Pacific | |||
| Middle East and Africa | Middle East | Saudi Arabia | |
| United Arab Emirates | |||
| Rest of Middle East | |||
| Africa | South Africa | ||
| Egypt | |||
| Rest of Africa | |||
| South America | Brazil | ||
| Argentina | |||
| Rest of South America | |||


Key Questions Answered in the Report
How large is global spending on technology that manages low-value procurement?
The tail spend management solutions market size is USD 2.38 billion in 2025 and is projected to reach USD 3.44 billion by 2030 at a 7.67% CAGR.
Which deployment option is most popular among buyers today?
Cloud deployment leads with 69.24% share in 2024 because it offers rapid activation and lower infrastructure overhead.
Which region is growing fastest in adopting AI-based procurement tools?
Asia-Pacific is expanding at an 8.14% CAGR thanks to manufacturing expansion and government digital-trade incentives.
What segment of organizations is adopting these platforms the quickest?
Small and medium enterprises show the highest growth at 9.93% CAGR as SaaS pricing removes large capital hurdles.
Who are the main competitors in this space?
Major players include SAP, Oracle, GEP, JAGGAER, Coupa, and AI-native entrants such as Zip and Arkestro.
What savings can companies expect from AI-driven tail spend solutions?
Platforms like Arkestro report savings acceleration of 2–5 times compared with traditional manual approaches.
Page last updated on:


