Cloud FinOps Market Size and Share
Market Overview
| Study Period | 2020 - 2031 |
|---|---|
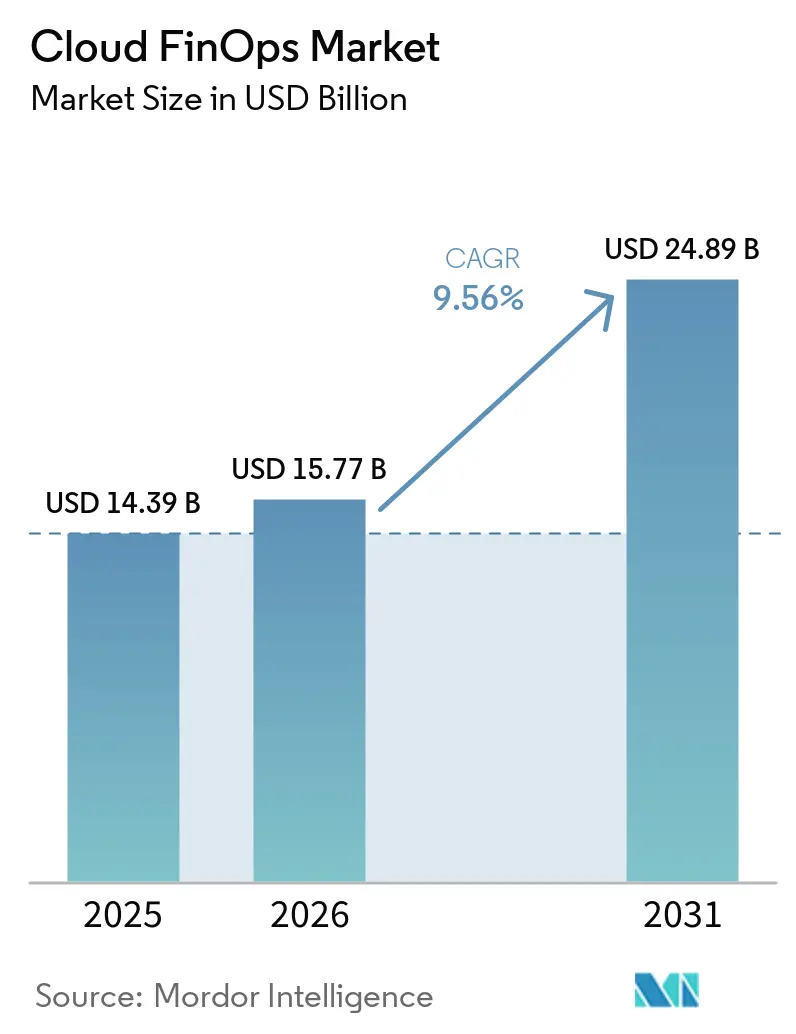
| Market Size (2026) | USD 15.77 Billion |
| Market Size (2031) | USD 24.89 Billion |
| Growth Rate (2026 - 2031) | 9.56% CAGR |
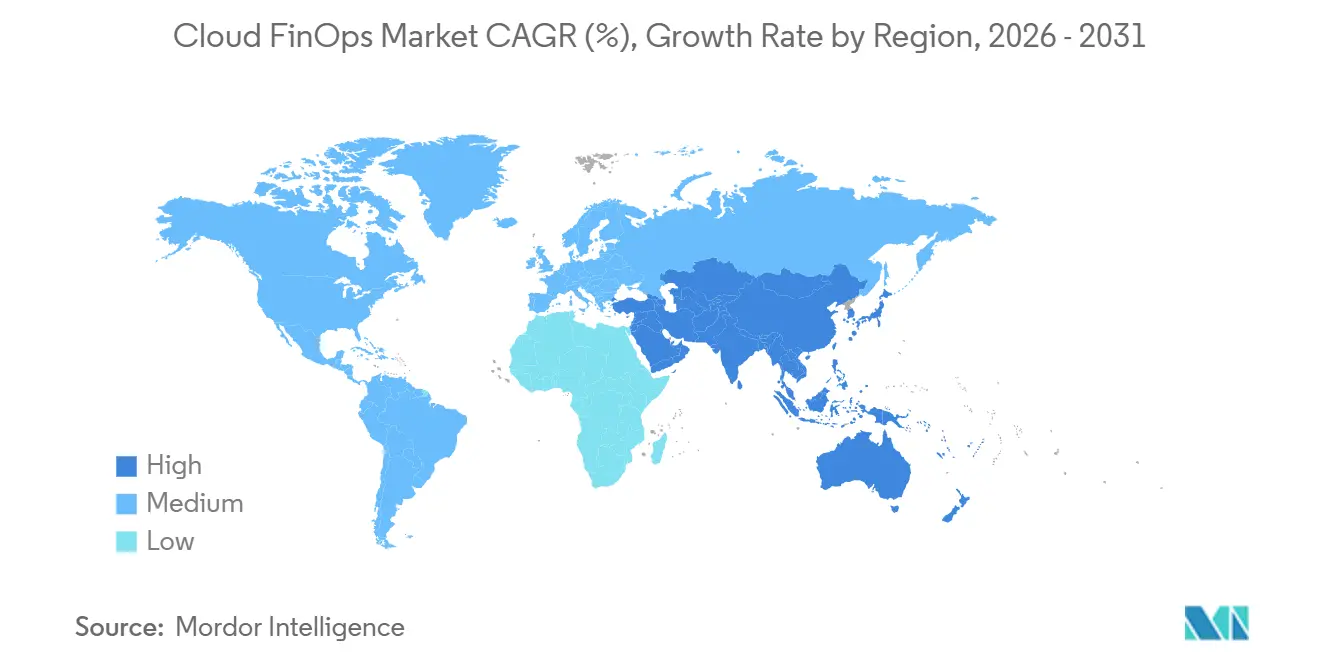
| Fastest Growing Market | Asia Pacific |
| Largest Market | North America |
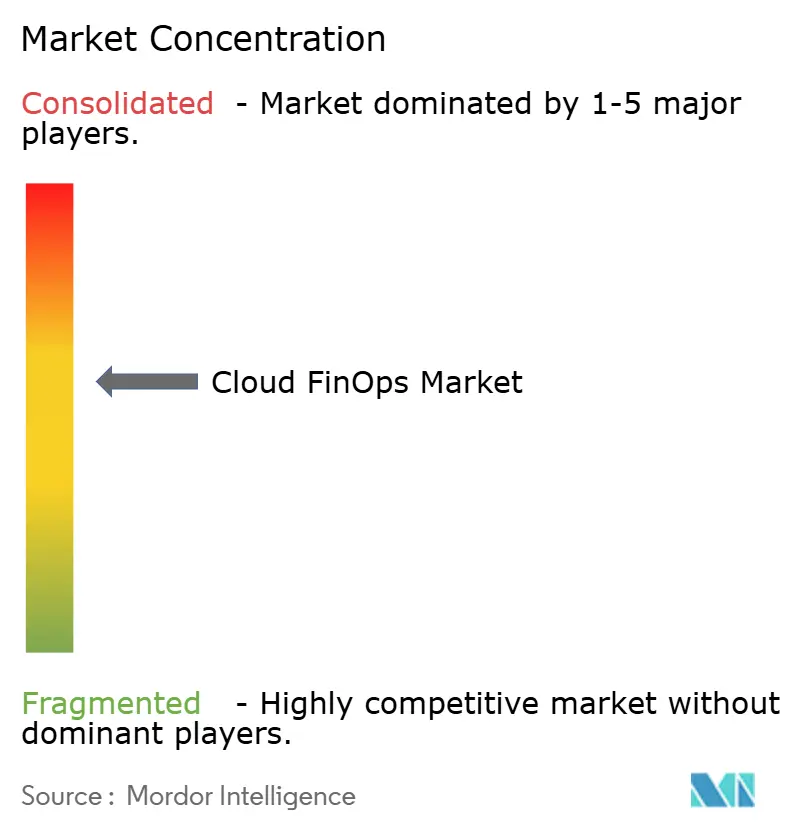
| Market Concentration | Medium |
Major Players *Disclaimer: Major Players sorted in no particular order Image © Mordor Intelligence. Reuse requires attribution under CC BY 4.0. | |
Cloud FinOps Market Analysis by Mordor Intelligence
The cloud FinOps market size is projected to expand from USD 15.77 billion in 2026 and USD 14.39 billion in 2025 to USD 24.89 billion by 2031, registering a CAGR of 9.56% between 2026 and 2031. Enterprises are shifting from periodic spend reviews to continuous financial governance as generative-AI inference costs eclipse training outlays, agentic AI chains multiply token consumption, and board-level oversight demands audit-ready reporting. Multi-cloud estates intensify cost-management complexity, while FinOps-as-code pipelines move budget controls into developer workflows. Certified-talent shortages are steering companies toward managed services, and GreenOps metrics tie cost optimization to ESG goals.
Key Report Takeaways
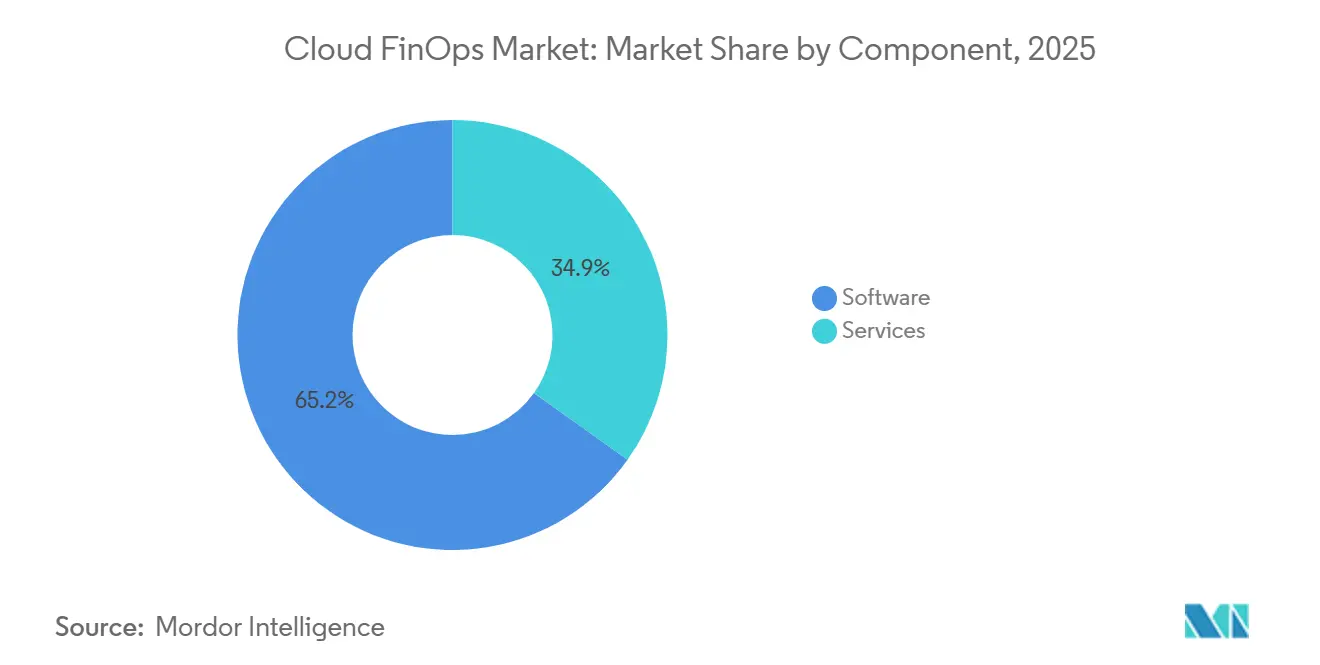
- By component, software commanded 65.15% of the cloud FinOps market share in 2025, and services are advancing at a 10.55% CAGR through 2031.
- By deployment type, public cloud represented 46.45% of revenue in 2025, and hybrid and multi-cloud deployments are expanding at an 11.34% CAGR to 2031.
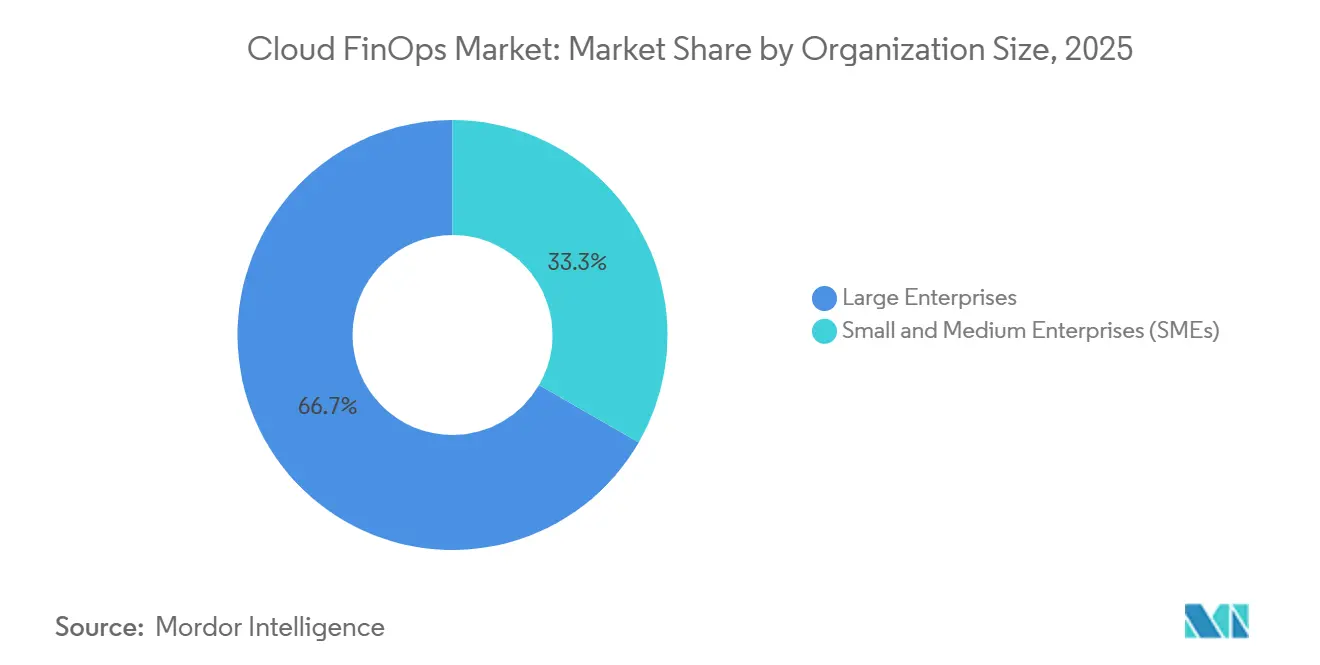
- By organization size, large enterprises accounted for 66.67% of adoption in 2025, and small and medium enterprises are scaling at an 11.42% CAGR to 2031.
- By end-user industry, information technology and telecommunications held a 23.45% share in 2025, and retail and e-commerce are projected to grow at an 11.04% CAGR through 2031.
- By geography, North America captured 37.45% of revenue in 2025, Asia-Pacific region is rising at a 12.21% CAGR to 2031.
Note: Market size and forecast figures in this report are generated using Mordor Intelligence’s proprietary estimation framework, updated with the latest available data and insights as of January 2026.
Global Cloud FinOps Market Trends and Insights
Drivers Impact Analysis*
| Driver | (~) % Impact on CAGR Forecast | Geographic Relevance | Impact Timeline |
|---|---|---|---|
| Escalating Multi-Cloud and Hybrid-Cloud Complexity Requires Unified Cost Governance | +2.8% | Global, high in North America and Europe | Medium term (2–4 years) |
| Mandatory CFO Oversight of Cloud Budgets After 2024 Audit-Rule Updates | +2.3% | North America and Europe, emerging in Asia-Pacific | Short term (≤ 2 years) |
| GenAI Workload Cost Spikes Raise Urgency for Granular Unit-Economics Tracking | +2.1% | Global, led by North America and Asia-Pacific AI hubs | Short term (≤ 2 years) |
| Mainstream Adoption of FinOps Framework v4.0 by Hyperscalers | +1.5% | Global | Medium term (2–4 years) |
| Carbon-Aware GreenOps Reporting Embedded in FinOps KPIs | +0.9% | Europe, North America | Long term (≥ 4 years) |
| Rise of Cloud-Native FinOps-as-Code Pipelines Integrated in CI/CD | +1.2% | Global | Medium term (2–4 years) |
| Source: Mordor Intelligence | |||
Escalating Multi-Cloud and Hybrid-Cloud Complexity Requires Unified Cost Governance
Organizations running workloads across Amazon Web Services, Microsoft Azure, and Google Cloud Platform navigate incompatible billing schemas, fragmented discount logic, and inconsistent tagging. The FinOps Open Cost and Usage Specification is normalizing data, yet hyperscalers prioritize proprietary lock-in, so enterprises adopt orchestration platforms that aggregate spend, allocate costs accurately, and enforce global policies. Financial services and telecommunications firms are early adopters, given regulatory segmentation that mandates precise chargeback. Unified governance is therefore a pivotal growth catalyst for the cloud FinOps market.[1]Google Cloud, “FinOps Framework v4.0 Support,” cloud.google.com
Mandatory CFO Oversight of Cloud Budgets After 2024 Audit-Rule Updates
Financial Accounting Standards Board guidance now treats multiyear cloud commitments as operating-lease liabilities, elevating cloud spend to the CFO agenda. A 2025 survey showed 66% of boards review cloud budgets, driving demand for audit-grade variance reporting and scenario modeling. United Kingdom banking examples illustrate savings exceeding GBP 3.8 million (USD 4.8 million) after centralizing FinOps. This regulatory driver accelerates adoption, reinforcing the credibility of the cloud FinOps market.[2]AWS, “Best Practices for Multi-Cloud Cost Management,” amazon.com
GenAI Workload Cost Spikes Raise Urgency for Granular Unit-Economics Tracking
Token-based pricing means inference costs can exceed model-training expenditures tenfold over a model’s life. Agentic AI chains amplify token counts, so retail platforms now benchmark cost-per-recommendation and adopt caching strategies that cut personalization expenses by up to 80%. Ninety-eight percent of enterprises monitor AI cloud spend today versus 31% two years ago, a swing that underscores the surge of the cloud FinOps market.[3]OpenAI, “Managing Token Costs in Production LLM Workloads,” openai.com
Mainstream Adoption of FinOps Framework v4.0 by Hyperscalers
Framework v4.0 extends financial governance beyond infrastructure to SaaS, data centers, and AI model licensing. Amazon Web Services, Microsoft Azure, and Google Cloud integrated these principles into native tools during 2025, enabling total cost-of-ownership comparisons across hybrid architectures. Adoption rose as 90% of FinOps teams now govern SaaS expenses compared with 65% two years ago, widening the scope of the cloud FinOps market.
Restraints Impact Analysis*
| Restraint | (~)% Impact on CAGR Forecast | Geographic Relevance | Impact Timeline |
|---|---|---|---|
| Shortage of Certified FinOps Practitioners Limits Enterprise Scaling | −1.8% | Global, acute in Asia-Pacific and Middle East | Medium term (2–4 years) |
| Disparate Billing APIs and Tagging Standards Complicate Data Normalization | −1.5% | Global | Medium term (2–4 years) |
| Resistance from Dev Teams to Real-Time Cost Guardrails Slows Automation | −0.9% | North America and Europe | Short term (≤ 2 years) |
| Edge and Sovereign-Cloud Data-Locality Rules Fragment Visibility | −0.7% | Europe, China, Middle East | Long term (≥ 4 years) |
| Source: Mordor Intelligence | |||
Shortage of Certified FinOps Practitioners Limits Enterprise Scaling
The FinOps Foundation has issued thousands of certifications, yet demand outpaces supply, especially in Asia-Pacific and Middle East markets. Enterprises pay premiums for external consultants, increasing program costs and slowing the shift from manual reviews to automated governance. Small and medium enterprises feel the pinch most acutely, often accepting shallow optimization limited to reserved-instance purchases rather than advanced rightsizing. The talent gap therefore restrains the cloud FinOps market.
Disparate Billing APIs and Tagging Standards Complicate Data Normalization
Hyperscaler billing exports differ in field names, granularity, and discount attribution, forcing companies to build custom ETL pipelines that introduce latency and risk. Tagging completeness across clouds averages below 40%, undermining chargeback accuracy. Time diverted to data plumbing delays optimization and frustrates stakeholders seeking real-time insights, placing a drag on the cloud FinOps market.
*Our forecasts treat driver/restraint impacts as directional, not additive. The impact forecasts reflect baseline growth, mix effects, and variable interactions.
Segment Analysis
By Component: Services Surge as Talent Scarcity Drives Outsourcing
In 2025, software held a dominant 65.15% share of the cloud FinOps market, reflecting its critical role in enabling organizations to manage cloud financial operations effectively. However, services are projected to experience significant growth, with a robust 10.55% CAGR, driven largely by the lack of in-house expertise within organizations. This gap has created opportunities for managed-service providers, who are increasingly integrating FinOps into broader digital transformation initiatives. At the same time, consultancies are stepping in to address this need by training internal teams and executing targeted optimization sprints to enhance operational efficiency.
Small and medium enterprises (SMEs) are showing a preference for flat-fee pricing models, which eliminate the unpredictability of percentage-of-spend fees. These models align well with the constrained budgets typical of growth-stage businesses, making them an attractive option for this segment. On the software side, vendors are continuously innovating to strengthen their platforms. They are incorporating advanced features such as AI-driven anomaly detection to identify irregularities, Terraform integration to streamline infrastructure management, and carbon forecasting to support sustainability goals. These enhancements not only improve functionality but also increase platform stickiness, encouraging long-term customer retention. The interplay between automation and advisory services is creating a layered value proposition that appeals to a wide range of organizations. This combination sustains the momentum of the cloud FinOps market, ensuring its continued growth and relevance in an increasingly cloud-driven business environment.


By Deployment Type: Hybrid and Multi-Cloud Governance Complexity Fuels Fastest Growth
In 2025, public cloud spending accounted for 46.45% of the total cloud expenditure. However, hybrid and multi-cloud estates are witnessing significant growth, expanding at an 11.34% CAGR as companies increasingly adopt these models to mitigate the risks associated with vendor lock-in. The inability to transfer reserved-instance discounts across providers has resulted in fragmented commitment management, adding complexity to cloud cost optimization strategies. Despite the rise of public and hybrid cloud models, private cloud remains a critical component in regulated sectors due to its compliance and security advantages.
Meanwhile, FinOps tools are evolving to implement consistent tagging and chargeback policies, ensuring uniformity across on-premises, edge, and public workloads. The Open Cost and Usage Specification seeks to standardize data inputs across platforms, but inconsistent adoption has underscored the continued demand for third-party normalization engines to streamline operations. This growing complexity in managing cloud environments is driving the cloud FinOps market to experience a steep and sustained growth trajectory.
By Organization Size: SMEs Embrace FinOps-as-Code to Bypass Talent Constraints
In 2025, large enterprises dominated the cloud FinOps market, securing 66.67% of the share. This dominance can be attributed to their ability to leverage centralized teams and strong executive sponsorship, which enable efficient financial operations and governance. These enterprises benefit from economies of scale and established processes, allowing them to optimize cloud spending effectively. Meanwhile, small and medium enterprises (SMEs) emerged as the fastest-growing segment, achieving an impressive 11.42% compound annual growth rate (CAGR). SMEs are increasingly embedding policy guardrails into their CI/CD pipelines, which helps automate governance and ensures compliance with financial policies.
Developers within these organizations are adopting FinOps-as-code frameworks, such as HashiCorp Terraform and Open Policy Agent, to enforce budget limits during the provisioning process. These frameworks empower SMEs to maintain control over cloud costs while scaling their operations. Startups, which often prioritize cash-flow stability, are opting for flat-rate subscription models offered by vendors like CloudZero. These models help reduce fee volatility, aligning with the financial priorities of smaller organizations that operate on tighter budgets. As SMEs continue to scale their cloud footprints, they are driving demand for accessible and user-friendly platforms. This growing demand is playing a significant role in expanding the overall size of the cloud FinOps market, highlighting the importance of tailored solutions for diverse organizational needs.
By End-User Industry: Retail and E-Commerce Leads Growth on Unit-Economics Imperatives
In 2025, the information technology and telecommunications sectors held a 23.45% market share, driven by the optimization of hyperscale fleets to maintain competitive pricing and operational efficiency. This strategic approach enabled these sectors to address increasing demands while defending their price points in a highly competitive environment. Retail and e-commerce, experiencing a robust growth rate of 11.04% CAGR, are focusing on critical metrics such as cost per order, customer acquisition costs, and personalized recommendations. These efforts aim to safeguard profit margins and enhance customer satisfaction in a rapidly evolving digital marketplace. The rise of generative-AI workloads has significantly amplified inference spending, making the availability and analysis of granular metrics indispensable for businesses to optimize their operations and investments. In the banking, financial services, and insurance sectors, firms are increasingly relying on FinOps to effectively manage hybrid IT estates.
These estates integrate traditional core-banking mainframes with advanced cloud analytics, enabling organizations to achieve operational agility and cost efficiency. Similarly, the healthcare industry has adopted FinOps practices to balance stringent regulatory compliance requirements with the growing need for AI-driven research and innovation. Across industries, the adoption of quantitative key performance indicators (KPIs) has become a critical driver for the implementation of cloud FinOps. These KPIs provide actionable insights that help organizations streamline processes, optimize costs, and enhance decision-making. This widespread reliance on data-driven strategies highlights the strong growth trajectory of the cloud FinOps market, as businesses across sectors increasingly recognize its value in achieving operational excellence and long-term sustainability.
Geography Analysis
In 2025, North America dominated the cloud FinOps market, accounting for 37.45% of the revenue share. This leadership was driven by the presence of hyperscaler headquarters, early adoption of the FinOps Foundation, and a deep talent pool. Boards across the region increasingly treat cloud budgets as strategic levers, accelerating the maturity of FinOps practices. These factors collectively position North America as a key player in the global market, setting benchmarks for other regions to follow.
Europe followed closely, where the Corporate Sustainability Reporting Directive played a pivotal role by incorporating GreenOps carbon metrics into financial reviews. This integration aligns cost management with ESG (Environmental, Social, and Governance) priorities, reflecting a growing emphasis on sustainability. Meanwhile, Asia-Pacific emerged as the fastest-growing region, with a remarkable 12.21% CAGR. The region's growth is anchored by the expansion of hyperscalers in China, India, and Korea, alongside localized IT services that adapt FinOps practices to address multilingual billing complexities.
The Middle East and Africa also witnessed momentum, driven by sovereign-cloud mandates in Saudi Arabia and the UAE, which spurred demand for platforms compliant with national regulations. However, the scarcity of certified talent in the region has slowed the pace of scaling these initiatives. In South America, the market remains in its emerging phase, with Brazil and Argentina leading the adoption of FinOps practices, particularly in the e-commerce and financial services sectors. This diverse geographic spread highlights the global rise of the cloud FinOps market, showcasing its growing importance across regions.

Competitive Landscape
The cloud FinOps market is characterized by competition between third-party platforms and native hyperscaler tools. Key players such as Apptio, VMware CloudHealth, Flexera, and CloudZero differentiate themselves through features like multi-cloud normalization, anomaly detection, and pricing flexibility. In contrast, hyperscalers like AWS, Azure, and Google Cloud embed FinOps capabilities but remain focused on single-cloud solutions.
This single-cloud orientation has led enterprises with diversified cloud estates to adopt third-party suites to meet their broader requirements. The market is also undergoing significant consolidation. In January 2026, Flexera expanded its offerings by acquiring ProsperOps and Chaos Genius, while DoiT acquired PerfectScale in February 2025. Additionally, ScaleOps secured USD 130 million in March 2026 to scale its autonomous optimization capabilities. These developments highlight the growing emphasis on enhancing FinOps tools and services to meet evolving enterprise needs. Vendors are experimenting with various pricing models, including percentages of spend, percentages of savings, and flat-rate structures, to cater to both enterprise and SME budgets effectively.
Despite these advancements, challenges persist in edge and sovereign-cloud environments, where data-locality regulations limit centralized visibility. However, the adoption of AI-driven automation and FinOps-as-code integrations is driving a shift from reactive analysis to proactive controls. This evolution underscores the sustained innovation within the cloud FinOps market, as vendors strive to address emerging needs and maintain a competitive edge in this dynamic landscape.
Cloud FinOps Industry Leaders
Apptio, Inc.
VMware, Inc. (Broadcom, Inc.)
Flexera Software LLC
CloudZero, Inc.
Densify Inc.
- *Disclaimer: Major Players sorted in no particular order

Recent Industry Developments
- March 2026: ScaleOps closed a USD 130 million Series C round to expand its autonomous optimization platform.
- January 2026: Flexera acquired ProsperOps and Chaos Genius, adding autonomous discount management and data FinOps to its suite.
- January 2026: Flexera launched real-time FinOps KPIs and carbon forecasting to align with European ESG mandates.
- November 2025: IBM Apptio integrated HashiCorp Terraform governance, embedding cost policies at provisioning.


Global Cloud FinOps Market Report Scope
The Cloud FinOps Market is experiencing significant growth, focusing on Cloud Financial Operations (FinOps). This framework integrates finance, engineering, and business teams, prioritizing financial accountability and cost optimization within cloud computing.
The Cloud FinOps Market Report is Segmented by Component (Software, Services), Deployment Type (Public Cloud, Private Cloud, Hybrid and Multi-Cloud), Organization Size (Large Enterprises, Small and Medium Enterprises), End-User Industry (IT and Telecommunications, Banking Financial Services and Insurance, Retail and E-Commerce, Healthcare and Life Sciences, Manufacturing, Government and Public Sector), and Geography (North America, South America, Europe, Asia-Pacific, Middle East and Africa). The Market Forecasts are Provided in Terms of Value (USD).
| Software |
| Services |
| Public Cloud |
| Private Cloud |
| Hybrid / Multi-Cloud |
| Large Enterprises |
| Small and Medium Enterprises (SMEs) |
| IT and Telecommunications |
| Banking, Financial Services and Insurance |
| Retail and E-Commerce |
| Healthcare and Life Sciences |
| Manufacturing |
| Government and Public Sector |
| North America | United States | |
| Canada | ||
| Mexico | ||
| South America | Brazil | |
| Argentina | ||
| Rest of South America | ||
| Europe | Germany | |
| United Kingdom | ||
| France | ||
| Italy | ||
| Spain | ||
| Russia | ||
| Rest of Europe | ||
| Asia-Pacific | China | |
| Japan | ||
| India | ||
| South Korea | ||
| Australia and New Zealand | ||
| Rest of Asia-Pacific | ||
| Middle East and Africa | Middle East | Saudi Arabia |
| United Arab Emirates | ||
| Turkey | ||
| Rest of Middle East | ||
| Africa | South Africa | |
| Nigeria | ||
| Egypt | ||
| Rest of Africa | ||
| By Component | Software | ||
| Services | |||
| By Deployment Type | Public Cloud | ||
| Private Cloud | |||
| Hybrid / Multi-Cloud | |||
| By Organization Size | Large Enterprises | ||
| Small and Medium Enterprises (SMEs) | |||
| By End-User Industry | IT and Telecommunications | ||
| Banking, Financial Services and Insurance | |||
| Retail and E-Commerce | |||
| Healthcare and Life Sciences | |||
| Manufacturing | |||
| Government and Public Sector | |||
| By Geography | North America | United States | |
| Canada | |||
| Mexico | |||
| South America | Brazil | ||
| Argentina | |||
| Rest of South America | |||
| Europe | Germany | ||
| United Kingdom | |||
| France | |||
| Italy | |||
| Spain | |||
| Russia | |||
| Rest of Europe | |||
| Asia-Pacific | China | ||
| Japan | |||
| India | |||
| South Korea | |||
| Australia and New Zealand | |||
| Rest of Asia-Pacific | |||
| Middle East and Africa | Middle East | Saudi Arabia | |
| United Arab Emirates | |||
| Turkey | |||
| Rest of Middle East | |||
| Africa | South Africa | ||
| Nigeria | |||
| Egypt | |||
| Rest of Africa | |||


Key Questions Answered in the Report
What is the projected value of the cloud FinOps market by 2031?
The cloud FinOps market is forecast to reach USD 24.89 billion by 2031, expanding at a 9.56% CAGR.
Which component is growing fastest within cloud FinOps?
Services are advancing at a 10.55% CAGR as firms outsource expertise to address the certified-talent gap.
Which deployment environment will see the highest growth?
Hybrid and multi-cloud environments are set to grow at an 11.34% CAGR as organizations distribute workloads to avoid vendor lock-in.
Why is retail and e-commerce adopting cloud FinOps rapidly?
Retailers focus on cost-per-order and model-inference expenses, driving an 11.04% CAGR for the segment.
Which region is the fastest-growing cloud FinOps adopter?
Asia-Pacific leads with a 12.21% CAGR, fueled by hyperscaler expansion and localized IT-services enablement.
How concentrated is vendor competition in cloud FinOps?
The market is fragmented, with no single dominant player and multiple platforms competing for share.
Page last updated on:


