Cash Management System Market Size and Share
Market Overview
| Study Period | 2020 - 2031 |
|---|---|
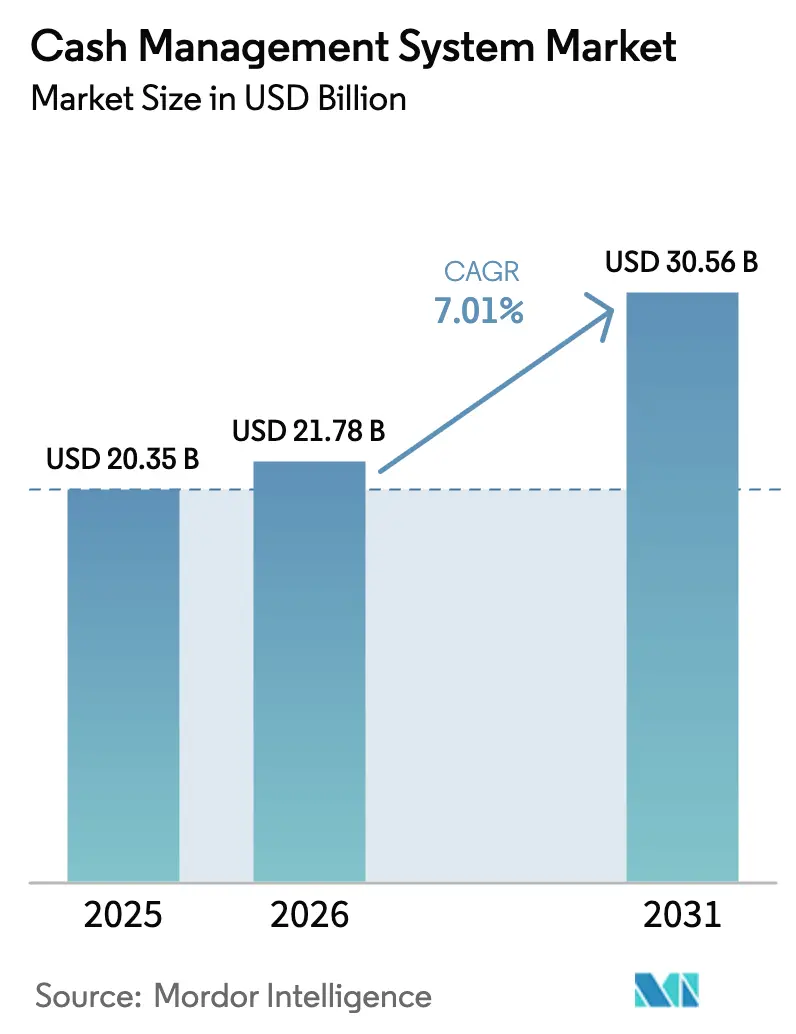
| Market Size (2026) | USD 21.78 Billion |
| Market Size (2031) | USD 30.56 Billion |
| Growth Rate (2026 - 2031) | 7.01% CAGR |
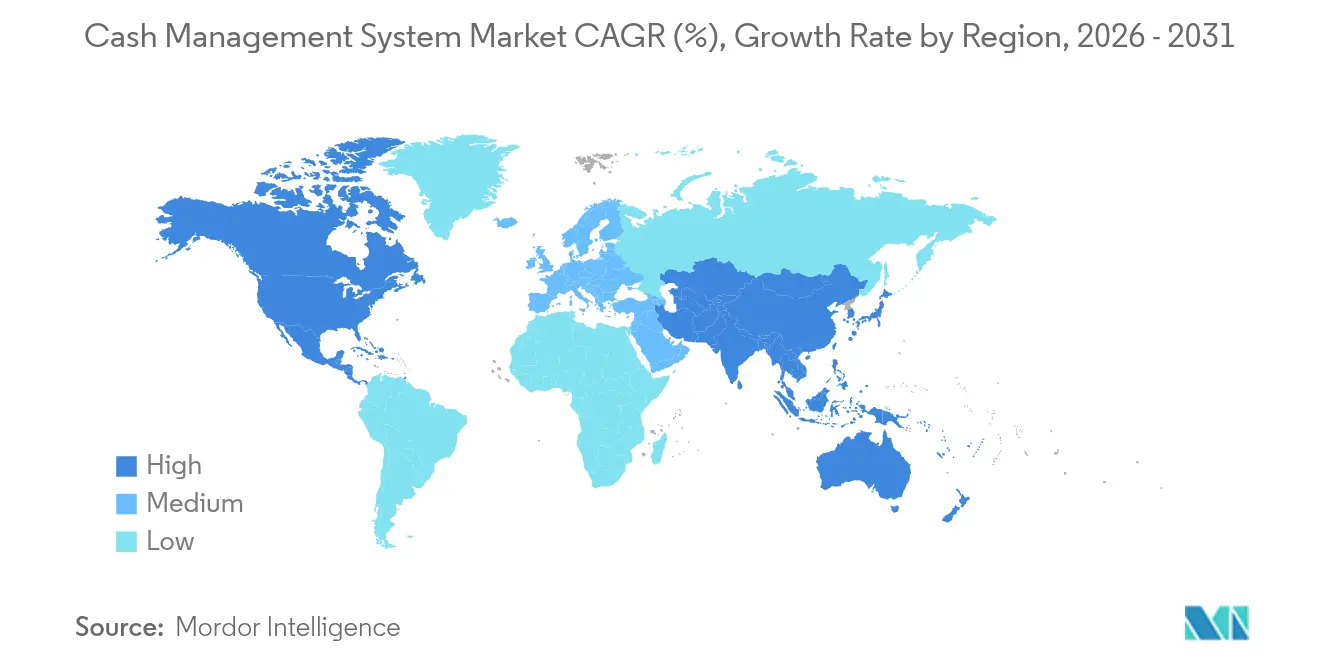
| Fastest Growing Market | Asia Pacific |
| Largest Market | North America |
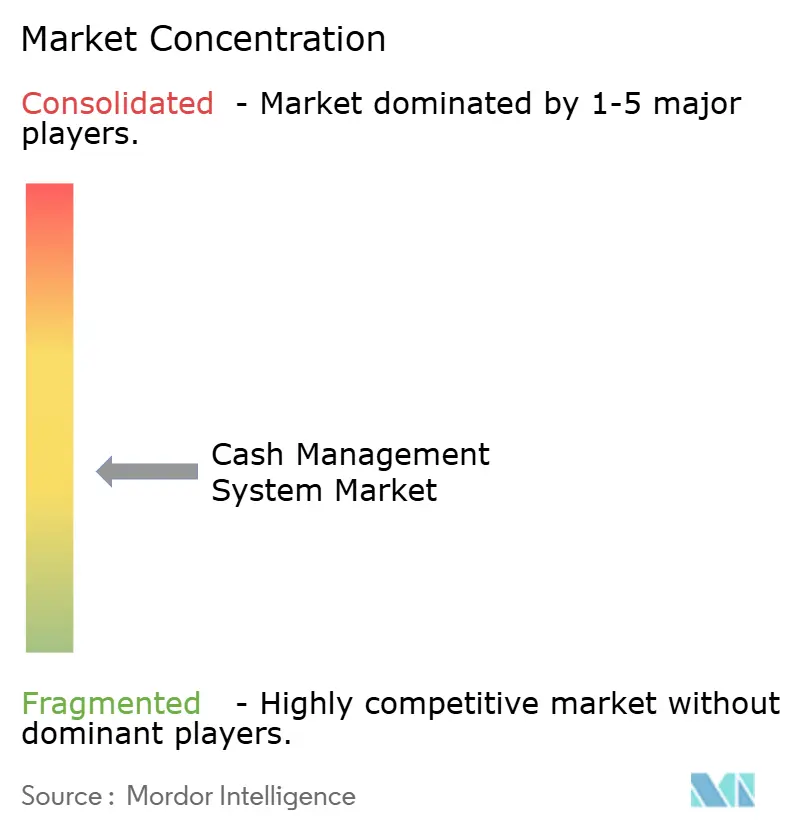
| Market Concentration | Medium |
Major Players *Disclaimer: Major Players sorted in no particular order Image © Mordor Intelligence. Reuse requires attribution under CC BY 4.0. | |
Cash Management System Market Analysis by Mordor Intelligence
The Cash Management System Market size is expected to increase from USD 20.35 billion in 2025 to USD 21.78 billion in 2026 and reach USD 30.56 billion by 2031, growing at a CAGR of 7.01% over 2026-2031.
Rapid adoption of AI-based cash-flow forecasting, mandatory Basel IV liquidity stress tests, and the global rollout of ISO 20022 real-time payment rails are reshaping treasury operations and expanding vendor addressable revenue. Cloud-native platforms that connect banks, ERPs, and fintech APIs are replacing legacy systems as finance leaders seek scalable tools that cut IT overhead[1]Nomentia, “Treasury Technology Trends 2025,” nomentia.com. Growing pressure to unlock working capital—estimated at USD 1.76 trillion for US corporations—further supports demand for end-to-end treasury solutions. At the same time, boards expect treasury teams to steer ESG programs, cybersecurity, and fraud risk, reinforcing the need for sophisticated, always-on cash visibility.
Key Report Takeaways
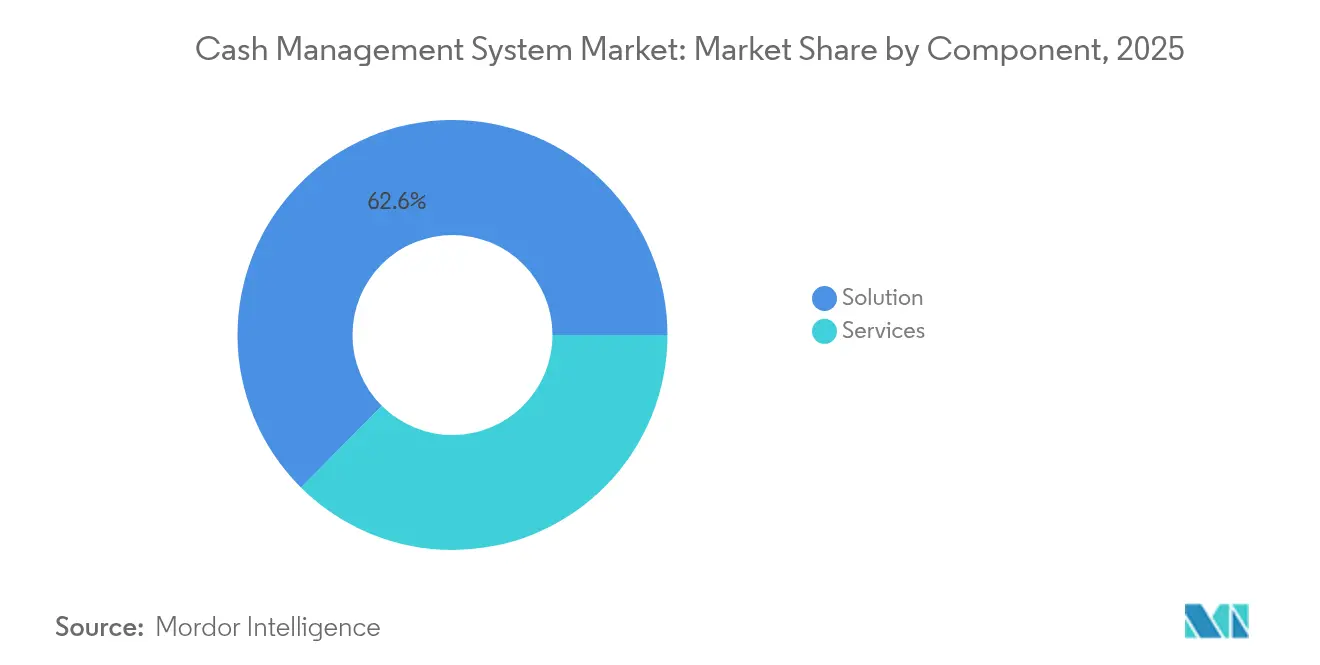
- By component, solutions led with 62.55% revenue share in 2025; services are projected to expand at a 13.92% CAGR to 2031.
- By organization size, large enterprises held 59.05% of the cash management system market share in 2025, while SMEs are advancing at a 16.02% CAGR through 2031.
- By deployment mode, cloud deployments accounted for 64.05% share of the cash management system market size in 2025 and are set to register an 18.14% CAGR to 2031.
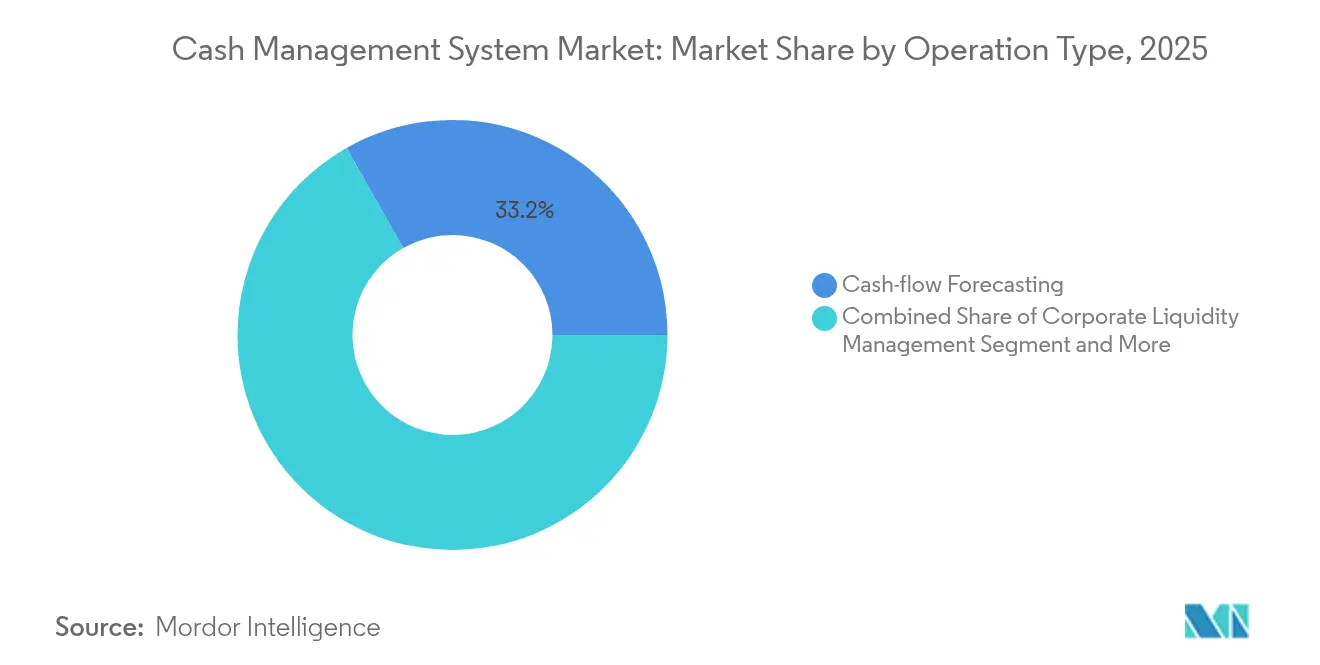
- By operation type, cash-flow forecasting captured a 33.20% share of the cash management system market size in 2025 and is expanding at a 18.95% CAGR through 2031.
- By end-user industry, BFSI led with 27.05% revenue share in 2025; retail & e-commerce is the fastest-growing segment at a 13.43% CAGR to 2031.
- By geography, North America commanded a 39.05% share in 2025, while Asia-Pacific is growing at a 13.29% CAGR through 2031.
Note: Market size and forecast figures in this report are generated using Mordor Intelligence’s proprietary estimation framework, updated with the latest available data and insights as of 2026.
Global Cash Management System Market Trends and Insights
Drivers Impact Analysis*
| Driver | (~) % Impact on CAGR Forecast | Geographic Relevance | Impact Timeline |
|---|---|---|---|
| AI-driven cash-flow forecasting | +2.1% | Global, North America and Europe in front | Medium term (2-4 years) |
| Real-time/instant payments infrastructure | +1.8% | Global; ISO 20022 mandates worldwide | Short term (≤ 2 years) |
| Cloud-native treasury platforms | +1.5% | Global, highest uptake in Asia-Pacific | Medium term (2-4 years) |
| Corporate push for working-capital optimization | +1.3% | North America and Europe, expanding to Asia-Pacific | Long term (≥ 4 years) |
| Open-banking and API standardization | +1.0% | Global | Short term (≤ 2 years) |
| Mandatory Basel IV liquidity-risk stress testing | +0.8% | Global banking sector | Long term (≥ 4 years) |
| Source: Mordor Intelligence | |||
Surge in AI-driven Cash-flow Forecasting
AI models lift forecast accuracy by up to 50%, turning reactive cash tracking into proactive scenario planning across the cash management system market. Algorithms blend historic data with real-time market feeds, allowing treasurers to stress-test liquidity positions and act faster on funding needs. Pandemic-era volatility and rising rates accelerated adoption, and future pairing with blockchain and quantum tools promises still deeper insight.
Expansion of Real-time / Instant Payments Infrastructure
ISO 20022 migration deadlines—for example, the Fedwire switch planned for March 2025—require round-the-clock liquidity and richer transaction data. Banks processing trillions daily, such as J.P. Morgan, are rolling out programmable, blockchain-enabled rails that cut operational steps by 70%. Treasuries must therefore upgrade systems to handle continuous settlement and detailed message formats.
Growing Adoption of Cloud-native Treasury Platforms
Organizations favor cloud setups that deploy in weeks, update automatically, and embed AI tools without capital spend. FIS’s Quantum Cloud Edition, launched in May 2025, underscores the shift by supporting higher volumes and a real-time liquidity hub. Cloud also supports flexible work models and helps ease a looming talent gap as many public-sector finance staff near retirement.
Corporate Push for Working-Capital Optimization
US firms have USD 1.76 trillion tied up in inefficient cycles, with DSO rising to 40.1 days. BCG shows earnings can climb 5%-10% when net working capital is tightened. Platforms automate discounting, reconciliation, and analytics, letting companies capture double-digit returns on surplus cash, further strengthening growth prospects in the cash management system market.
Restraint Impact Analysis*
| Restraint | (~) % Impact on CAGR Forecast | Geographic Relevance | Impact Timeline |
|---|---|---|---|
| Cyber-security and fraud vulnerabilities | -1.2% | Global; highest risk in digital leaders | Short term (≤ 2 years) |
| Legacy ERP / bank-connectivity integration hurdles | -0.9% | North America and Europe, spreading globally | Medium term (2-4 years) |
| High implementation cost and capital expenditure | -0.6% | Global; acute for heavily regulated sectors | Medium term (2-4 years) |
| Treasury talent shortage and workforce aging | -0.4% | North America and Europe | Long term (≥ 4 years) |
| Source: Mordor Intelligence | |||
Cybersecurity and Fraud Vulnerabilities
Average US breach losses exceed USD 9 million, underscoring the growing importance of cybersecurity in modern treasury operations, while AI-generated deepfakes add new threats. Treasury units face rising check forgery, card fraud, and payee manipulation, prompting regulators to call for stronger playbooks and identity frameworks. Smaller firms with limited budgets remain particularly exposed.
Legacy ERP / Bank-connectivity Integration Hurdles
Citi surveys show many companies still rely on spreadsheets despite owning TMS licenses. Multiple file formats, middleware choices, and bank APIs stretch IT teams, leading to delayed projects and fragmented data. Mid-market firms feel the pain most, widening the capability gap.
*Our forecasts treat driver/restraint impacts as directional, not additive. The impact forecasts reflect baseline growth, mix effects, and variable interactions.
Segment Analysis
By Component: Services Segment Accelerates Digital Transformation
The solutions category accounted for 62.55% of the cash management system market in 2025, reflecting the need for core software licenses and platform rollouts. Yet services revenue is expanding at 13.92% CAGR as firms turn to experts for ISO 20022 mapping, Basel IV rule alignment, and AI model training. Services now drive multi-year engagements covering integration, data migration, and user onboarding. Long projects-often 12-18 months-support recurring consulting revenue that can surpass initial license fees. Managed services that monitor cyber risks and regulatory updates lock in sticky contracts, and vendors package support bundles to guarantee business continuity.
The services boom also signals recognition that success hinges on skills rather than software alone. Consultants configure APIs for dozens of banks, rationalize workflow logic, and deliver dashboards that cut manual reconciliation time. This helps clients trim days of working capital and reduce dependency on aging spreadsheets. As cloud adoption rises, service teams pivot to monitoring, performance tuning, and embedding emerging analytics. This ongoing shift boosts the profile of service providers inside the cash management system market, paving the way for scalable annuity income streams.


By Organization Size: SME Digitization Drives Market Democratization
Large enterprises retained 59.05% revenue in 2025 thanks to complex multi-bank networks and sizable cash pools within the cash management system market. However, SMEs are posting a 16.02% CAGR, the fastest across organization tiers, as cloud SaaS removes infrastructure and upfront license hurdles. Pre-configured templates and bank-agnostic connectors go live in weeks, letting mid-market CFOs automate 75% of manual tasks. Vendors price seats monthly, aligning with limited budgets and enabling rapid ROI.
Competition intensifies as fintech challengers tailor intuitive dashboards and low-code interfaces for finance teams with minimal IT staff. SME demand reflects regulatory parity: ISO 20022 and fraud rules apply equally to firms of any size. Consequently, the cash management system’s market penetration is increasing in the mid-market cohort. Adoption lifts transparency, freeing trapped cash and supporting export growth for smaller manufacturers and online retailers that previously lacked treasury sophistication.
By Deployment Mode: Cloud Dominance Accelerates Platform Innovation
Cloud captured 64.05% of the cash management system market share in 2025 and is forecast to expand at an 18.14% CAGR. Clients appreciate subscription pricing, automatic patching, and elastic compute that accommodate intraday spikes tied to real-time payments. On-premises remains in place for jurisdictions with stringent data rules, while hybrid setups help firms migrate gradually or maintain regional data centers.
APIs are central to the cloud story. They create a single integration layer to banks, ERPs, FX portals, and AI engines, overcoming the file-based limits of older technology. FIS’s Quantum Cloud Edition highlights the roadmap: embedded analytics, multi-asset liquidity hubs, and event-driven risk alerts. Ongoing innovation cements cloud as the default choice for new projects, widening the addressable cash management system market.
By Operation Type: AI-Enhanced Forecasting Transforms Cash Management
Cash-flow forecasting already represents 33.20% of revenue and is expanding at 18.95% CAGR, the highest among operation types. Accurate prediction directly affects funding cost, capital allocation, and shareholder returns. Machine learning models digest ERP, POS, and macro data, generating scenario-based forecasts that help treasurers plan liquidity buffers. This capability is critical after the rate hikes of 2024-2025, which raised the price of idle balances and short-term borrowing. Complementary functions such as payables and receivables automation advance at solid double-digit rates, fueled by working-capital programs. Yet forecasting stands out because it feeds every decision node-from early payment discounts to intercompany loans. Vendors differentiate on algorithm transparency, data lineage, and explainable AI, features that meet both audit requirements and board scrutiny. Over the forecast window, the segment’s contribution to the overall cash management system market is expected to widen as CFOs prioritize analytics over transaction processing.
By End-user Industry: Retail Digitization Outpaces Traditional Finance
The BFSI sector generated 27.05% of 2025 revenue, reflecting heavy compliance loads and high transaction volumes. However, retail and e-commerce are projected to climb at a 13.43% CAGR as omnichannel sellers juggle card, wallet, and buy-now-pay-later flows. Treasury teams in this arena need rapid reconciliation and inventory-linked forecasting tools to manage seasonal spikes and supplier financing.
Manufacturing, healthcare, and IT services round out the top adopters, each driven by sector-specific pain points. Government uptake is emerging, illustrated by Debt Book’s 2024 launch of public-sector treasury software. As digital invoicing and real-time settlement spread, the cash management system market is expected to diversify further across industry verticals, diluting reliance on banking clients alone.
Geography Analysis
North America led with a 39.05% share of the cash management system market in 2025, underpinned by Fed ISO 20022 deadlines, fintech density, and a USD 1.76 trillion working-capital improvement gap. Large banks run programmable payment pilots that slash back-office workloads by up to 70%. The region also ranks highest in fraud losses, spurring demand for AI-driven risk modules.
Asia-Pacific is rising faster, clocking a 13.29% CAGR on the back of 7% annual investment banking growth and SME digitization that accounts for half of transaction banking revenue. Deep domestic e-commerce activity in China and India, coupled with cross-border corridors across ASEAN, requires multi-currency pooling and hedging. Global banks such as BNY Mellon have scaled APAC payment hubs processing USD 2.5 trillion daily.
Europe remains sizable due to MiFID II, EMIR, and pending Basel IV rules. Boards there emphasize ESG integration, with 64% of treasurers citing sustainability metrics as a strategic priority. Nordic corporates pioneer open-banking APIs, while UK firms prepare for the Bank of England’s renewed RTGS infrastructure. Emerging regions in the Middle East, Africa, and South America are poised to accelerate once digital ID and regulatory modernization catch up, enlarging the global cash management system market.

Competitive Landscape
Competition is moderate, with ERP giants including Oracle and SAP facing fintech-born challengers such as Kyriba, GTreasury, HighRadius, and Embat. Traditional vendors lean on deep compliance libraries and global support desks, while newcomers lead on UX design, AI speed, and fast API onboarding. FIS illustrated the consolidation trend by purchasing Demica and Dragonfly in 2024, then rolling out Treasury GPT in 2025 to automate support and insights.
Strategic alliances widen reach. Planixs paired with Finastra in February 2025 to embed real-time liquidity analytics into core banking suites[2]Planixs, “Finastra Partnership Announcement,” planixs.com. Tradeweb moved upstream by acquiring Institutional Cash Distributors for USD 785 million to tap corporate treasury investors. Investors see growth potential too: Palm secured USD 6.1 million in seed funding in February 2025, aiming at cash pooling for mid-caps.
Differentiation now centers on three pillars: AI-powered forecasting precision, breadth of pre-built bank connectors, and cloud performance. Vendors that deliver measurable working-capital gains, secure workflows, and quick deployment are capturing share, especially in the cloud-first SME tier of the cash management system market.
Cash Management System Industry Leaders
Infosys Limited
Oracle Corporation
Giesecke & Devrient GmbH
The Sage Group PLC (Intacct Corporation)
Glory Ltd. (Glory Global Solutions, Inc.)
- *Disclaimer: Major Players sorted in no particular order

Recent Industry Developments
- March 2025: FIS launched Treasury GPT, the first large language model tailored to treasury workflows and winner of a 2025 TMI innovation award.
- February 2025: Corpay agreed to acquire GPS, expanding cross-border payment capability in 145 currencies.
- February 2025: Palm raised USD 6.1 million to refine its cash-flow optimization platform.
- February 2025: Planixs partnered with Finastra to deliver real-time liquidity analytics for banks.


Research Methodology Framework and Report Scope
Market Definitions and Key Coverage
Our study defines the cash management system market as packaged or cloud-native software platforms, together with mandatory implementation and support services, that help corporates and financial institutions forecast liquidity, reconcile positions, automate payables and receivables, and connect to bank networks in real time. According to Mordor Intelligence, hardware such as cash recyclers, smart safes, and CIT services is not part of this scope, nor are pure cash-logistics contracts that do not include a treasury software layer.
Scope Exclusion: physical cash-handling hardware and stand-alone cash-in-transit services are left outside the market boundary.
Segmentation Overview
- By Component
- Solution
- Services
- By Organization Size
- Large Enterprises
- Small and Medium Enterprises (SMEs)
- By Deployment Mode
- On-premise
- Cloud
- By Operation Type
- Cash-flow Forecasting
- Corporate Liquidity Management
- Payables Automation
- Receivables Automation
- Treasury and Risk Compliance
- By End-user Industry
- Banking, Financial Services and Insurance (BFSI)
- IT and Telecom
- Healthcare
- Government and Public Sector
- Retail and E-commerce
- Manufacturing
- Automotive
- Construction
- Packaging
- By Geography
- North America
- United States
- Canada
- Mexico
- South America
- Brazil
- Argentina
- Rest of South America
- Europe
- United Kingdom
- Germany
- France
- Italy
- Spain
- Nordics
- Rest of Europe
- Middle East and Africa
- Middle East
- Saudi Arabia
- United Arab Emirates
- Turkey
- Rest of Middle East
- Africa
- South Africa
- Egypt
- Nigeria
- Rest of Africa
- Middle East
- Asia-Pacific
- China
- India
- Japan
- South Korea
- ASEAN
- Australia
- New Zealand
- Rest of Asia-Pacific
- North America
Detailed Research Methodology and Data Validation
Primary Research
Mordor analysts interviewed corporate treasurers, bank connectivity leads, regional payment-rail operators, and treasury-software integrators across North America, Europe, and Asia-Pacific. Conversations tested adoption hurdles, average selling prices, and rollout timelines, allowing us to validate desk-research assumptions and close information gaps before final triangulation.
Desk Research
We began by mapping the universe of liquidity-automation vendors through public filings, FDIC call-report data, BIS and ECB payment statistics, SWIFT MT-message dashboards, and trade association releases such as AFP's annual Treasury Benchmarking Survey. Additional context came from World Bank enterprise-survey microdata, Federal Reserve FAST payment adoption updates, and press articles captured via Dow Jones Factiva. Company financials were verified on D&B Hoovers, while patent density around AI-driven forecasting was checked on Questel. These sources illustrate, but do not exhaust, the secondary evidence consulted throughout the project.
Market-Sizing and Forecasting
A top-down model reconstructs global demand from bank connectivity volumes and the penetration rate of treasury platforms within addressable enterprises; results are corroborated with sampled bottom-up checks of vendor revenue disclosures and channel ASP times deployment counts. Core variables include live ISO 20022 transaction growth, corporate real-time payment share, average multi-bank connectivity fees, SaaS conversion ratios among mid-market firms, and regional compliance triggers such as Basel IV liquidity tests. Forecasts employ a multivariate regression blended with ARIMA smoothing, using macro (GDP, e-commerce sales) and micro (payment-rail launches, vendor deal flow) inputs vetted by our primary experts. Gaps in bottom-up data are adjusted through regional variance factors anchored to audited bank-fee schedules.
Data Validation and Update Cycle
Outputs pass a two-step analyst review: variance checks against independent liquidity-risk indicators, then anomaly resolution before sign-off. Reports refresh each year, with mid-cycle updates triggered by material events, such as major regulatory go-lives or double-digit vendor price shifts, ensuring clients receive our most current view.
Why Mordor's Cash Management System Baseline Earns Trust
Published estimates often differ because firms apply dissimilar scope lines, price-mix assumptions, and refresh cadences.
Key gap drivers include whether services revenue is bundled, if conservative on-premise prices or higher cloud ASPs are applied, and how quickly each publisher feeds new ISO 20022 volumes into its model. Mordor uses a consistent software-plus-services scope, rolls forward exchange rates quarterly, and re-tests variables with market practitioners before release.
Benchmark comparison
| Market Size | Anonymized source | Primary gap driver |
|---|---|---|
| USD 20.35 B (2025) | Mordor Intelligence | - |
| USD 17.56 B (2024) | Global Consultancy A | Excludes implementation fees; older base year; limited cloud-ASP uplift |
| USD 14.20 B (2024) | Industry Journal B | Counts only software licenses; omits SME SaaS adoption; annual refresh every two years |
The comparison shows that, by selecting the full software-plus-services scope and by updating inputs annually, Mordor provides a balanced, transparent baseline that decision-makers can trace back to clear variables and repeatable steps.


Key Questions Answered in the Report
What is the current size of the cash management system market?
The market stands at USD 21.78 billion in 2026 and is expected to reach USD 30.56 billion by 2031, reflecting a 7.01% CAGR.
Which segment is growing fastest within the cash management system market?
AI-driven cash-flow forecasting is the fastest, posting a 18.95% CAGR due to demand for accurate liquidity prediction.
Why are SMEs adopting treasury platforms now?
Cloud SaaS pricing, pre-built templates, and regulatory parity allow SMEs to deploy sophisticated cash tools with limited IT resources, driving a 16.02% CAGR.
How big is the working-capital improvement potential?
US corporations hold USD 1.76 trillion of trapped cash, which treasury solutions aim to unlock through automation and analytics.
What role does ISO 20022 play in market growth?
Global adoption of ISO 20022 real-time payment messaging compels firms to upgrade systems, adding +1.8 percentage points to forecast CAGR.
Which region shows the highest growth?
Asia-Pacific leads with a 13.29% CAGR, propelled by SME digitization and expanding cross-border payments infrastructure.
Page last updated on:


