
Technology, Media and Telecom
5th MayPricing Strategy for Semiconductor Components
3 Min Read
Marketing Resource Management Market is Segmented by Type (Solutions, Services), Deployment (Cloud, On-Premises), Enterprise Size (Small and Medium Enterprises, Large Enterprises), End-User Industry (BFSI, IT and Telecom, Consumer Goods and Retail, Travel and Hospitality, Media and Entertainment, Healthcare and Life Sciences, Other Industries), and by Geography. The Market Forecasts are Provided in Terms of Value (USD).
Market Overview
| Study Period | 2020 - 2031 |
|---|---|
| Market Size (2026) | USD 5.96 Billion |
| Market Size (2031) | USD 11.51 Billion |
| Growth Rate (2026 - 2031) | 14.05 % CAGR |
| Fastest Growing Market | Asia Pacific |
| Largest Market | North America |
| Market Concentration | Medium |
Major Players *Disclaimer: Major Players sorted in no particular order. Image © Mordor Intelligence. Reuse requires attribution under CC BY 4.0. |
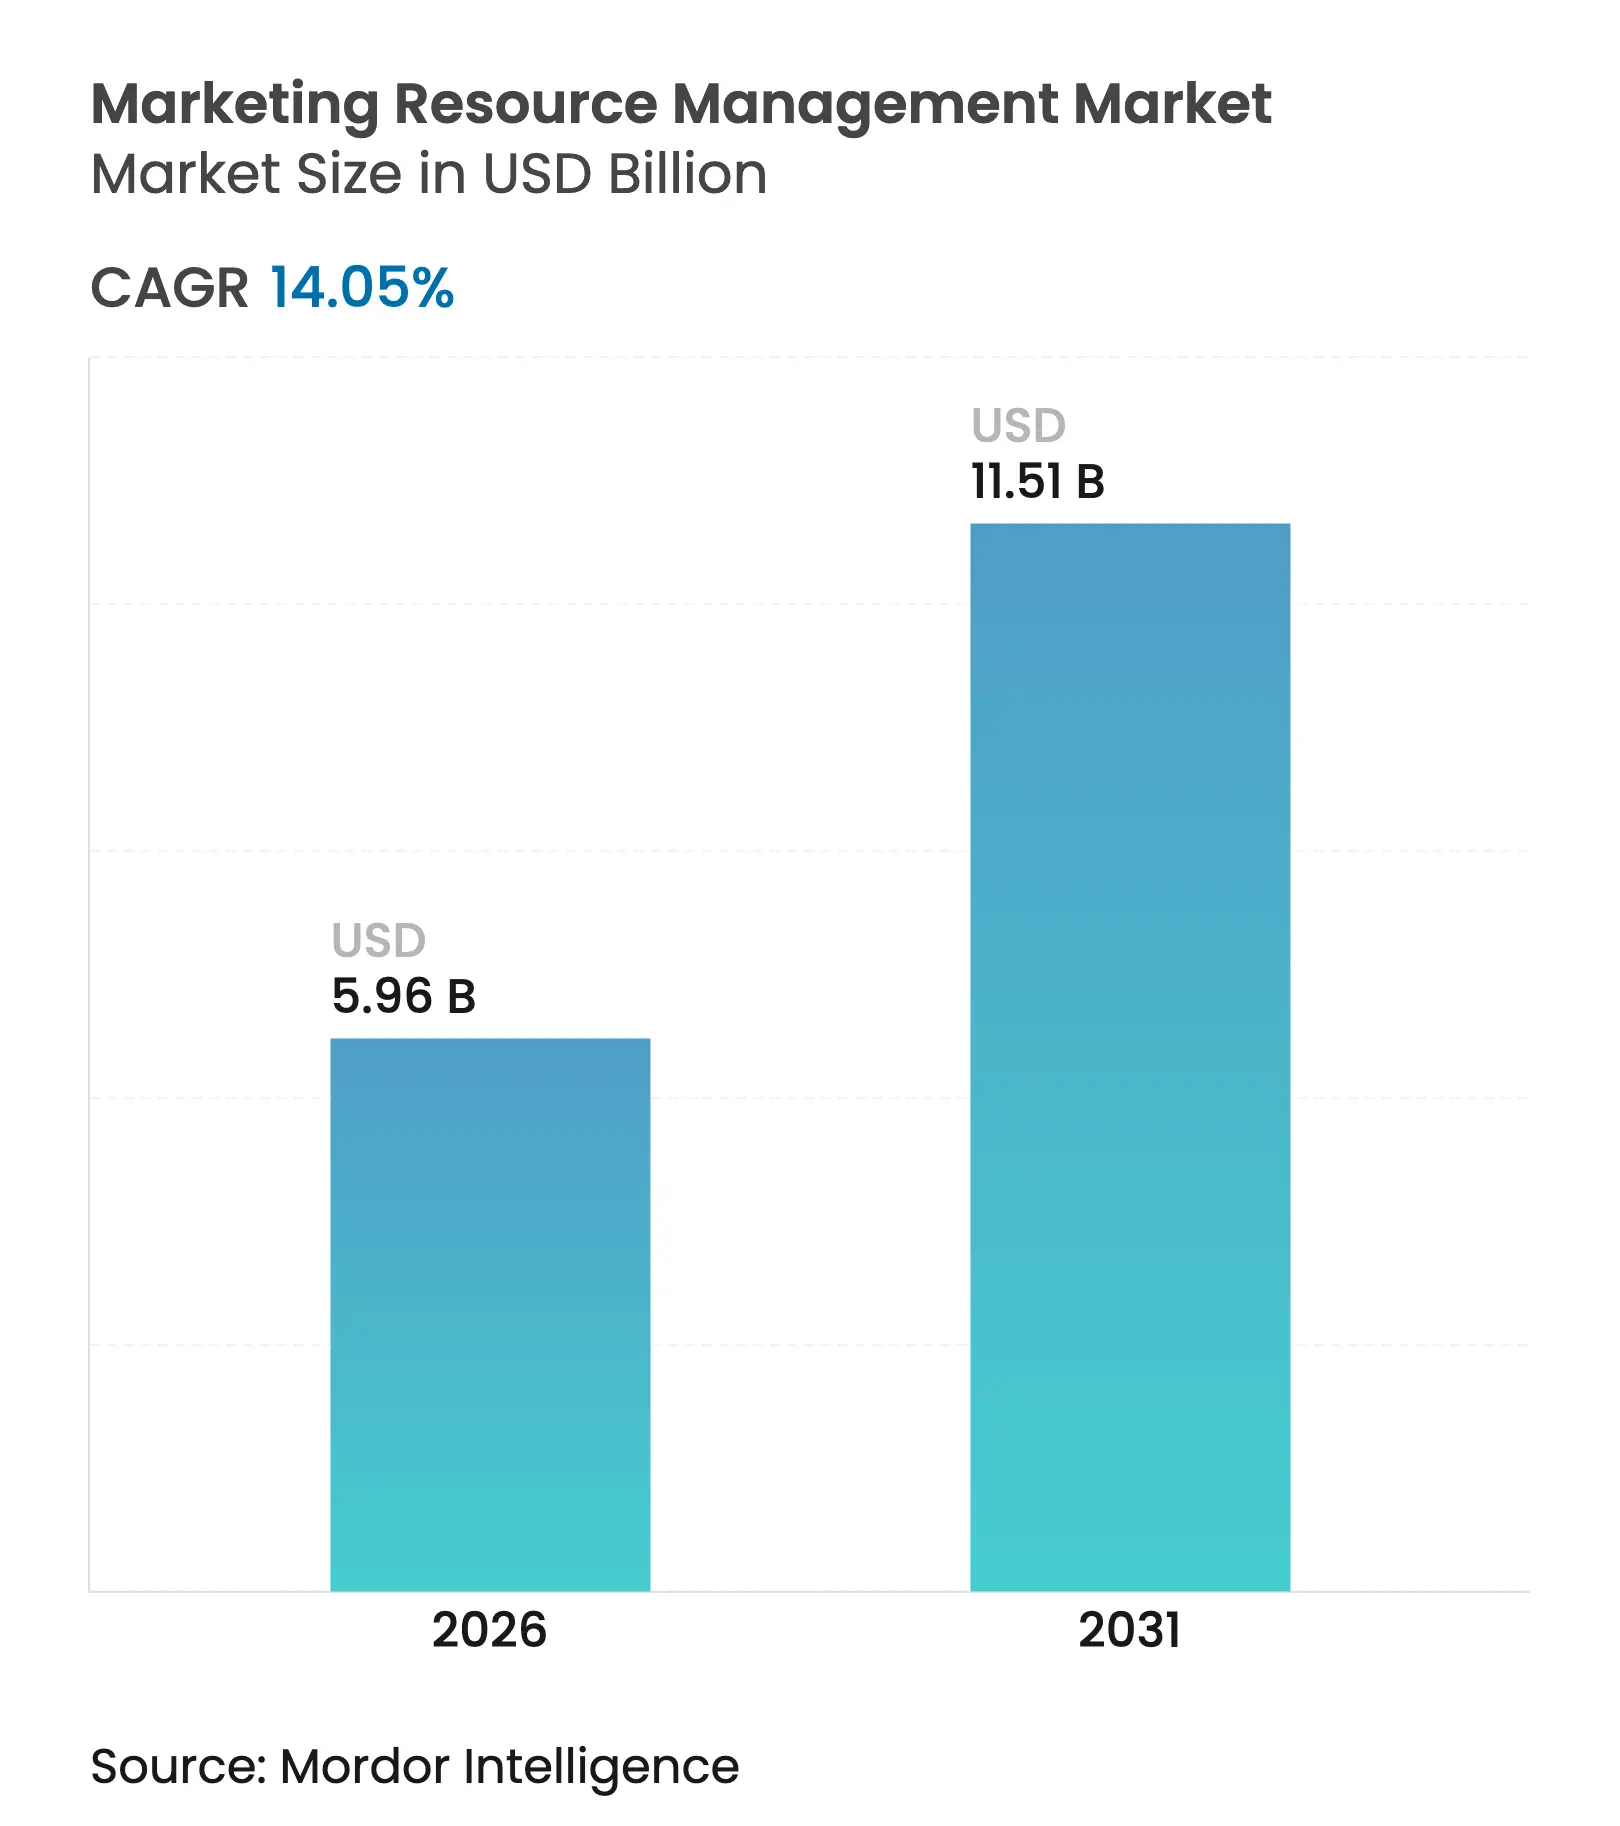
The marketing resource management market size in 2026 is estimated at USD 5.96 billion, growing from 2025 value of USD 5.23 billion with 2031 projections showing USD 11.51 billion, growing at 14.05% CAGR over 2026-2031. Real-time orchestration of people, budgets, and digital assets is now a board-level priority as enterprises migrate from fragmented toolsets to unified, API-first platforms. Cloud infrastructure, artificial intelligence, and composable architecture are converging to ensure that every campaign dollar is traceable, compliant, and optimized for outcome. Vendors able to embed predictive analytics, low-code workflow design, and built-in privacy controls are capturing disproportionate demand as marketing teams balance growth goals with tightening data-protection rules. In parallel, industry consolidation is concentrating intellectual property in a handful of platform providers even as specialist entrants thrive in compliance-heavy niches.
Key Report Takeaways
Note: Market size and forecast figures in this report are generated using Mordor Intelligence's proprietary estimation framework, updated with the latest available data and insights as of 2026.
Drivers Impact Analysis
| Driver | % Impact on CAGR Forecast | Geographic Relevance | Impact Timeline | |||
|---|---|---|---|---|---|---|
Need for brand consistency and
regulatory compliance
Need for brand consistency and
regulatory compliance
| +2.8% | Global, with emphasis on North America and EU | Medium term (2-4 years) |
% Impact on CAGR Forecast
:
+2.8%
|
Geographic Relevance
:
Global, with emphasis on North
America and EU
|
Impact Timeline
:
Medium term (2-4 years)
|
Rising digital-content volume
and marketing complexity
Rising digital-content volume
and marketing complexity
| +3.2% | Global, particularly APAC and North America | Short term (≤ 2 years) | |||
Rapid shift to cloud-based MRM
deployments
Rapid shift to cloud-based MRM
deployments
| +2.5% | Global, led by North America, expanding to APAC | Medium term (2-4 years) | |||
AI-driven predictive resource
allocation
AI-driven predictive resource
allocation
| +3.8% | North America and EU initially, scaling to APAC | Long term (≥ 4 years) | |||
Composable martech stacks
accelerating API-first MRM
Composable martech stacks
accelerating API-first MRM
| +1.9% | North America and EU, emerging in APAC | Long term (≥ 4 years) | |||
ESG pressure to measure
marketing carbon footprint
ESG pressure to measure
marketing carbon footprint
| +1.2% | EU and North America, expanding globally | Long term (≥ 4 years) | |||
| Source: Mordor Intelligence | ||||||
AI-driven predictive resource allocation
Artificial intelligence is shifting the marketing resource management market toward autonomous decision loops that balance budget, creative assets, and channel mix in real time. Adobe’s Experience Platform Agent Orchestrator automates audience segmentation and content assembly, enabling large brands to deploy thousands of personalized creatives daily.[1]Adobe Inc., “Adobe Experience Platform Agent Orchestrator Launches,” adobe.com Microsoft infused generative AI into Dynamics 365 Customer Insights, giving marketers conversational tools to refine segments and predict campaign lift. Early adopters report higher conversion rates once AI handles repetitive optimization tasks. Yet benefits accrue only when data foundations are clean and human governance remains in place.
Rising digital-content volume and marketing complexity
Two-thirds of marketers expect content demand to grow fivefold by 2026, forcing teams to replace disconnected asset libraries with orchestrated content supply chains. Adobe GenStudio unites ideation, production, and distribution on a single workspace, while Aprimo’s AI-assisted digital asset management tags assets for quick repurposing, reducing search time by double-digit percentages. Low-code workflow builders let non-technical staff adapt processes without IT tickets, accelerating campaign velocity but raising integration challenges for legacy systems.
Rapid shift to cloud-based MRM deployments
Oracle generated USD 5.6 billion in cloud services revenue in its latest quarter, up 21%, as customers retire on-premise software in favor of elastic infrastructure where AI models can scale efficiently. SAP’s cloud portfolio grew 25% year-over-year to EUR 17.14 billion, highlighting enterprise appetite for SaaS marketing suites that plug into core ERP data.[2]SAP SE, “FY 2024 Results,” sap.com Cloud uptake is particularly strong in Asia-Pacific, where 79% of firms boosted digital-transformation budgets to improve customer engagement. Always-on connectivity enables distributed teams to collaborate on campaigns while enforcing consistent governance.
Need for brand consistency and regulatory compliance
Regulators are tightening rules on endorsements, data usage, and sustainability claims. The U.S. Federal Trade Commission’s 2024 directive bans deceptive consumer reviews and imposes USD 51,744 fines per violation, prompting brands to embed automated compliance checkpoints in creative workflows.[3]Federal Trade Commission, “FTC Issues Final Rule on Consumer Reviews,” ftc.gov China’s revised Advertising Law restricts influencer marketing and false claims, compelling multinationals to adopt localization controls that validate creative against jurisdiction-specific guidance. Platforms with native audit trails and policy engines are becoming mandatory for cross-border campaigns.
Restraints Impact Analysis
| Restraint | % Impact on CAGR Forecast | Geographic Relevance | Impact Timeline | |||
|---|---|---|---|---|---|---|
High implementation and
integration costs
High implementation and
integration costs
| -2.1% | Global, particularly affecting SMEs | Short term (≤ 2 years) |
% Impact on CAGR Forecast
:
-2.1%
|
Geographic Relevance
:
Global, particularly affecting
SMEs
|
Impact Timeline
:
Short term (≤ 2 years)
|
Data-security and privacy
concerns
Data-security and privacy
concerns
| -1.8% | Global, with emphasis on EU and North America | Medium term (2-4 years) | |||
Legacy-system interoperability
gaps
Legacy-system interoperability
gaps
| -1.5% | North America and EU, expanding to APAC | Medium term (2-4 years) | |||
Shrinking CMO tech budgets
Shrinking CMO tech budgets
| -1.3% | Global, particularly in mature markets | Short term (≤ 2 years) | |||
| Source: Mordor Intelligence | ||||||
High implementation and integration costs
Comprehensive platforms can require contract values exceeding USD 50,000 per year, plus five-figure integration fees when connecting to existing CRM or ERP systems. For price-sensitive firms, vendors such as Proof Analytics now sell modular packages starting at USD 495 per month that address a single pain point, postponing full-suite adoption until ROI is proven.
Data-security and privacy concerns
Japan’s updated Act on the Protection of Personal Information mandates explicit consent and rapid breach notifications, raising the bar for martech providers handling cross-border data. Healthcare marketers must comply with HIPAA, prohibiting the use of patient data in campaigns without consent. Vendors are embedding privacy-by-design practices—tokenization, consent vaults, and region-specific data residency—to reassure risk-averse buyers, though implementation adds cost and time.
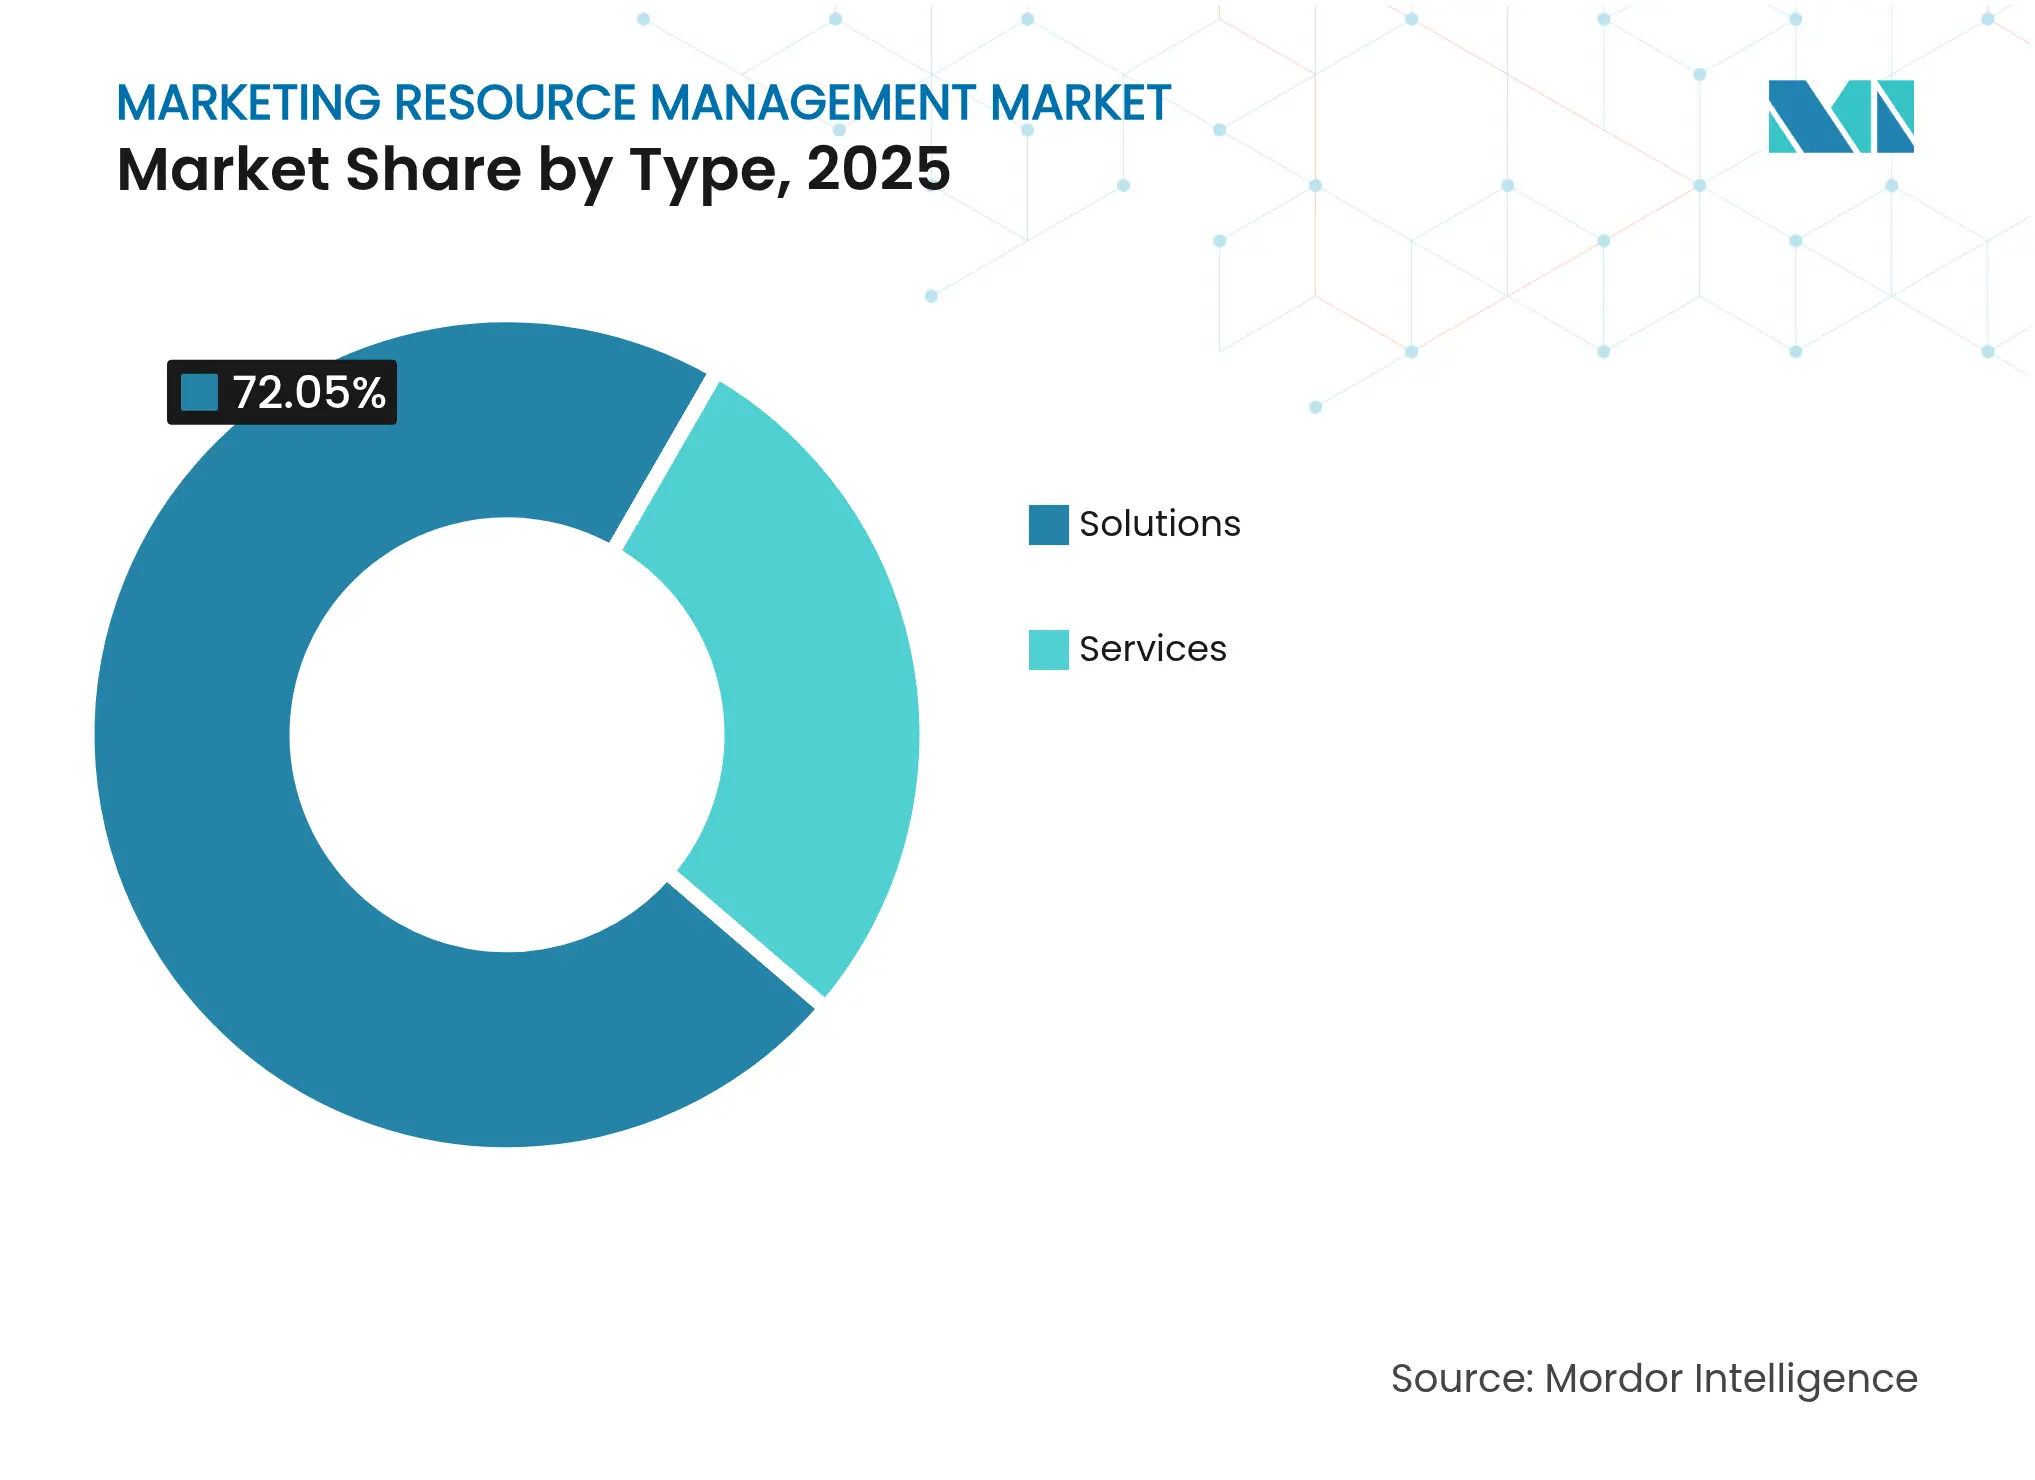
By Type: Solutions dominate while service expertise accelerates
Solutions accounted for 72.05% of the marketing resource management market in 2025 as enterprises sought consolidated platforms that unify budgeting, calendaring, and asset management. IBM cut page deployment time by 75% after collapsing 40 asset libraries into one platform, illustrating the hard cost savings realized when duplication is eliminated. The services segment, though smaller, is racing ahead at a 15.65% CAGR because organizations need guidance to configure artificial-intelligence modules and re-engineer workflows. Infosys and Adobe’s Aster solution delivered a 40% boost in digital engagement for a telecom client, underscoring how expert services unlock full platform value. Demand for outcome-based consulting will intensify as AI adoption deepens and as firms struggle to balance automation with human oversight.
Note: Segment shares of all individual segments available upon report purchase
By Deployment: Cloud transformation accelerates
Cloud systems represented 66.10% of the marketing resource management market size in 2025 and will remain the dominant choice as buyers seek elastic computing for AI workloads and ubiquitous access for distributed teams. Microsoft’s cloud revenue grew 20% year-over-year to USD 42.4 billion, buoyed by the adoption of Copilot-enabled Dynamics modules that let marketers brainstorm creatives with natural language. On-premise installations persist in heavily regulated sectors, yet even financial services firms are piloting hybrid models that keep PII on-site while streaming anonymized data to SaaS analytics engines. Government digital-first mandates across Asia-Pacific will continue lifting cloud penetration above the global average.
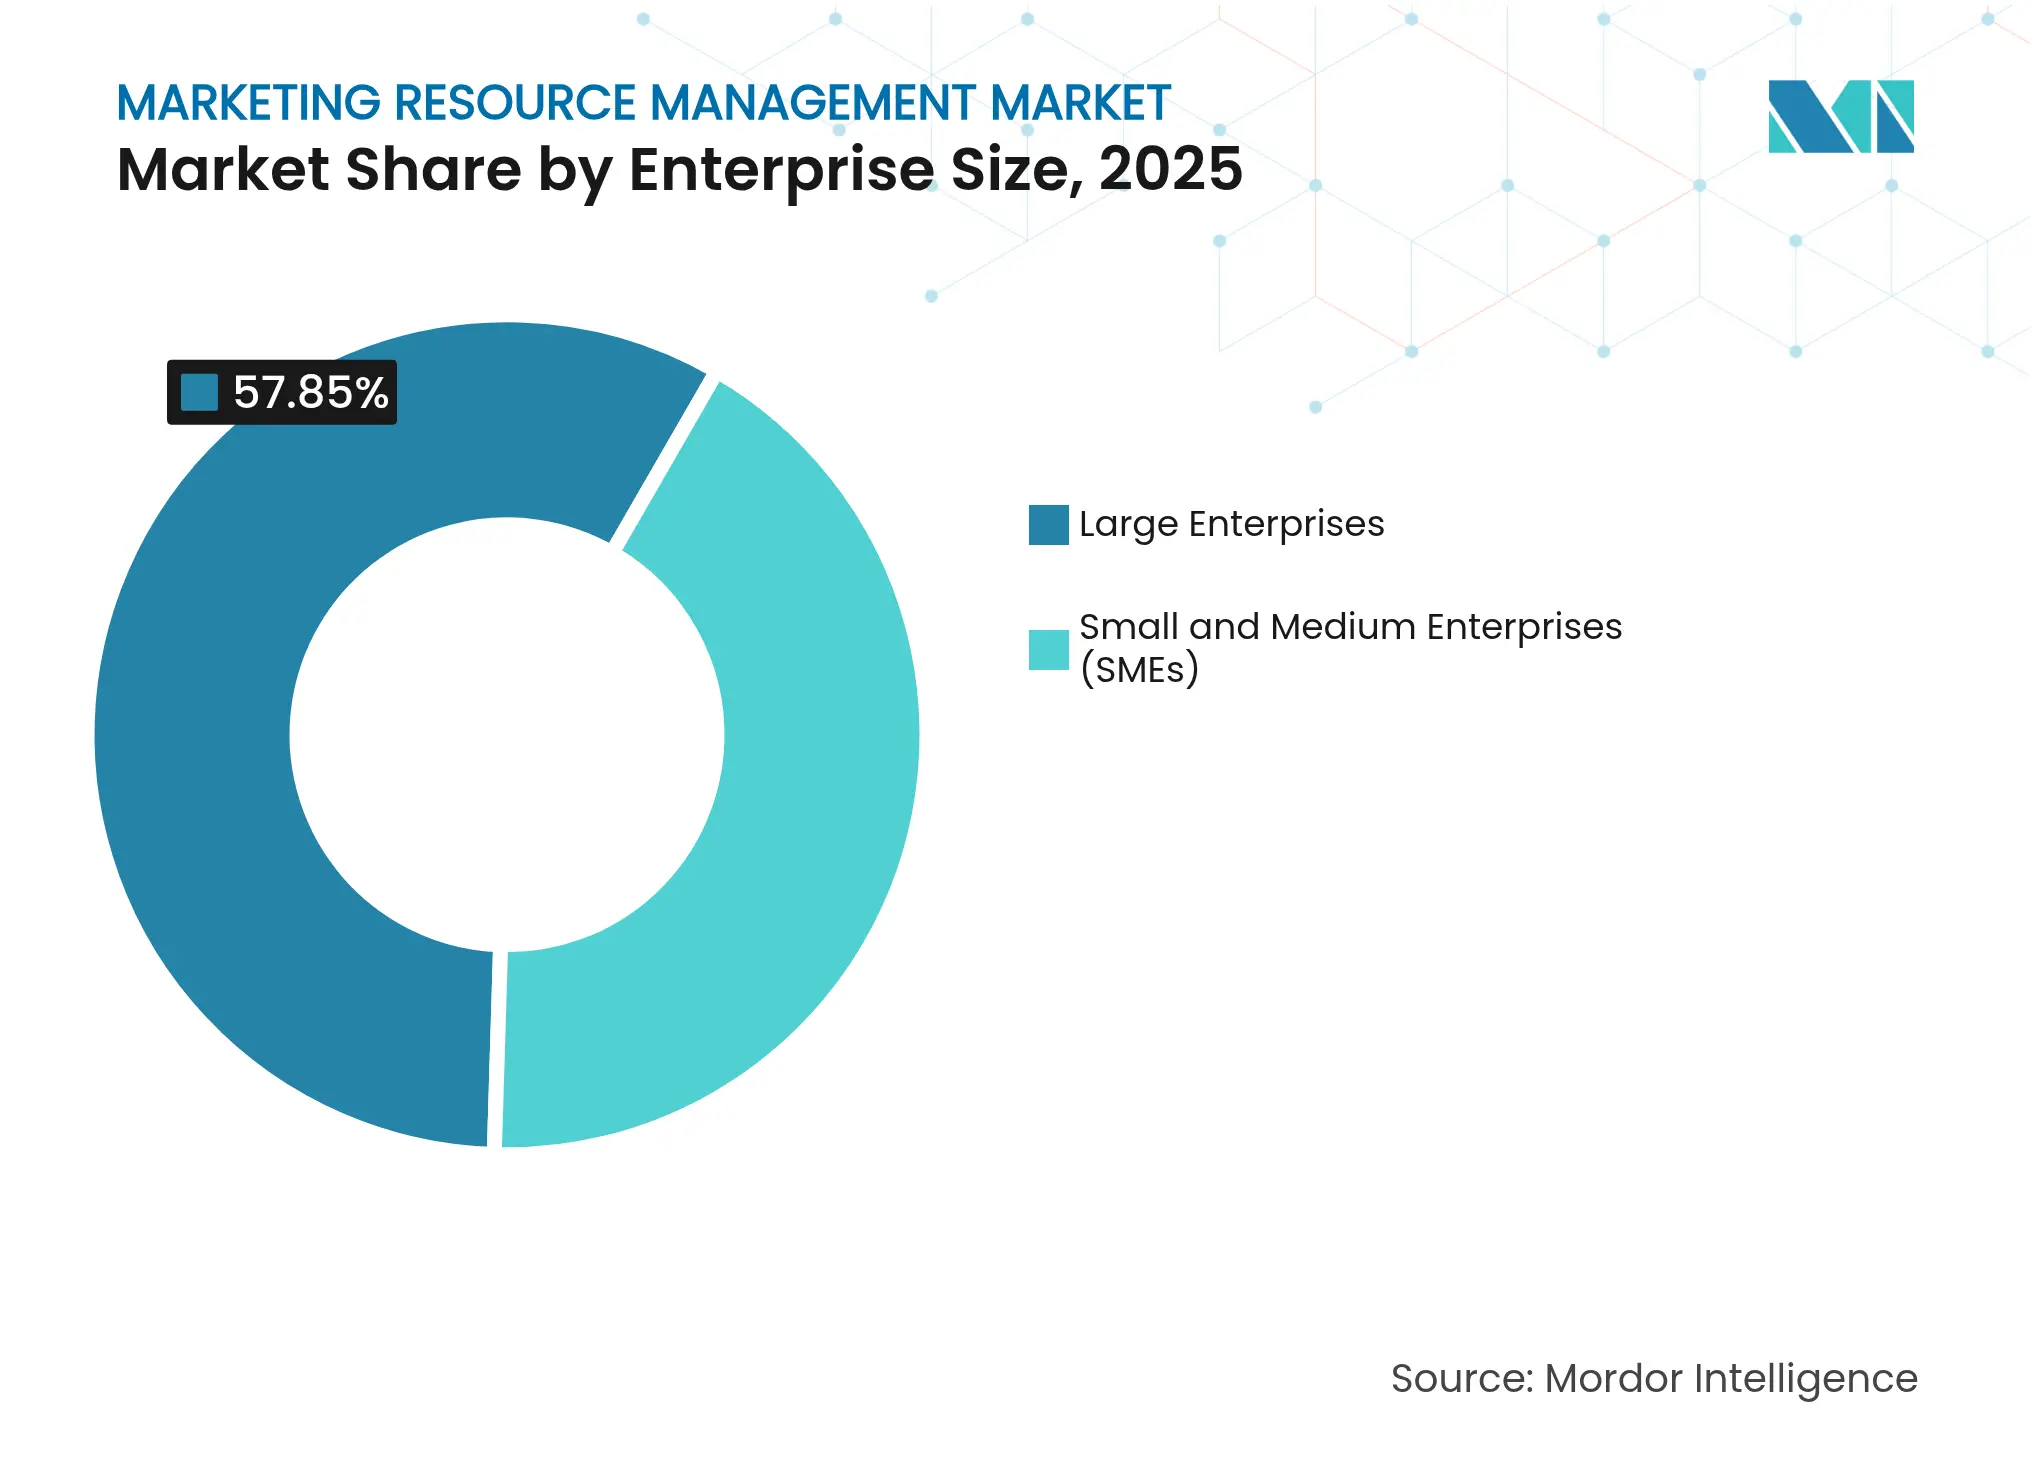
By Enterprise Size: SME adoption accelerates
Large enterprises held 57.85% revenue share in 2025, but the 16.62% CAGR logged by SMEs signals democratization of advanced tooling. Subscription pricing, pre-built connectors, and no-code customization allow smaller firms to onboard sophisticated workflows without internal IT. Thryv’s USD 80 million purchase of Keap aims to create an affordable, end-to-end suite for the under-served small-business segment. As AI assistants become embedded in everyday interfaces, the gap in marketing sophistication between large and small organizations is narrowing quickly, fueling fresh entrants focused exclusively on SMB pain points.
Note: Segment shares of all individual segments available upon report purchase
By End-user Industry: Healthcare compliance drives growth
Financial services captured 27.60% of 2025 spend due to stringent disclosure and record-keeping requirements. Yet healthcare’s 18.35% CAGR through 2031 makes it the fastest riser. HIPAA constraints force hospitals and life-science firms to adopt platforms that quarantine protected health information while still enabling personalized outreach. Pharmaceutical marketers partnering with Aprimo and SecureCHEK AI can now validate every asset against medical-legal-regulatory guidelines before release, shrinking review cycles and cutting compliance risk.
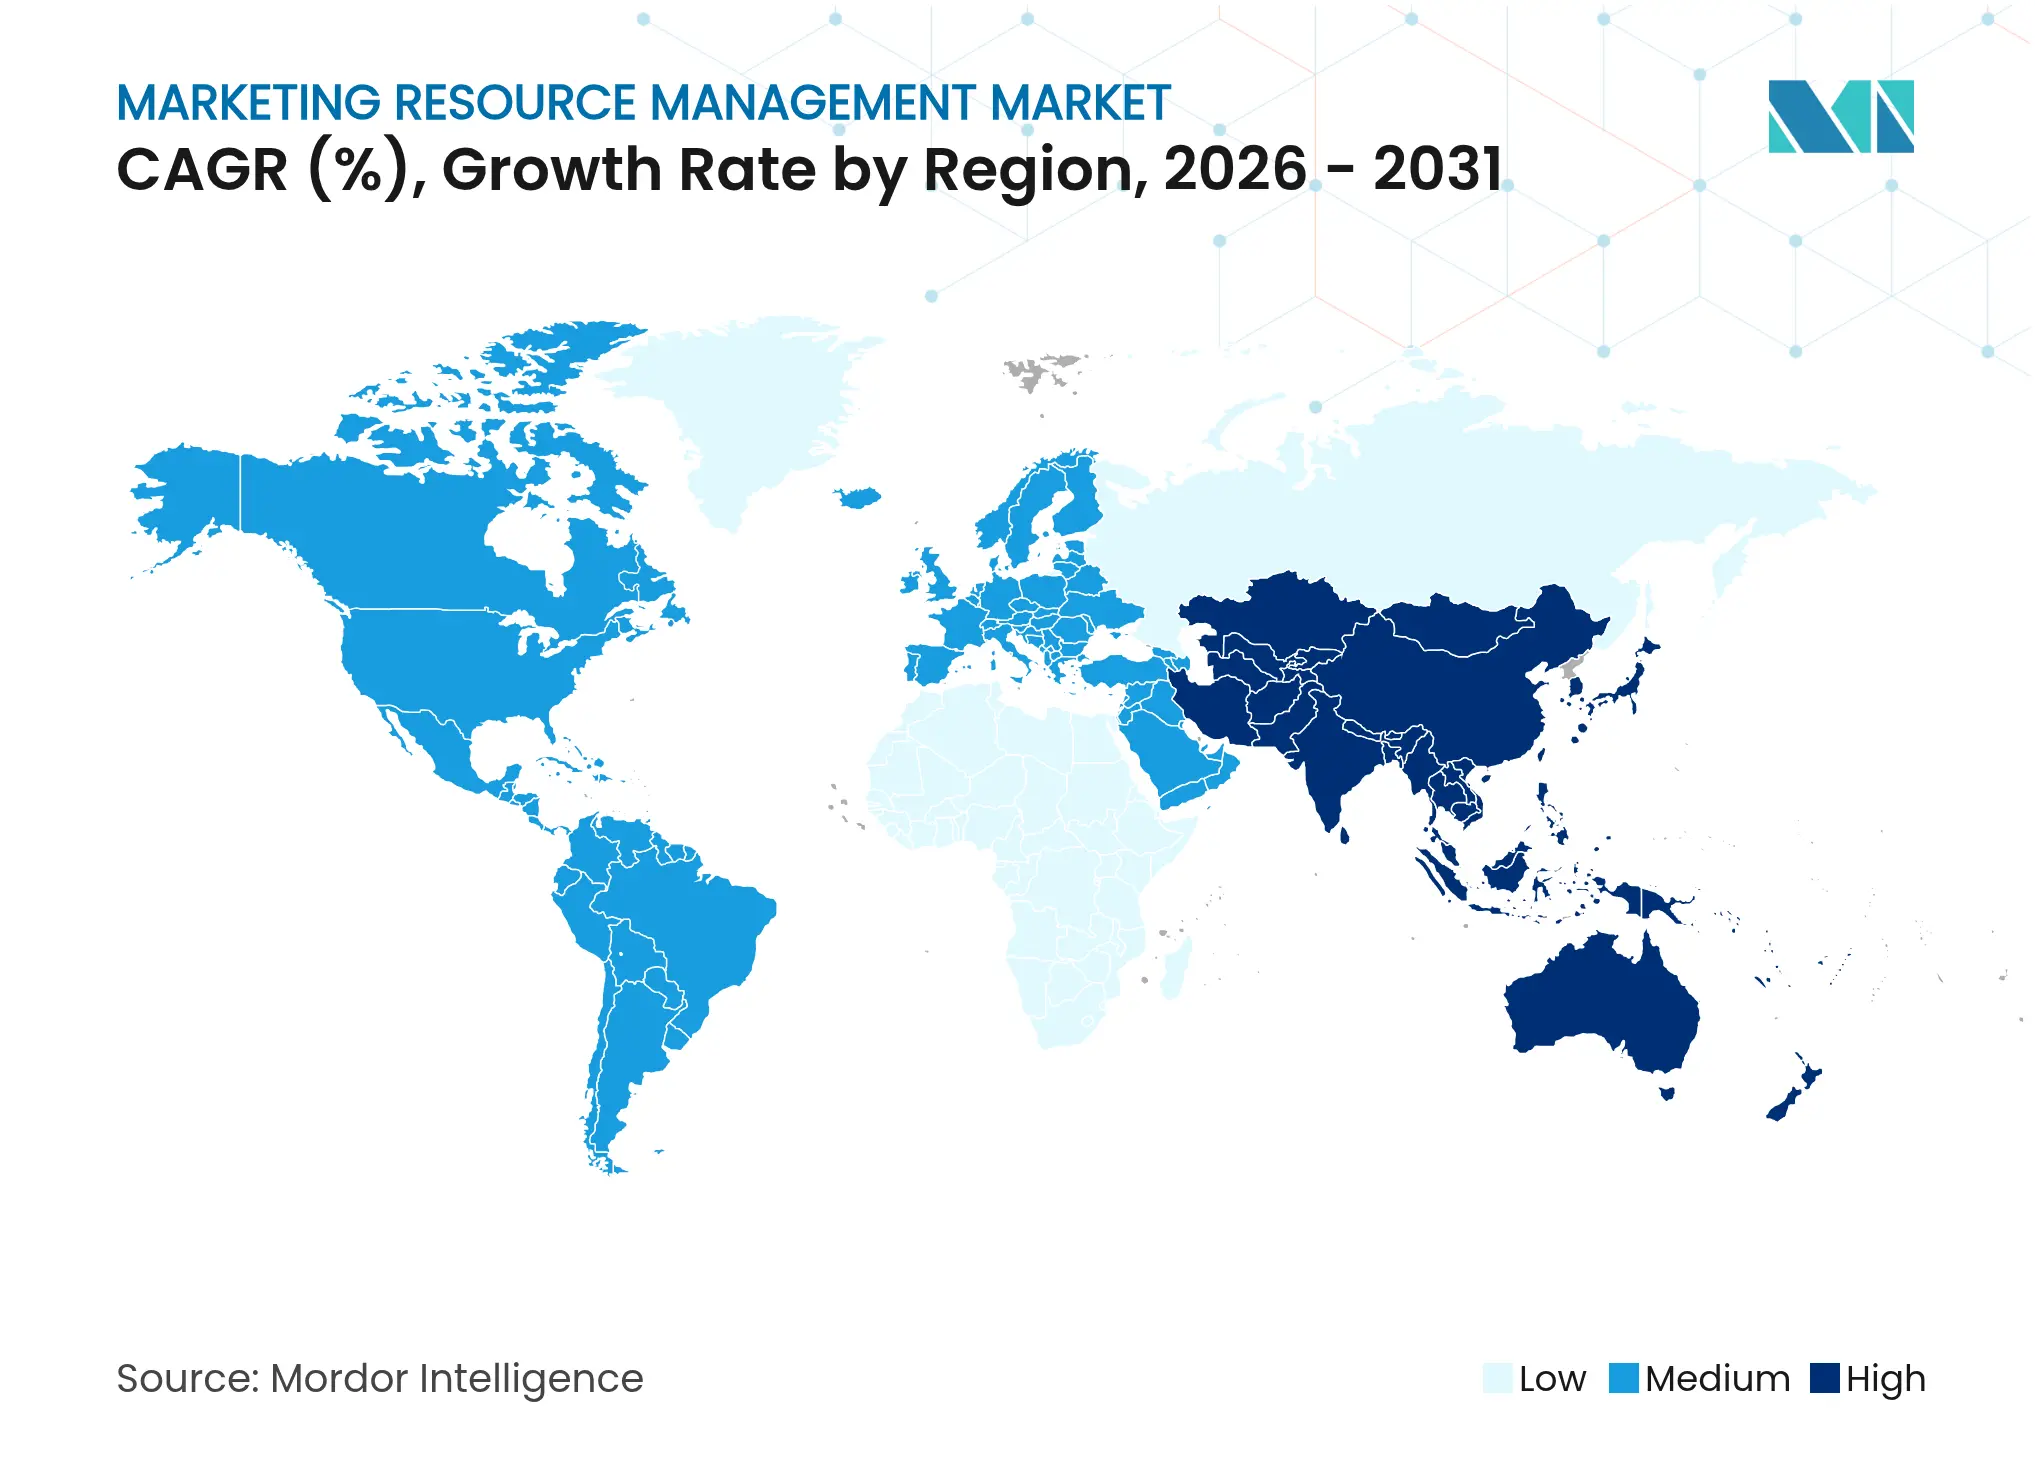
North America generated 44.30% of global revenue in 2025. Enforcement of new FTC rules on consumer endorsements has pushed even mid-market brands to adopt automated disclosure checks. U.S. banks paid USD 3.65 billion in marketing-related penalties in 2024, five times higher than the prior year, reinforcing the business case for embedded compliance engines.
Asia-Pacific is the fastest-growing region at a 19.55% CAGR. China’s stricter Advertising Law curbs celebrity endorsements and false claims, driving demand for rule-based creative approvals. India’s focus on eliminating “dark patterns” in digital ads further accelerates platform uptake. Eight in ten APAC companies increased digital-engagement budgets, with cloud infrastructure the preferred backbone for multichannel execution.
Europe maintains momentum as GDPR enforcement intensifies and the region expands eco-labeling disclosure rules. Vendors providing carbon-footprint calculators inside their resource-planning modules are seeing faster deal cycles. Elsewhere, Latin America and the Middle East and Africa remain nascent but attractive, especially where telecom modernization funds are allocated to omnichannel marketing initiatives.
Market Concentration
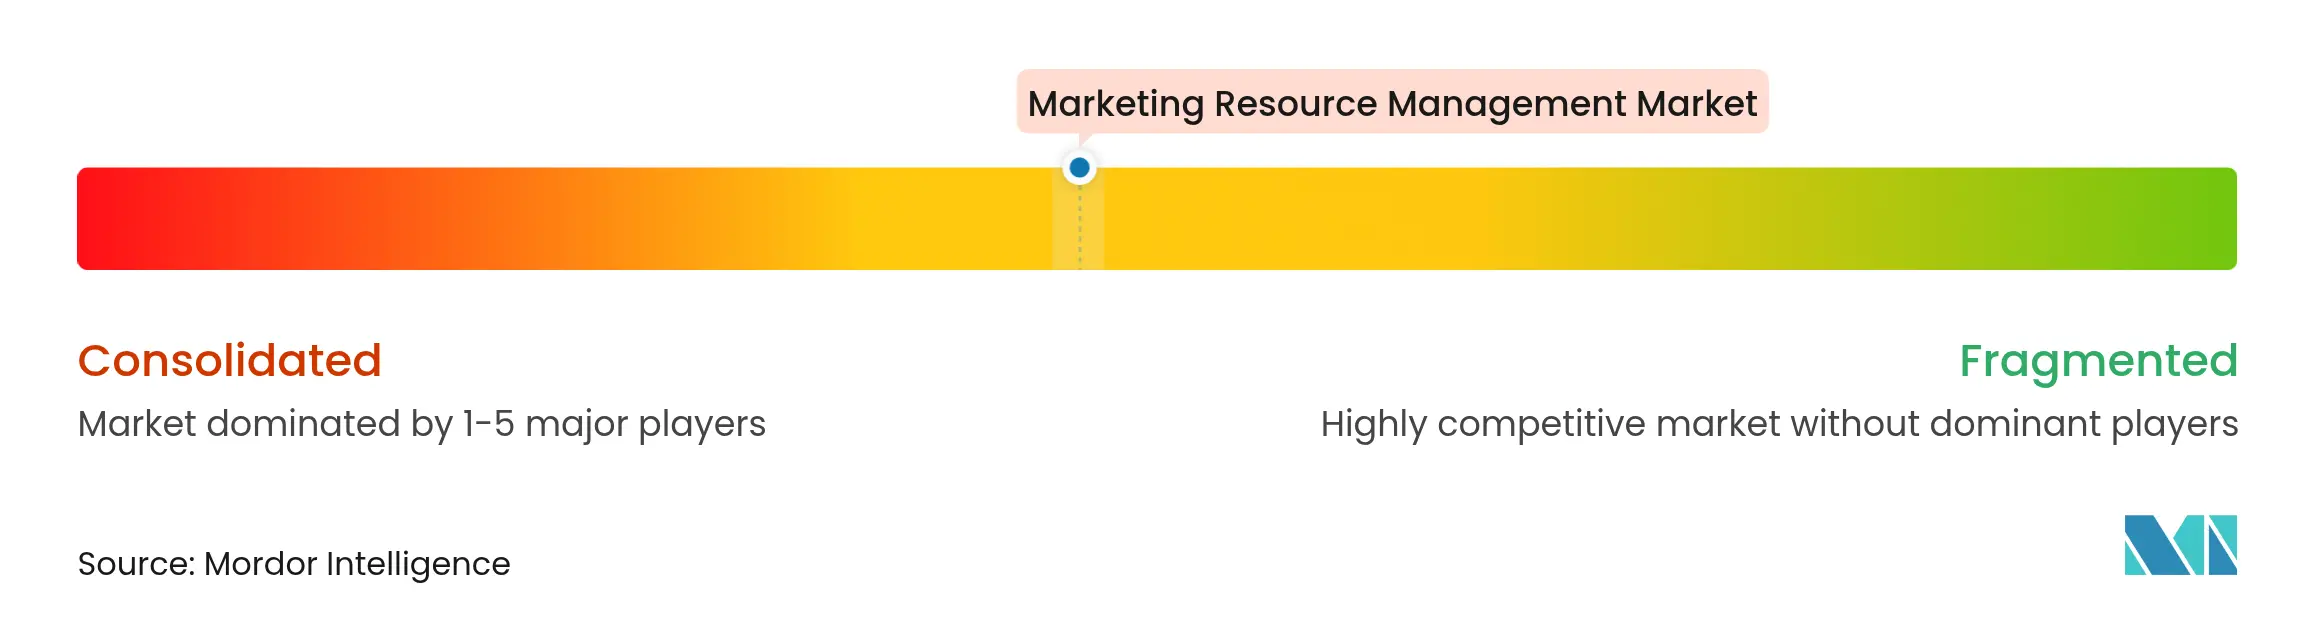
The marketing resource management market shows moderate concentration. Adobe, Oracle, SAP, Salesforce, and Microsoft collectively control a sizeable portion of global spend, differentiating through integrated AI and extensible ecosystems. Adobe reported Q2 2025 revenue of USD 5.87 billion, supported by double-digit growth in Experience Cloud subscriptions. Oracle, meanwhile, leverages its database heritage to position Fusion Marketing as the control center for end-to-end demand generation.
Consolidation continues: Salesforce acquired Informatica for USD 8 billion to integrate enterprise-grade data management into its Agentforce platform, while Omnicom’s USD 30 billion purchase of IPG created the world’s largest communications group. Partnerships are equally strategic. IBM and Adobe expanded a two-decade collaboration to build AI-powered content supply chains, combining IBM’s watsonx with Adobe Firefly models for enterprise-safe generative content. Niche vendors are thriving by specializing in regulated verticals, regional compliance, and no-code configurability, ensuring healthy competitive tension despite headline mergers.

*Disclaimer: Major Players sorted in no particular order
1. INTRODUCTION
2. RESEARCH METHODOLOGY
3. EXECUTIVE SUMMARY
4. MARKET LANDSCAPE
5. MARKET SIZE AND GROWTH FORECASTS (VALUE)
6. COMPETITIVE LANDSCAPE
7. MARKET OPPORTUNITIES AND FUTURE OUTLOOK
Marketing resource management (MRM) is an approach to marketing management that focuses on the marketing team's entire pool of resources, from marketing team staff to the marketing budget. It also includes the management of external vendors, production processes, and even digital asset management.
The marketing resource management market is segmented by type (solution, services), by deployment (cloud, on-premises), by enterprise size (SMEs, large enterprises), by end-user (BFSI, IT and telecom, travel and hospitality, media and entertainment, healthcare, other end-users), by geography (North America, Europe, Asia-Pacific, Latin America, Middle East and Africa). The market sizes and forecasts are provided in terms of value (USD) for all the above segments.
Pricing Strategy for Semiconductor Components
3 Min Read
Accelerating Additive Manufacturing Adoption in India
3 Min Read
When decisions matter, industry leaders turn to our analysts. Let’s talk.