Shopping Application Market Size and Share
Market Overview
| Study Period | 2020 - 2031 |
|---|---|
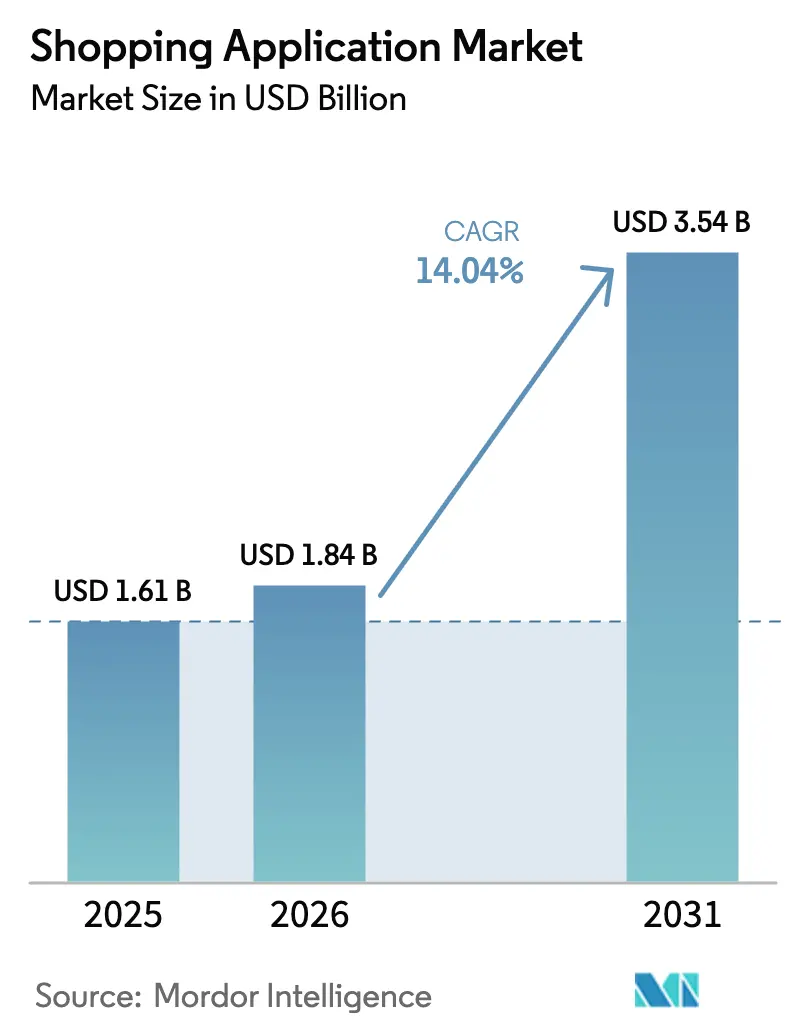
| Market Size (2026) | USD 1.84 Billion |
| Market Size (2031) | USD 3.54 Billion |
| Growth Rate (2026 - 2031) | 14.04% CAGR |
| Fastest Growing Market | Asia Pacific |
| Largest Market | North America |
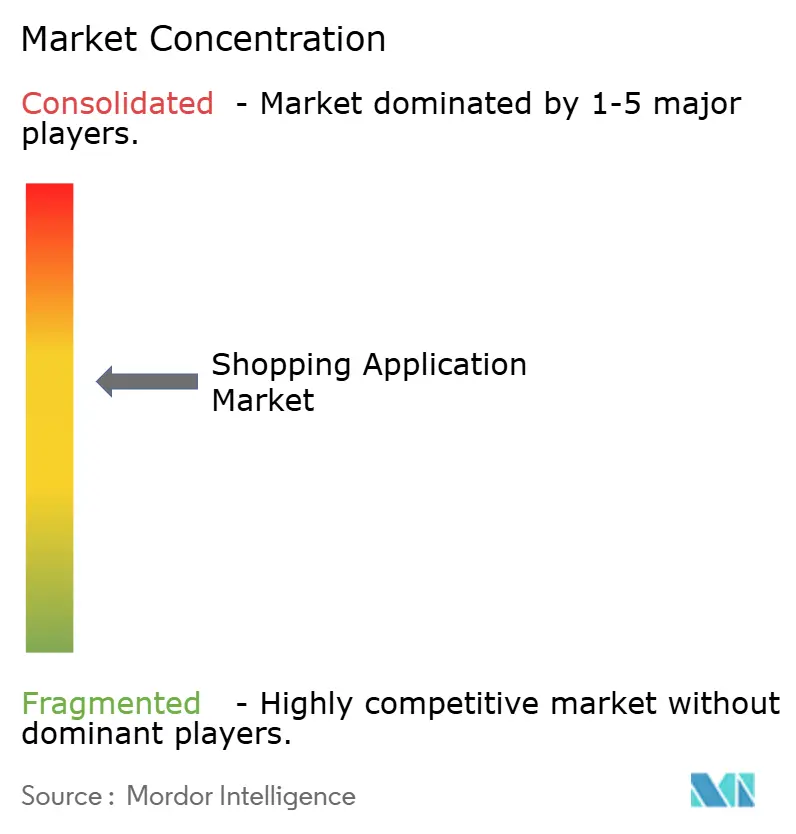
| Market Concentration | Medium |
Major Players *Disclaimer: Major Players sorted in no particular order Image © Mordor Intelligence. Reuse requires attribution under CC BY 4.0. | |
Shopping Application Market Analysis by Mordor Intelligence
Shopping application market size in 2026 is estimated at USD 1.84 billion, growing from 2025 value of USD 1.61 billion with 2031 projections showing USD 3.54 billion, growing at 14.04% CAGR over 2026-2031. This rapid expansion stems from mobile-first consumer behavior, AI-driven personalization, and maturing logistics-as-a-service frameworks that jointly compress purchase journeys and elevate conversion rates. Growth accelerates wherever smartphone adoption converges with robust digital payment infrastructure, encouraging the integration of super-apps that bundle shopping with social commerce. Competitive intensity rises as platform owners embed buy-now-pay-later options, augmented reality product visualization, and AI concierges to improve customer lifetime value. At the same time, cloud economics lower entry barriers, enabling small merchants to carve niches in the shopping application market despite escalating user-acquisition costs.
Key Report Takeaways
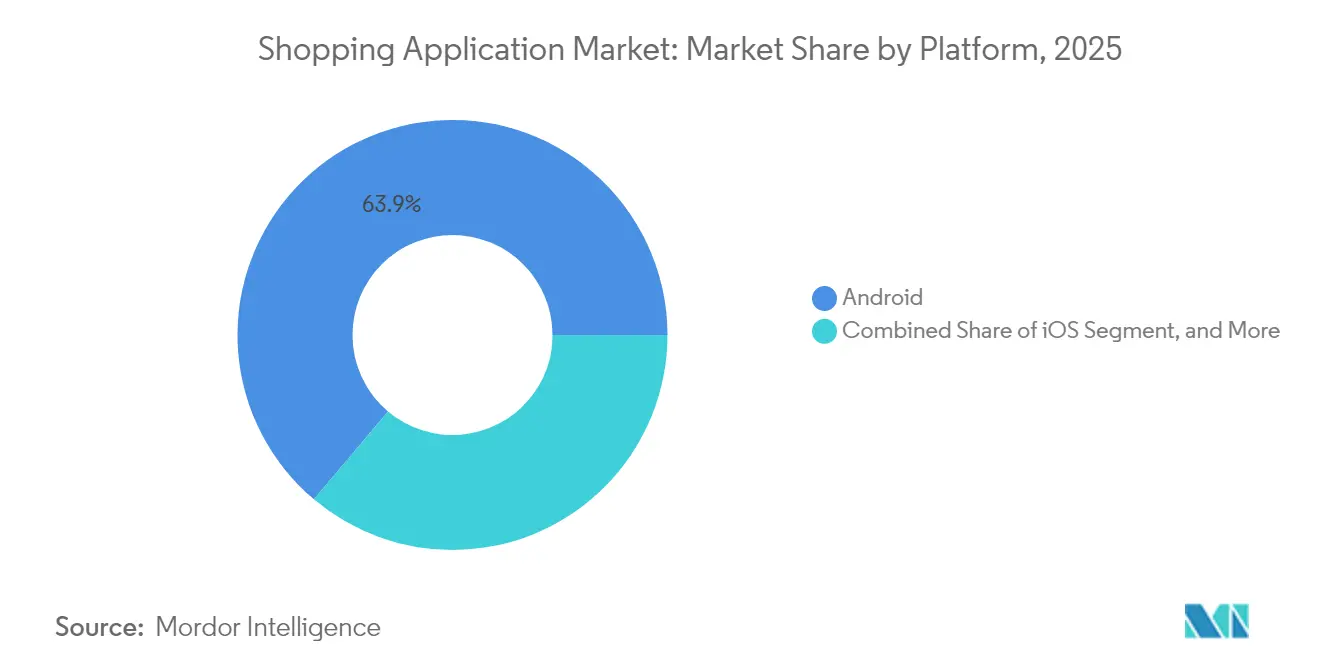
- By platform, Android captured 63.85% shopping application market share in 2025, while Web/Progressive Web App platforms are projected to advance at a 16.05% CAGR through 2031.
- By business model, the B2C marketplace segment held a 54.10% share of the shopping application market size in 2025; subscription and fee-based apps are poised to grow at a 16.12% CAGR through 2031.
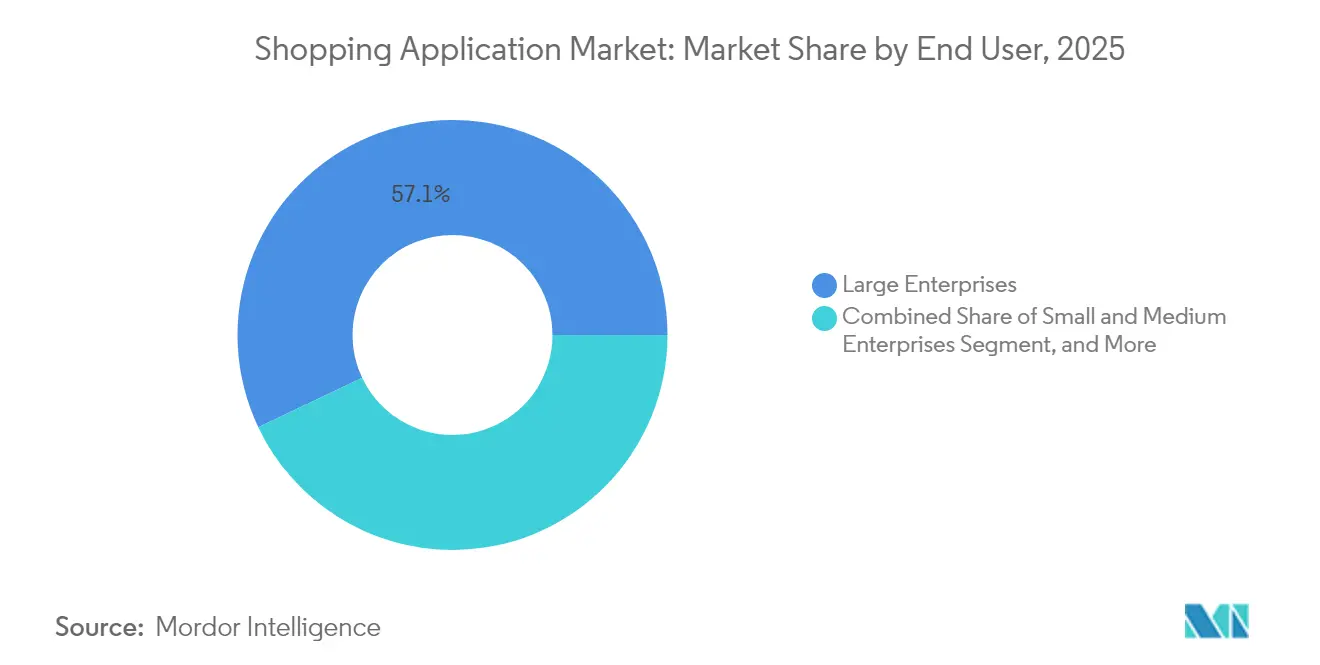
- By end user, large enterprises accounted for 57.05% of the shopping application market size in 2025, whereas small and medium-sized enterprises are expected to expand at a 15.42% CAGR through 2031.
- By deployment model, cloud-based solutions led with a 68.90% share of the shopping application market in 2025; hybrid architectures are set to grow at a 15.28% CAGR over the forecast period.
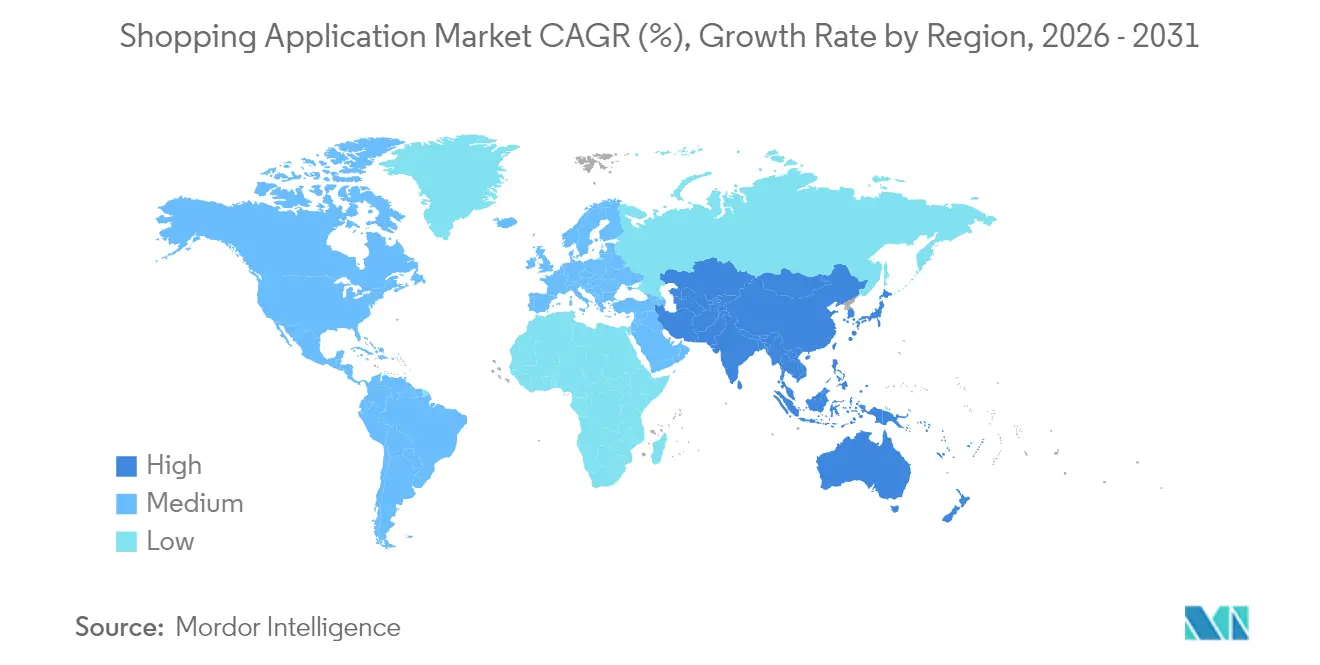
- By geography, North America commanded 37.35% of the shopping application market size in 2025, and the Asia Pacific is expected to register the fastest CAGR of 15.78% from 2026 to 2031.
Note: Market size and forecast figures in this report are generated using Mordor Intelligence’s proprietary estimation framework, updated with the latest available data and insights as of 2026.
Global Shopping Application Market Trends and Insights
Drivers Impact Analysis*
| Driver | (~) % Impact on CAGR Forecast | Geographic Relevance | Impact Timeline |
|---|---|---|---|
| Rapid smartphone penetration | +2.8% | Global, strongest in Asia Pacific and Africa | Medium term (2-4 years) |
| Expanding digital payment infrastructure | +3.1% | Global, notably North America, Europe, Asia Pacific | Short term (≤ 2 years) |
| Aggressive discounting and loyalty programs | +2.2% | Global, effectiveness varies by region | Short term (≤ 2 years) |
| Logistics-as-a-service maturity | +2.5% | North America, Europe core, expanding to Asia Pacific | Medium term (2-4 years) |
| Rise of social-commerce plug-ins in super-apps | +1.9% | Asia Pacific core, spillover globally | Long term (≥ 4 years) |
| Hyper-personalized AI shopping concierges | +2.0% | Global, early adoption in developed markets | Long term (≥ 4 years) |
| Source: Mordor Intelligence | |||
Rapid Smartphone Penetration
Rising 5G handset affordability across India and Southeast Asia enables video-rich catalogs and augmented reality try-ons, which were once constrained by bandwidth limits. Newly connected consumers bypass desktop retail entirely, rewarding platforms designed for one-handed navigation and gesture-based checkout, as governments pair device subsidies with fintech inclusion schemes. Wallet adoption scales in tandem, forming a feedback loop that accelerates the growth of the shopping application market. Location-aware APIs now route users to nearby merchants promising same-day delivery, a capability that boosts retention for apps integrating hyperlocal inventory. These trends collectively reinforce Android's leadership, yet open up space for browser-based Progressive Web Apps that ride the same mobile wave without store listing hurdles.
Expanding Digital Payment Infrastructure
Instant payment rails and central bank digital currencies compress settlement times, allowing apps to issue refunds within seconds and reinforce trust. Embedded buy-now-pay-later modules open higher-ticket categories to Gen-Z shoppers who spurn revolving credit. Cross-border blockchain settlements unlock new export channels for small brands, intensifying global competition in the shopping application market. In parallel, integrated insurance, micro-investment, and credit lines increase monetization avenues per active user. Platforms able to orchestrate these services through a single sign-on gain durable engagement advantages.
Aggressive Discounting and Loyalty Programs
Cash-back engines, tiered memberships, and gamified point schemes continue to push average order values upward. AI-optimized vouchers personalize offers based on lifetime value, reducing subsidy waste while maintaining high conversion rates. As app-to-app price discovery rises, loyalty mechanics become a moat, binding users through experiential perks such as early product drops or streaming content bundles. Regional variance persists: coupon elasticity is highest in price-sensitive Southeast Asia, whereas U.S. shoppers respond more favorably to expedited delivery. Sustained promotional spend, however, risks margin compression unless offset by private-label expansion or advertising revenue.
Logistics-as-a-Service Maturity
Standardized last-mile APIs enable apps to auto-switch carriers based on real-time cost-to-promise calculations, thereby slashing failed delivery incidents. For SMEs, warehouse-as-a-service nodes place inventory within overnight reach of dense urban clusters, leveling speed parity with giants. IoT telemetry provides end customers with live parcel temperature and shock data, which is critical for groceries and electronics. Drone and autonomous vehicle pilots in the United States hint at significant cost savings once regulations align. These operational gains feed back into customer expectations, making two-day shipping feel sluggish and reshaping competitive baselines.
Restraints Impact Analysis*
| Restraint | (~) % Impact on CAGR Forecast | Geographic Relevance | Impact Timeline |
|---|---|---|---|
| Intensifying data-privacy regulations | -1.8% | Europe, North America core, expanding worldwide | Medium term (2-4 years) |
| High customer-acquisition costs | -2.1% | Global, highest in mature markets | Short term (≤ 2 years) |
| Cyber-fraud and payment chargebacks | -1.2% | Global, variable by region | Short term (≤ 2 years) |
| App-store policy volatility on in-app fees | -1.4% | Global, centered on iOS and Google Play ecosystems | Medium term (2-4 years) |
| Source: Mordor Intelligence | |||
Intensifying Data-Privacy Regulations
Europe’s Digital Services Act requires granular consent flows, necessitating server-side redesigns that consume scarce engineering resources.[1]European Commission, “Digital Services Act Package,” EUROPA.EU Browser tracking prevention blinds retargeting cohorts, inflating ad spend per converted user. Smaller developers lacking compliance teams struggle, sparking acquisition by larger platforms willing to absorb regulatory overhead. Privacy-preserving learning, such as federated algorithms, offers a path forward but raises cloud costs and complicates model tuning. Until standards stabilize, roadmap uncertainty acts as a drag on long-cycle investments in personalization.
High Customer-Acquisition Costs
Auction-based ad inventories on search and social climbed faster than inflation during 2024-2025, eroding contribution margins for new user cohorts. iOS privacy shifts disable look-alike targeting, inflating cost-per-install figures and weakening ROI signals. Saturation in mature markets compels apps to chase niche audiences with expensive influencer partnerships. To mitigate, leading platforms lean into owned-media channels and referral gamification, yet those tactics scale gradually. Elevated acquisition spending persists until alternative discovery surfaces inside the shopping application market and reaches critical mass.
*Our forecasts treat driver/restraint impacts as directional, not additive. The impact forecasts reflect baseline growth, mix effects, and variable interactions.
Segment Analysis
By Platform: Android Commands Scale While PWAs Surge
Android led the segment with 63.85% shopping application market share in 2025 as handset affordability and a permissive publishing model fueled developer uptake. iOS retained a revenue-weighted premium audience but ceded volume leadership, while Web/Progressive Web Apps outpaced all platforms at 16.05% CAGR to 2031. This surge reflects merchants' desire to own direct browser funnels, sidestep store fees, and push instant updates. The shopping application market size tied to Web/Progressive Web Apps is projected to widen as service-worker caching and push notifications replicate a native feel. In parallel, cross-platform frameworks such as Flutter reduce codebase duplication, allowing teams to ship synchronized features.
The competitive landscape within platforms intensifies as super-apps integrate mini-program ecosystems that blur the line between native and web containers. Wearable and in-car commerce endpoints are still in the early stages of adoption, but foreshadow omnichannel touchpoints across smart-home surfaces. Native app fatigue drives some users to bookmark lightweight PWAs, lowering storage demands. Yet, gaming-style experiential shopping, including AR try-ons, continues to anchor heavyweight native installs where GPU performance is crucial. As device capabilities increase, the platform debate will shift to focus on privacy controls and discovery channels rather than raw feature parity.


By Business Model: Subscription Momentum Challenges Marketplace Hegemony
B2C marketplaces accounted for 54.10% of the shopping application market size in 2025, driven by network effects and extensive SKU catalogs. Subscription and fee-based apps, however, are expected to headline growth at a 16.12% CAGR through 2031, as customers opt to pay for ad-free browsing, early access drops, and concierge-level support. Direct retailer apps defend their margins via owned data and brand storytelling, but they confront limited cross-sell potential relative to marketplaces. C2C platforms benefit from increased awareness of the circular economy, although regulatory ambiguities regarding seller verification temper the ramp-up velocity.
The subscription renaissance shifts revenue reliance from one-off sales to predictable recurring inflows, enabling richer personalization budgets and logistics subsidies. High-income cohorts gravitate towards these models, prioritizing convenience over the lowest price, thereby segmenting the shopping application market further. Marketplace incumbents respond by layering optional Prime-style tiers, blurring model lines. Fee-based exclusivity around limited-edition merchandise taps scarcity psychology, reinforcing loyalty loops. As transaction fees compress under regulatory pressure, diversified model mixes become essential for profitability.
By End User: SMEs Democratize Enterprise-Grade Commerce
Large enterprises commanded 57.05% of the shopping application market in 2025, leveraging deep pockets for custom integrations and omnichannel orchestration. Yet small and medium enterprises post the highest 15.42% CAGR as no-code SaaS stacks render advanced storefronts turnkey. Marketplace onboarding removes logistics hurdles, letting micro-brands ship worldwide from day one. Individual sellers deploy social-commerce plugins to monetize personal followings, reshaping influencer economies into full-stack retail.
Rising SME clout compels platform providers to roll out tiered pricing, templated analytics, and AI-driven catalog builders. Enterprise buyers, in contrast, seek extensive API integration with ERP, CRM, and warehouse systems, prompting vendors to certify SOC 2 and ISO controls. The resulting solution bifurcation drives alliance plays: SaaS vendors partner with systems integrators to court Fortune 500 budgets, while micro-merchant apps lean on intuitive UX and transparent fees. As SME penetration deepens, competitive differentiation shifts toward community support and marketplace discovery, rather than raw feature breadth.
By Deployment Model: Hybrid Architecture Balances Sovereignty and Scale
Cloud-based deployments captured a 68.90% share in 2025, as elastic compute and global CDNs shortened the time-to-market. Nonetheless, hybrid configurations grow at the fastest rate, with a 15.28% CAGR through 2031, by combining on-premises data guardianship with cloud burst capacity. Regulated verticals, such as healthcare and finance, require in-country storage to comply with sovereignty mandates, spurring interest in containerized microservices that can seamlessly transition between clouds and private clusters. On-prem footprints persist for latency-sensitive or legacy-bound workflows, though capex burdens deter greenfield adoption.
Platform providers respond with reference architectures that support Kubernetes anywhere, central policy planes, and edge caching. Microsoft’s multicloud management suite, for example, surfaces consistent governance across hybrid estates. [2]Microsoft, “Unified Management for Hybrid and Multicloud Environments,” NEWS.MICROSOFT.COM The shopping application market is increasingly valuing deployment-agnostic codebases that safeguard against vendor lock-in, especially as geopolitical tensions threaten data residency rules. Flexible licensing models, pay-as-you-go meters, and marketplace SKUs further catalyze hybrid uptake.
Geography Analysis
The Asia Pacific, meanwhile, is projected to accelerate at a 15.78% CAGR, driven by mobile-only consumers and supportive digital economy policies. The Asia Pacific accounted for USD 0.59 billion of the shopping application market size in 2025, driven by super-app ecosystems that consolidate discovery, payment, and logistics into a single interface. India, Indonesia, and Vietnam lead growth as smartphone affordability aligns with government-backed digital identity frameworks. Mobile wallet penetration surpasses 80% in tier-one Chinese cities, letting merchants settle funds instantly and reinvest in inventory cycles. Cross-border live-stream selling from China to Southeast Asia deepens regional integration and elevates creator-driven commerce.
North America retained a 37.35% market share of the shopping application market in 2025, driven by high disposable incomes and mature fulfillment networks. North America’s 2025 value exceeded USD 0.60 billion, supported by same-day fulfillment expectations and near-ubiquitous BNPL availability. Retailers are integrating AR and VR experiences to regain showroom relevance, a key differentiator in the competitive shopping application market. Regulatory scrutiny on large platforms spurs experimentation with Progressive Web Apps, open banking, and decentralized ID standards. Canadian merchants are leveraging USMCA provisions to expand their cross-border catalog reach, while Mexico’s instant-payment system launches pilot rails for micro-merchants.
Europe recorded USD 0.30 billion in 2025, advancing on the back of single-market logistics corridors and consumer trust in robust refund laws. Yet, cookie deprecation inflates user-acquisition costs, prompting heavier investment in loyalty programs and first-party data strategies. Rising energy prices drive demand for efficient last-mile networks and carbon-neutral delivery pledges. Southern Europe outpaces the bloc average as smartphone upgrades spark surges in mobile-only shopping, adding new users to the broader shopping application market.

Competitive Landscape
The market remains moderately fragmented, with Amazon, Alibaba, and Walmart anchoring global GMV while regional champions like Flipkart, MercadoLibre, and Zalando defend local moats. Machine-learning investment tops strategic agendas, exemplified by Shopify’s USD 2.1 billion acquisition of Deliverr to compress fulfillment timelines.[3]Shopify, “Shopify Announces Q3 2024 Results,” SHOPIFY.COM Platforms are racing to patent visual search, conversational agents, and autonomous delivery stacks, as indicated by a rise in commerce-class filings at the USPTO.[4]USPTO, “Patent Activity Reports,” USPTO.GOV
Strategic moves center on vertical integration: Amazon scales drone delivery to Phoenix suburbs, converting proof-of-concept into operational lane density. Alibaba’s cloud spin-off unlocks infrastructure monetization while easing antitrust pressure. Meta layers AI shopping tools on social graphs, reinforcing discovery loops within Instagram and Facebook.
Competitive differentiation leans on fulfillment SLAs, data-rich personalization, and ecosystem breadth. Loyalty memberships and exclusive drops enhance switching costs, while open APIs encourage third-party extensions. Regional regulations magnify fragmentation: Europe’s privacy guardrails favor incumbents with compliance scale, whereas Southeast Asia’s lighter regime spawns numerous niche entrants. Overall, the combined share of the top five players approximated 45% in 2024, underscoring a contestable yet consolidating arena.
Shopping Application Industry Leaders
Amazon.com, Inc.
Alibaba Group Holding Limited
eBay Inc.
Walmart Inc.
JD.com, Inc.
- *Disclaimer: Major Players sorted in no particular order

Recent Industry Developments
- October 2025: Amazon announced the expansion of its AI-powered shopping assistant "Rufus" to include voice commerce capabilities across all Echo devices, enabling customers to make purchases through natural language conversations. This development represents a significant advancement in conversational commerce, positioning Amazon to capture a larger share of voice-activated shopping transactions.
- September 2025: Shopify has launched its new "Shop Pay Installments" service globally, enabling merchants to offer flexible payment options directly within their applications without requiring third-party integrations. The service competes directly with established buy-now-pay-later providers while keeping transaction data within Shopify's ecosystem.
- August 2025: Alibaba completed the integration of its Taobao and Tmall platforms into a unified shopping experience powered by advanced AI recommendation engines. The consolidation enables cross-platform inventory optimization, providing merchants with simplified management tools while offering consumers a more cohesive shopping experience.
- July 2025: Walmart acquired Cruise's retail division, an autonomous delivery startup, for USD 1.2 billion, accelerating its investment in last-mile delivery automation. This acquisition enables Walmart to access proprietary autonomous vehicle technology specifically designed for retail delivery applications.
- June 2025: Meta introduced "Instagram Shopping Pro," a subscription-based service that provides advanced analytics and AI-powered inventory management tools for businesses selling through Instagram and Facebook. The service targets small and medium enterprises seeking professional e-commerce capabilities within social media platforms.
- May 2025: JD.com launched its "Smart Logistics Network 3.0" across Southeast Asia, featuring AI-optimized routing and predictive inventory placement that reduces delivery times by up to 40%. The network expansion strengthens JD.com's competitive position against regional e-commerce platforms.


Global Shopping Application Market Report Scope
| iOS |
| Android |
| Web / Progressive Web App |
| Others |
| B2C Marketplace |
| Direct Retailer Apps |
| C2C Platforms |
| Subscription / Fee-based Apps |
| Large Enterprises |
| Small and Medium Enterprises |
| Individual Sellers |
| Cloud-based |
| On-premise |
| Hybrid |
| North America | United States |
| Canada | |
| Mexico | |
| South America | Brazil |
| Argentina | |
| Rest of South America | |
| Europe | Germany |
| United Kingdom | |
| France | |
| Italy | |
| Spain | |
| Rest of Europe | |
| Asia Pacific | China |
| Japan | |
| India | |
| South Korea | |
| Australia | |
| Singapore | |
| Rest of Asia Pacific | |
| Middle East | United Arab Emirates |
| Saudi Arabia | |
| Turkey | |
| Rest of Middle East | |
| Africa | South Africa |
| Egypt | |
| Nigeria | |
| Rest of Africa |
| By Platform | iOS | |
| Android | ||
| Web / Progressive Web App | ||
| Others | ||
| By Business Model | B2C Marketplace | |
| Direct Retailer Apps | ||
| C2C Platforms | ||
| Subscription / Fee-based Apps | ||
| By End User | Large Enterprises | |
| Small and Medium Enterprises | ||
| Individual Sellers | ||
| By Deployment Model | Cloud-based | |
| On-premise | ||
| Hybrid | ||
| By Geography | North America | United States |
| Canada | ||
| Mexico | ||
| South America | Brazil | |
| Argentina | ||
| Rest of South America | ||
| Europe | Germany | |
| United Kingdom | ||
| France | ||
| Italy | ||
| Spain | ||
| Rest of Europe | ||
| Asia Pacific | China | |
| Japan | ||
| India | ||
| South Korea | ||
| Australia | ||
| Singapore | ||
| Rest of Asia Pacific | ||
| Middle East | United Arab Emirates | |
| Saudi Arabia | ||
| Turkey | ||
| Rest of Middle East | ||
| Africa | South Africa | |
| Egypt | ||
| Nigeria | ||
| Rest of Africa | ||


Key Questions Answered in the Report
What is the projected value of the shopping application market by 2031?
The market is forecast to reach USD 3.54 billion by 2031, reflecting a 14.04% CAGR over 2026-2031.
Which platform currently dominates unit volume?
Android leads with 63.85% share in 2025 because of its extensive global handset base.
Why are subscription-based shopping apps growing faster than marketplaces?
Users are willing to pay for ad-free interfaces, exclusive drops, and premium support, pushing subscription apps to a 16.12% CAGR through 2031.
Which region is expected to grow the fastest?
Asia Pacific is projected to expand at 15.78% CAGR due to mobile-first consumption and supportive digital commerce policies.
How are hybrid deployment models benefiting enterprises?
Hybrid architectures let firms keep sensitive data on-premises for compliance while exploiting cloud scalability for peak traffic handling.
What emerging technology is easing last-mile costs?
Autonomous drone delivery trials show promise in lowering fulfillment expenses and accelerating delivery windows.
Page last updated on:


