Visitor Management System Market Size and Share
Market Overview
| Study Period | 2020 - 2031 |
|---|---|
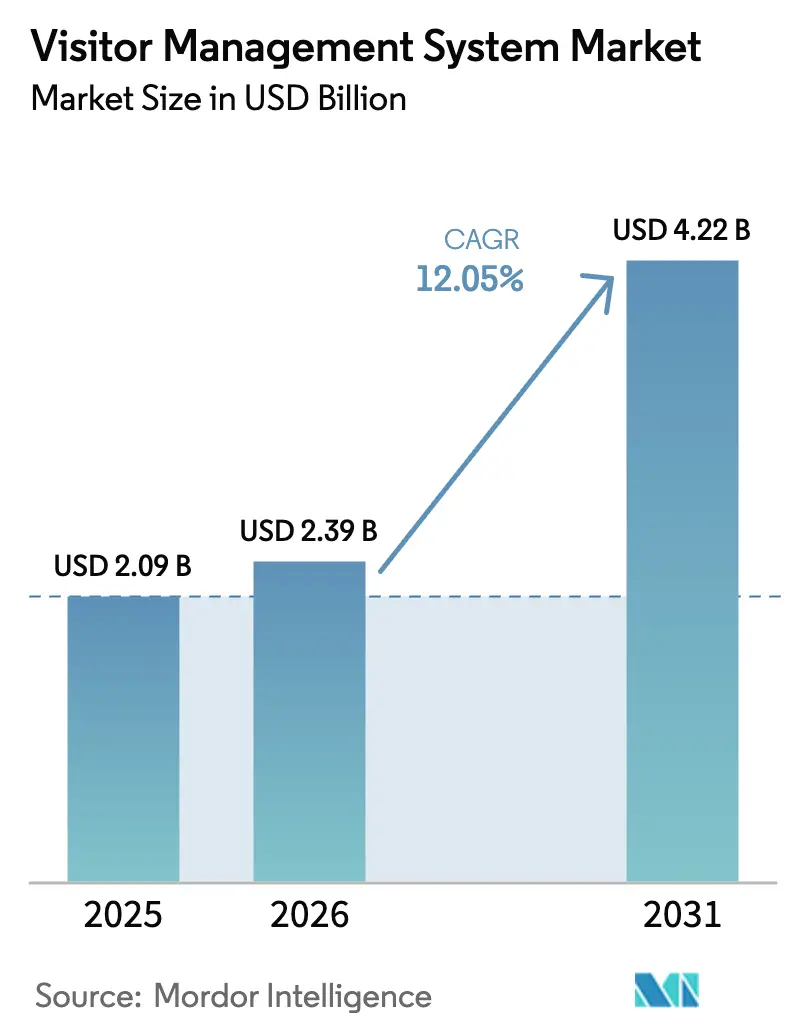
| Market Size (2026) | USD 2.39 Billion |
| Market Size (2031) | USD 4.22 Billion |
| Growth Rate (2026 - 2031) | 12.05% CAGR |
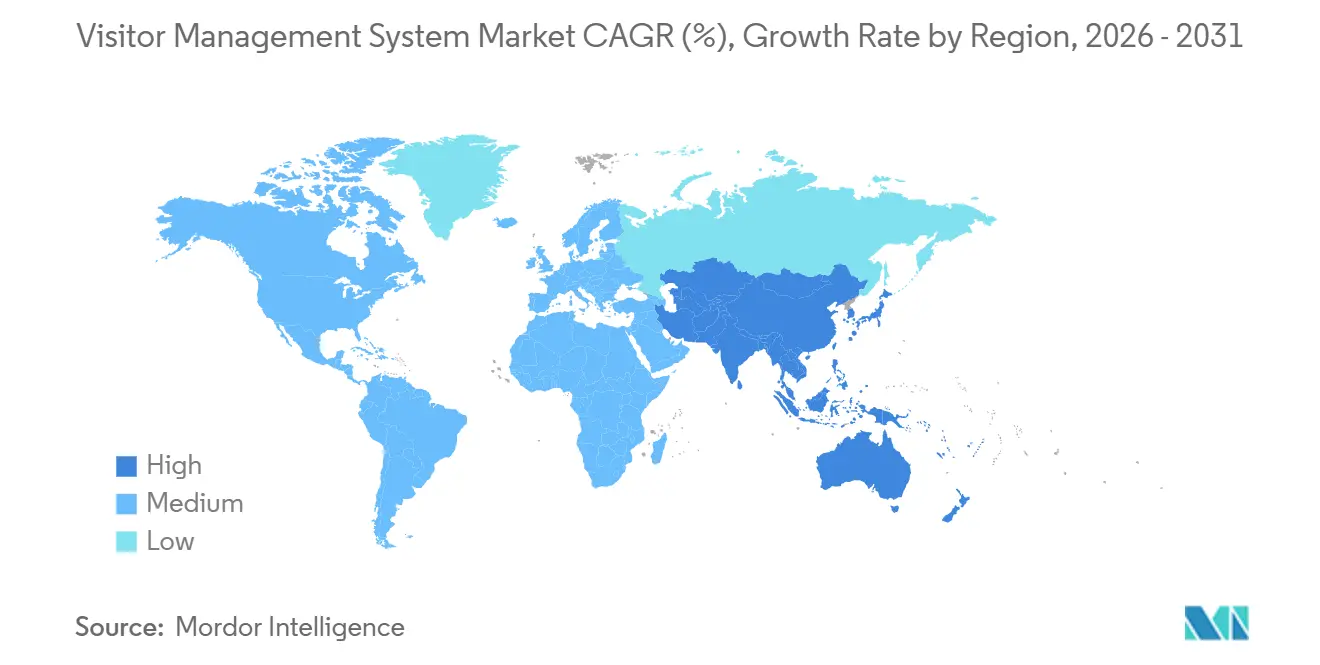
| Fastest Growing Market | Asia Pacific |
| Largest Market | North America |
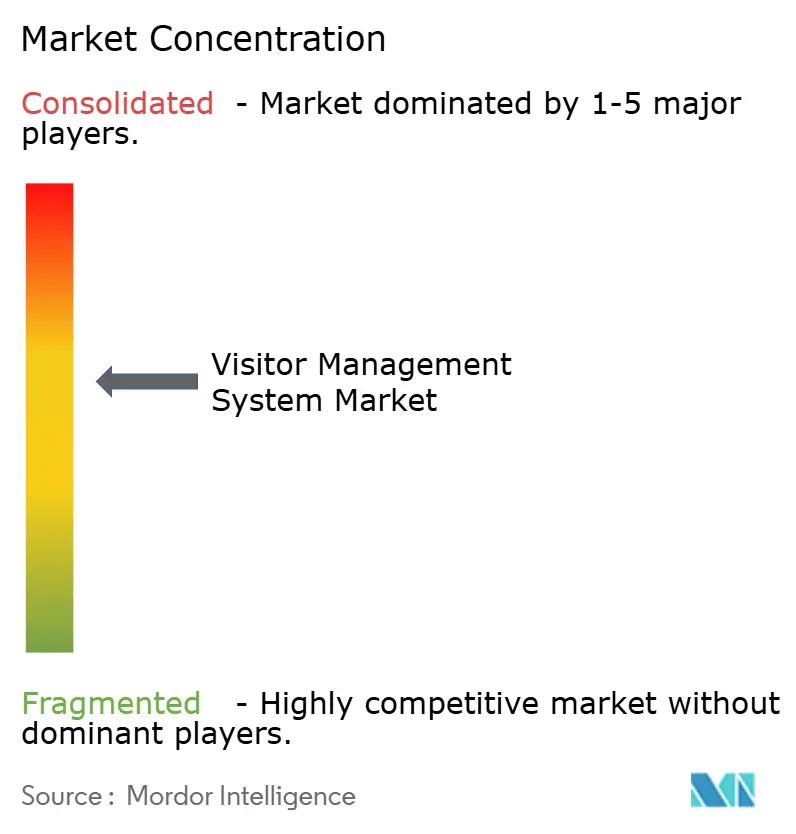
| Market Concentration | Medium |
Major Players *Disclaimer: Major Players sorted in no particular order Image © Mordor Intelligence. Reuse requires attribution under CC BY 4.0. | |
Visitor Management System Market Analysis by Mordor Intelligence
The Visitor Management System Market size is projected to be USD 2.09 billion in 2025, USD 2.39 billion in 2026, and reach USD 4.22 billion by 2031, growing at a CAGR of 12.05% from 2026 to 2031.
Digital audit-trail mandates, convergence with property-technology suites, and insurer incentives that reward integrated safety platforms are fueling that expansion. Healthcare leads adoption because patient-safety rules demand verified logs, while small businesses now join the Visitor Management System market thanks to affordable cloud subscriptions. Cloud deployment models dominate new rollouts due to elastic scalability and automatic updates, and artificial-intelligence features that screen identities in real time are redefining competitive benchmarks. Moderate consolidation is underway as security conglomerates acquire cloud specialists, yet pricing pressure persists because PropTech vendors bundle visitor workflows into broader building-management dashboards.
Key Report Takeaways
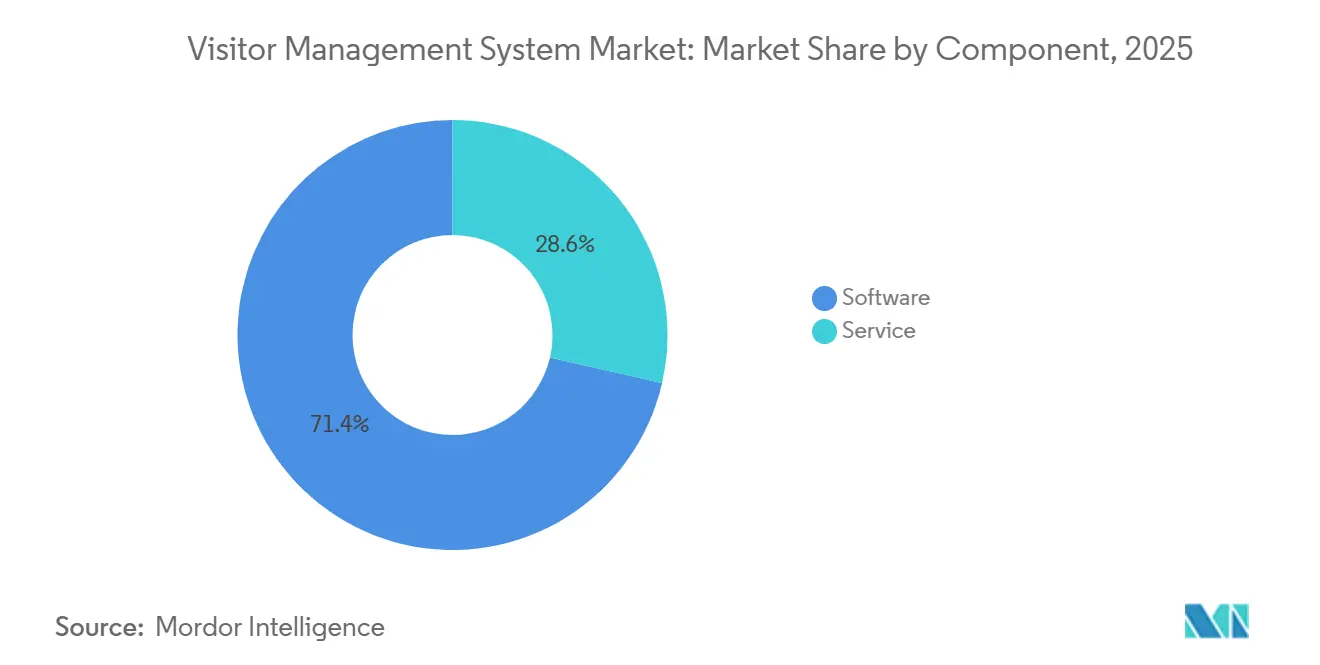
- By component, software accounted for 71.40% of the Visitor Management System market share in 2025, while services are advancing at a 14.20% CAGR through 2031.
- By deployment mode, cloud held 66.34% of the Visitor Management System market size in 2025 and is expanding at a 17.50% CAGR to 2031.
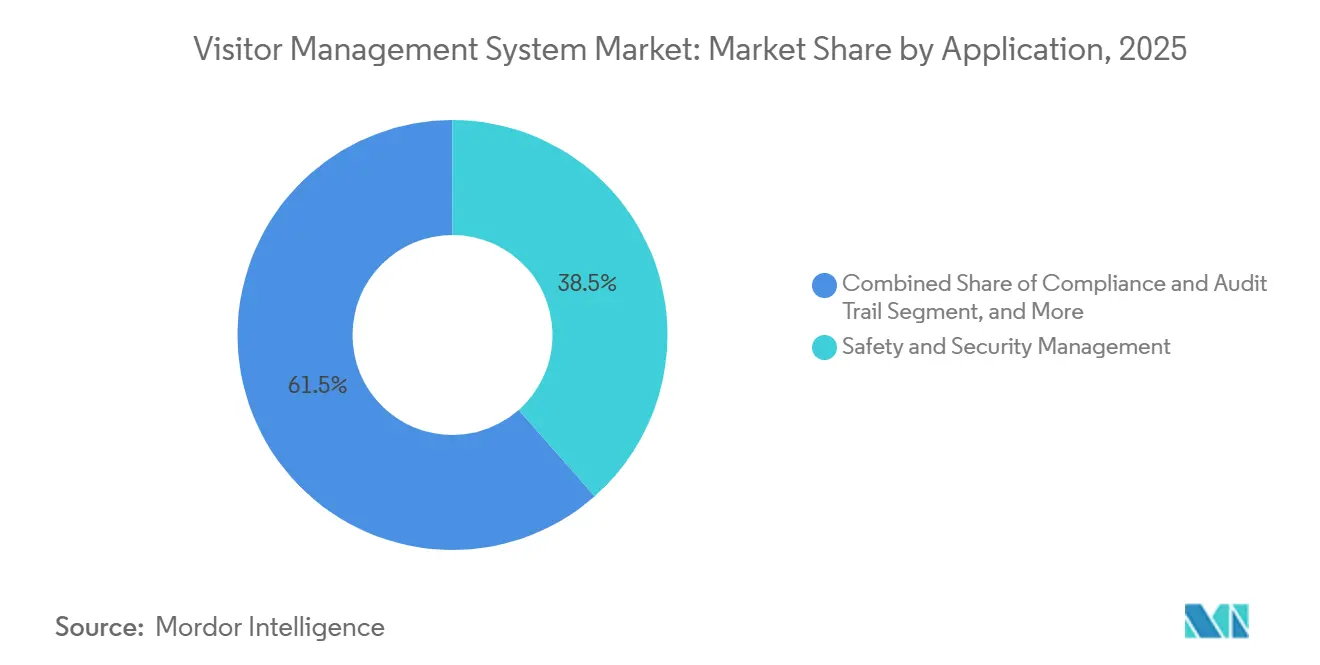
- By application, safety and security dominated with 38.50% of 2025 revenue, yet compliance and audit functions are growing at a 15.1% CAGR through 2031.
- By end-user industry, healthcare led with 24.90% of 2025 revenue, whereas the education sector is on track for a 13.80% CAGR over the same horizon.
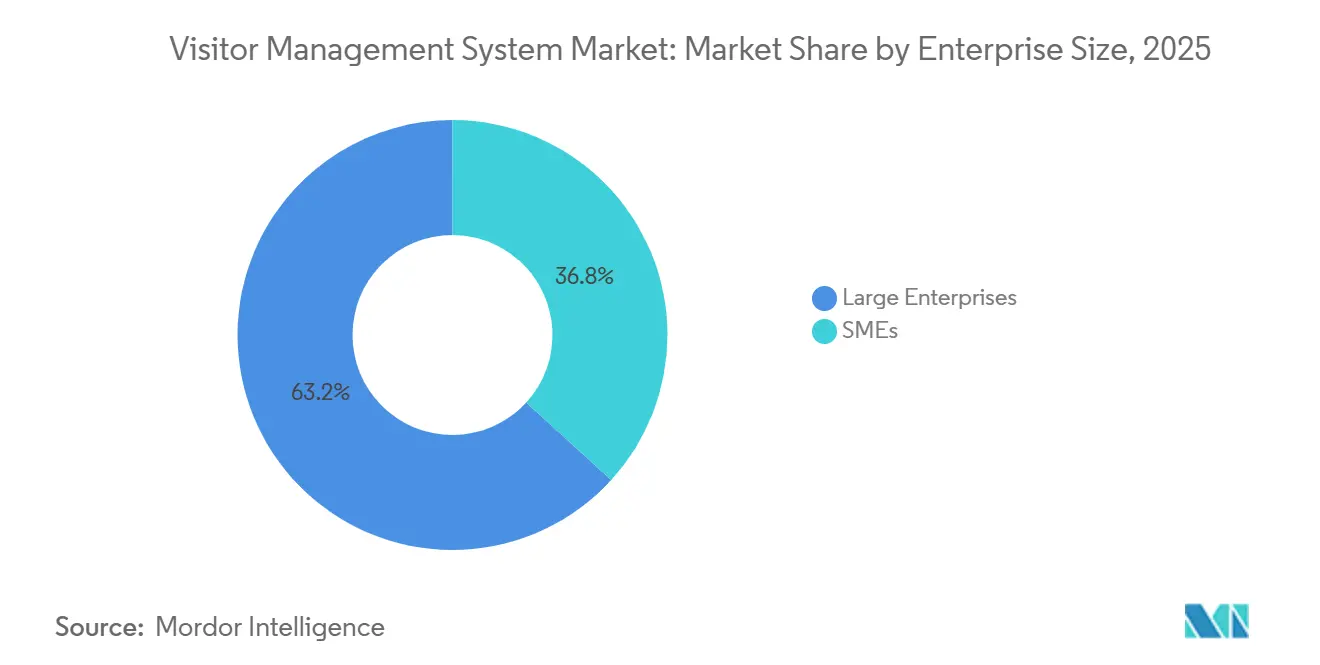
- By enterprise size, large organizations generated 63.21% of 2025 sales, but small and medium enterprises are accelerating at a 16.40% CAGR.
- North America retained 37.30% of 2025 revenue, while Asia-Pacific is set to grow at a 12.60% CAGR between 2026 and 2031.
Note: Market size and forecast figures in this report are generated using Mordor Intelligence’s proprietary estimation framework, updated with the latest available data and insights as of January 2026.
Global Visitor Management System Market Trends and Insights
Drivers Impact Analysis*
| Driver | (~) % Impact on CAGR Forecast | Geographic Relevance | Impact Timeline |
|---|---|---|---|
| Rising Need for Enhanced Facility Security and Compliance | +2.8% | North America, Europe, Asia-Pacific government hubs | Medium term (2-4 years) |
| Growing Demand for Touchless and Automated Visitor Experience | +2.3% | North America, Western Europe, Asia-Pacific cities | Short term (≤ 2 years) |
| Regulatory Mandates for Digital Visitor Logs | +1.4% | Europe, North America, Asia-Pacific | Long term (≥ 4 years) |
| PropTech Consolidation Driving Bundled VMS Modules | +1.6% | North America and Europe commercial real estate | Medium term (2-4 years) |
| AI-Powered Real-Time Threat Detection Analytics | +2.1% | Global high-security verticals | Medium term (2-4 years) |
| Insurance Premium Discounts for Integrated VMS | +0.9% | North America and Europe | Long term (≥ 4 years) |
| Source: Mordor Intelligence | |||
Rising Need for Enhanced Facility Security and Compliance
Workplace-violence incidents and OSHA inspections are pushing firms to replace paper ledgers with digital visitor platforms that create tamper-proof logs and enable instant alerts. Hospitals experienced security events at 69% of sites, so administrators now screen guests against sex-offender lists before printing badges. Manufacturing plants balance OSHA record-keeping with export-control rules that demand restricted-party screening, prompting investment in unified visitor and identity checks.[1]FacilityOS, “Compliance Standards > OSHA,” facilityos.comRaptor Technologies protects more than 60,000 schools with a system that scans IDs and stores searchable histories for audits.
Growing Demand for Touchless and Automated Visitor Experience
The expectation formed in airports and hotels now moves to offices, where guests want mobile pre-registration and kiosk check-in. TSA has installed Credential Authentication Technology across 250 airports, enabling one-to-one facial matching that reduces contact and speeds processing. Dubai’s citywide biometric hotel program processed 15.7 million visitors in ten months, validating large-scale touchless workflows. HID Global solutions handle more than 40 million check-ins annually with average processing times near 20 seconds. These efficiencies lower staffing costs and elevate guest perception, so laggards risk reputational harm.
Regulatory Mandates for Digital Visitor Logs
GDPR, HIPAA, OSHA, and data-localization statutes obligate organizations to maintain verifiable visitor records. European firms must house personal data within regional clouds, while U.S. healthcare providers need automated audit trails to demonstrate HIPAA compliance. Governments increasingly fine violations, which elevates compliance systems from nice-to-have to essential infrastructure. Vendors that supply configurable consent forms, encrypted storage, and timed data deletion are gaining share.
AI-Powered Real-Time Threat Detection Analytics
AI now turns passive logs into proactive defenses by matching faces against watchlists in sub-second intervals. U.S. Customs and Border Protection blocked 2,229 impostors with facial biometrics by late 2025. Visitor platforms adopt similar algorithms validated by NIST that maintain accuracy even with masks. Models also flag anomalies, such as repeat denied entries or long dwell times in sensitive zones, allowing security teams to intervene before incidents escalate.
Restraints Impact Analysis*
| Restraint | (~) % Impact on CAGR Forecast | Geographic Relevance | Impact Timeline |
|---|---|---|---|
| High Initial Implementation Costs | -1.8% | Global SMEs and emerging markets | Short term (≤ 2 years) |
| Data-Privacy and Localization Hurdles in Cloud Deployments | -1.5% | Europe, Asia-Pacific, Middle East | Long term (≥ 4 years) |
| Chip-Supply Tensions Inflating Kiosk Hardware BOM | -0.7% | Global semiconductor supply chains | Medium term (2-4 years) |
| QR or App Fatigue in Hospitality and Retail Users | -0.4% | North America and Europe hospitality | Short term (≤ 2 years) |
| Source: Mordor Intelligence | |||
High Initial Implementation Costs
Hardware for kiosks, printers, and biometrics can reach USD 15,000 per lobby, and site remediation at airports has taken up to one year.[2]DHS TSA, “Credential Authentication Technology Procurement and Deployment,” dhs.gov Subscription offers starting near USD 99 monthly reduce capex, yet many SMEs still weigh return on investment against other priorities.
Data-Privacy and Localization Hurdles in Cloud Deployments
GDPR, China’s CSL, and India’s localization mandates force vendors to build regional data centers, increasing costs and delaying rollouts. TSA stresses that travelers may opt out of biometrics and that images are deleted after verification, reflecting the sensitive climate around personal data. Healthcare buyers often insist on on-premise servers, limiting the scale advantages of cloud.
*Our forecasts treat driver/restraint impacts as directional, not additive. The impact forecasts reflect baseline growth, mix effects, and variable interactions.
Segment Analysis
By Component: Services Gain as Integration Complexity Rises
Services revenue is accelerating because organizations need integration with access-control gear and identity directories. Software maintained 71.40% of the Visitor Management System market share in 2025, yet services are expected to rise at a 14.20% CAGR. Managed packages that guarantee 24/7 uptime attract aerospace and pharmaceutical clients that treat visitor logs as mission-critical.
Connectivity breadth is now a differentiator. HID Global lists more than 55 partner integrations, helping enterprises mesh visitor flows with HR and IT systems. That complexity keeps service teams busy and boosts annuity revenue, deepening vendor lock-in.


By Deployment Mode: Cloud Surges on Multi-Site Scalability
Cloud installations commanded 66.34% of the Visitor Management System market size in 2025 and are widening at a 17.50% CAGR. Centralized dashboards, automatic updates, and mobile credentialing favor the cloud, especially for retailers and hospital networks. On-premise still serves defense contractors that ban internet-connected hardware.
Data-sovereignty rules in India and Russia compel local hosting, which sustains a niche for private clouds. Even so, PropTech suites such as Brivo Security Suite demonstrate that SaaS models can comply when paired with regional data nodes.
By Application: Compliance Overtakes Safety as Primary Use Case
Safety dominated with 38.50% of 2025 spending, but audit-trail functionality is gaining fastest at a 15.1% CAGR. OSHA inspectors and export-control auditors now request digital logs rather than paper sign-in sheets. Enterprises respond by embedding visitor modules that force policy acknowledgment before badge issuance, reducing legal exposure.
Parking and facility-access tie-ins add vehicle tracking and emergency mustering, while event modules manage bulk guest uploads. That versatility cements the Visitor Management System market as foundational infrastructure, not a reception convenience.

By End-User Industry: Healthcare Leads, Education Accelerates
Hospitals contributed 24.90% of 2025 revenue, and strict patient-safety rules will lift the segment at a 13.80% CAGR. Systems limit access to intensive-care wards and log all visitors for infection-control tracing. Schools deploy instant sex-offender checks, with more than 35,000 campuses protected.
Government agencies align with Homeland Security Presidential Directive 12, while industrial plants satisfy OSHA and ITAR audits. Stadiums integrate ticketing and biometrics to speed entry. Each vertical showcases specialized workflows, yet all rely on the same Visitor Management System market backbone.
By Enterprise Size: SMEs Embrace Cloud Subscriptions
Large organizations generated 63.21% of sales in 2025, but SMEs now post the briskest 16.40% CAGR. Entry-level packages under USD 150 monthly let small offices replace paper books without big IT budgets. Vendors reserve advanced AI screening for enterprise tiers, creating upsell ladders that support lifetime value.
Meanwhile, multinationals contract for managed services that include penetration testing and compliance audits, reflecting how the Visitor Management System industry balances simplicity for small firms with depth for complex estates.
Geography Analysis
North America owned 37.30% of 2025 revenue, underpinned by OSHA rules and insurer incentives that discount premiums for integrated security. CBP processed 807 million travelers with facial biometrics by November 2025, normalizing the technology for corporate lobbies. Canada’s provinces mandate patient-privacy safeguards, spurring hospital deployments, while Mexican factories align with United States standards at cross-border plants.
Asia-Pacific is the growth engine, advancing at a 12.60% CAGR. India’s Smart Cities Mission funds biometric visitor systems for municipal buildings, and China outfits new towers with bundled PropTech suites. Japan’s labor shortages drive touchless kiosks, and Australia mandates verified logs in schools.
Europe balances opportunity and constraint. GDPR elevates compliance use cases yet complicates cloud rollout, steering some clients toward local data centers. Brazil’s LGPD spurs gradual uptake in South America, while The Nest Dubai building proves Middle East appetite for carbon-neutral, tech-rich facilities. Africa remains early stage, limited to corporate campuses and critical infrastructure.

Competitive Landscape
Competition is moderate, with physical security stalwarts like HID Global, Honeywell, and Johnson Controls jousting against cloud-native rivals such as Envoy and Proxyclick. Motorola Solutions entered the field by acquiring InVisit in 2025, illustrating how conglomerates bolt visitor workflows onto surveillance and access portfolios. Horizontal integration offers economies of scale, whereas specialists defend market share with slick mobile UX and vertical templates.
PropTech platforms now embed visitor modules at no extra cost, pressuring standalone vendors to prove superior AI analytics or broader integrations. HID Global advertises connectivity to more than 55 IT systems, a breadth that eases enterprise procurement.[3]HID Global, “Gerenciamento de Visitantes,” hidglobal.com Managed-service contracts that guarantee uptime create sticky revenue and differentiate in a price-sensitive Visitor Management System market.
Disruptors such as Kisi bundle mobile access, visitor logs, and analytics for under USD 199 per month, targeting SMEs. Meanwhile, insurers’ premium-discount programs encourage property owners to adopt certified systems, indirectly shaping vendor roadmaps toward compliance and risk scoring features.
Visitor Management System Industry Leaders
Envoy Inc.
Proxyclick SA
Traction Guest Corporation (Sign In Enterprise)
HID Global Corporation (Assa Abloy AB)
iLobby Systems Inc.
- *Disclaimer: Major Players sorted in no particular order

Recent Industry Developments
- January 2026: Envoy enhanced QR-code badge delivery, reducing queue times in corporate lobbies.
- December 2025: Dubai launched a citywide biometric hotel check-in program processing 15.7 million guests in ten months.
- August 2025: Brivo integrated visitor workflows into its cloud access platform through an Envoy partnership.
- August 2025: Johnson Controls unveiled OpenBlue Visitor, reporting a 155% ROI with an eight-month payback.


Research Methodology Framework and Report Scope
Market Definitions and Key Coverage
Our study defines the visitor management system (VMS) market as every software-led or cloud-delivered platform, kiosk, or mobile application that authenticates, logs, and manages the physical entry and exit of guests, contractors, and couriers across corporate, public, and critical-infrastructure sites.
(Scope exclusion) Pure-play access-control hardware, standalone biometric readers sold without integrated visitor-registration software, and event-ticketing tools sit outside this scope.
Segmentation Overview
- By Component
- Software Type
- Web-Based Solutions
- Mobile-App Solutions
- Service
- Professional Services
- Managed Services
- Software Type
- By Deployment Mode
- Cloud
- On-Premise
- By Application
- Safety and Security Management
- Compliance and Audit Trail
- Parking and Facility Access
- Other Applications
- By End-User Industry
- Healthcare
- Education
- Government and Public Sector
- Industrial
- Media and Entertainment
- Transportation and Logistics
- Retail
- Other End-User Industries
- By End-User Enterprise Size
- Large Enterprises
- Small and Medium Enterprises
- By Geography
- North America
- United States
- Canada
- Mexico
- Europe
- Germany
- United Kingdom
- France
- Italy
- Spain
- Russia
- Rest of Europe
- Asia-Pacific
- China
- Japan
- India
- South Korea
- Australia
- Rest of Asia-Pacific
- Middle East
- Saudi Arabia
- United Arab Emirates
- Turkey
- Rest of Middle East
- Africa
- South Africa
- Nigeria
- Rest of Africa
- South America
- Brazil
- Argentina
- Rest of South America
- North America
Detailed Research Methodology and Data Validation
Primary Research
Mordor analysts conducted structured interviews and email surveys with facility managers, IT heads, physical-security consultants, and software integrators across North America, Europe, and Asia-Pacific. Their insights confirmed average per-site license fees, penetration rates in hybrid offices, and typical refresh cycles, enabling us to tighten model assumptions and adjust regional weightings where secondary data proved sparse.
Desk Research
We began by gathering macro inputs from freely available tier-1 sources such as the Occupational Safety and Health Administration for facility-security mandates, the U.S. Census Bureau for commercial floor-space growth, Eurostat for enterprise cloud-adoption rates, and the International Organization for Standardization for GDPR-linked compliance standards. Company 10-Ks, investor decks, and press releases supplied recent pricing moves and deployment counts, while patent families from Questel hinted at emerging AI-based authentication features. D&B Hoovers and Dow Jones Factiva helped us size vendor revenues and screen for announced multi-year deals.
These are illustrative references; numerous additional public datasets and proprietary records were consulted to cross-check figures and enrich context.
Market-Sizing & Forecasting
A top-down construct was first built by reconstructing the global addressable pool of connected commercial buildings, adjusting for visitor-heavy industries and applying region-specific penetration ratios derived from primary research. Selected bottom-up checks, supplier revenue roll-ups and sampled average selling price multiplied by installed base, served to validate and calibrate totals. Key market fingerprints include average daily visitor counts, share of cloud subscriptions, compliance-driven replacement cycles, and facility retro-fit rates. Multivariate regression with lagged GDP, commercial construction output, and workplace digitalization indices underpins our 2025-2030 forecast, with scenario analysis capturing regulatory or macro shocks. Gaps in bottom-up data, where encountered, were bridged by proxy ratios from analog software segments and triangulated against expert consensus.
Data Validation & Update Cycle
Outputs undergo variance checks against independent security-spend trackers; anomalies trigger a second analyst review before sign-off. Our dashboards flag material events, major breaches and pandemic policy shifts, prompting mid-cycle revisions. The full model is refreshed annually, and each report delivery is preceded by a last-mile update to assure currency.
Why Mordor's Visitor Management System Numbers Command Credibility
Published estimates can diverge widely because firms choose different product mixes, pricing bases, and update cadences. We acknowledge these realities upfront and preview them for buyers.
Key gap drivers include some publishers omitting subscription revenues from cloud-first VMS rollouts, others locking exchange rates at study launch, and a few tallying only new licenses rather than renewals. Mordor's scope captures both perpetual and recurring licenses, applies rolling currency averages, and is revisited every twelve months for policy and tech shifts.
Benchmark comparison
| Market Size | Anonymized source | Primary gap driver |
|---|---|---|
| USD 2.13 B (2025) | Mordor Intelligence | - |
| USD 1.87 B (2024) | Global Consultancy A | Narrower scope excludes check-in kiosks and analytics modules |
| USD 1.60 B (2023) | Regional Consultancy B | Uses static security-spend share; no bottom-up validation |
| USD 1.50 B (2024) | Industry Journal C | Omits SaaS renewals and applies outdated exchange rates |
In sum, Mordor's disciplined blend of refreshed scope, dual-track modeling, and multi-layer validation delivers a balanced baseline that decision-makers can trace back to clear variables and repeatable steps.


Key Questions Answered in the Report
What is the current value of the Visitor Management System market?
The market stood at USD 2.39 billion in 2026 and is on track to reach USD 4.22 billion by 2031.
Which segment will add the most revenue between 2026 and 2031?
Cloud deployment is expected to generate the largest absolute gains, expanding at a 17.50% CAGR.
Why are healthcare facilities investing heavily?
Patient-safety protocols and HIPAA rules require verified visitor logs, giving healthcare a 24.90% share in 2025.
How fast are small and medium enterprises adopting these systems?
SMEs are projected to grow at a 16.40% CAGR as low-cost SaaS plans remove capital barriers.
Page last updated on:


