Sweden Container Glass Market Size and Share
Market Overview
| Study Period | 2020 - 2031 |
|---|---|
| Base Year For Estimation | 2025 |
| Forecast Data Period | 2026 - 2031 |
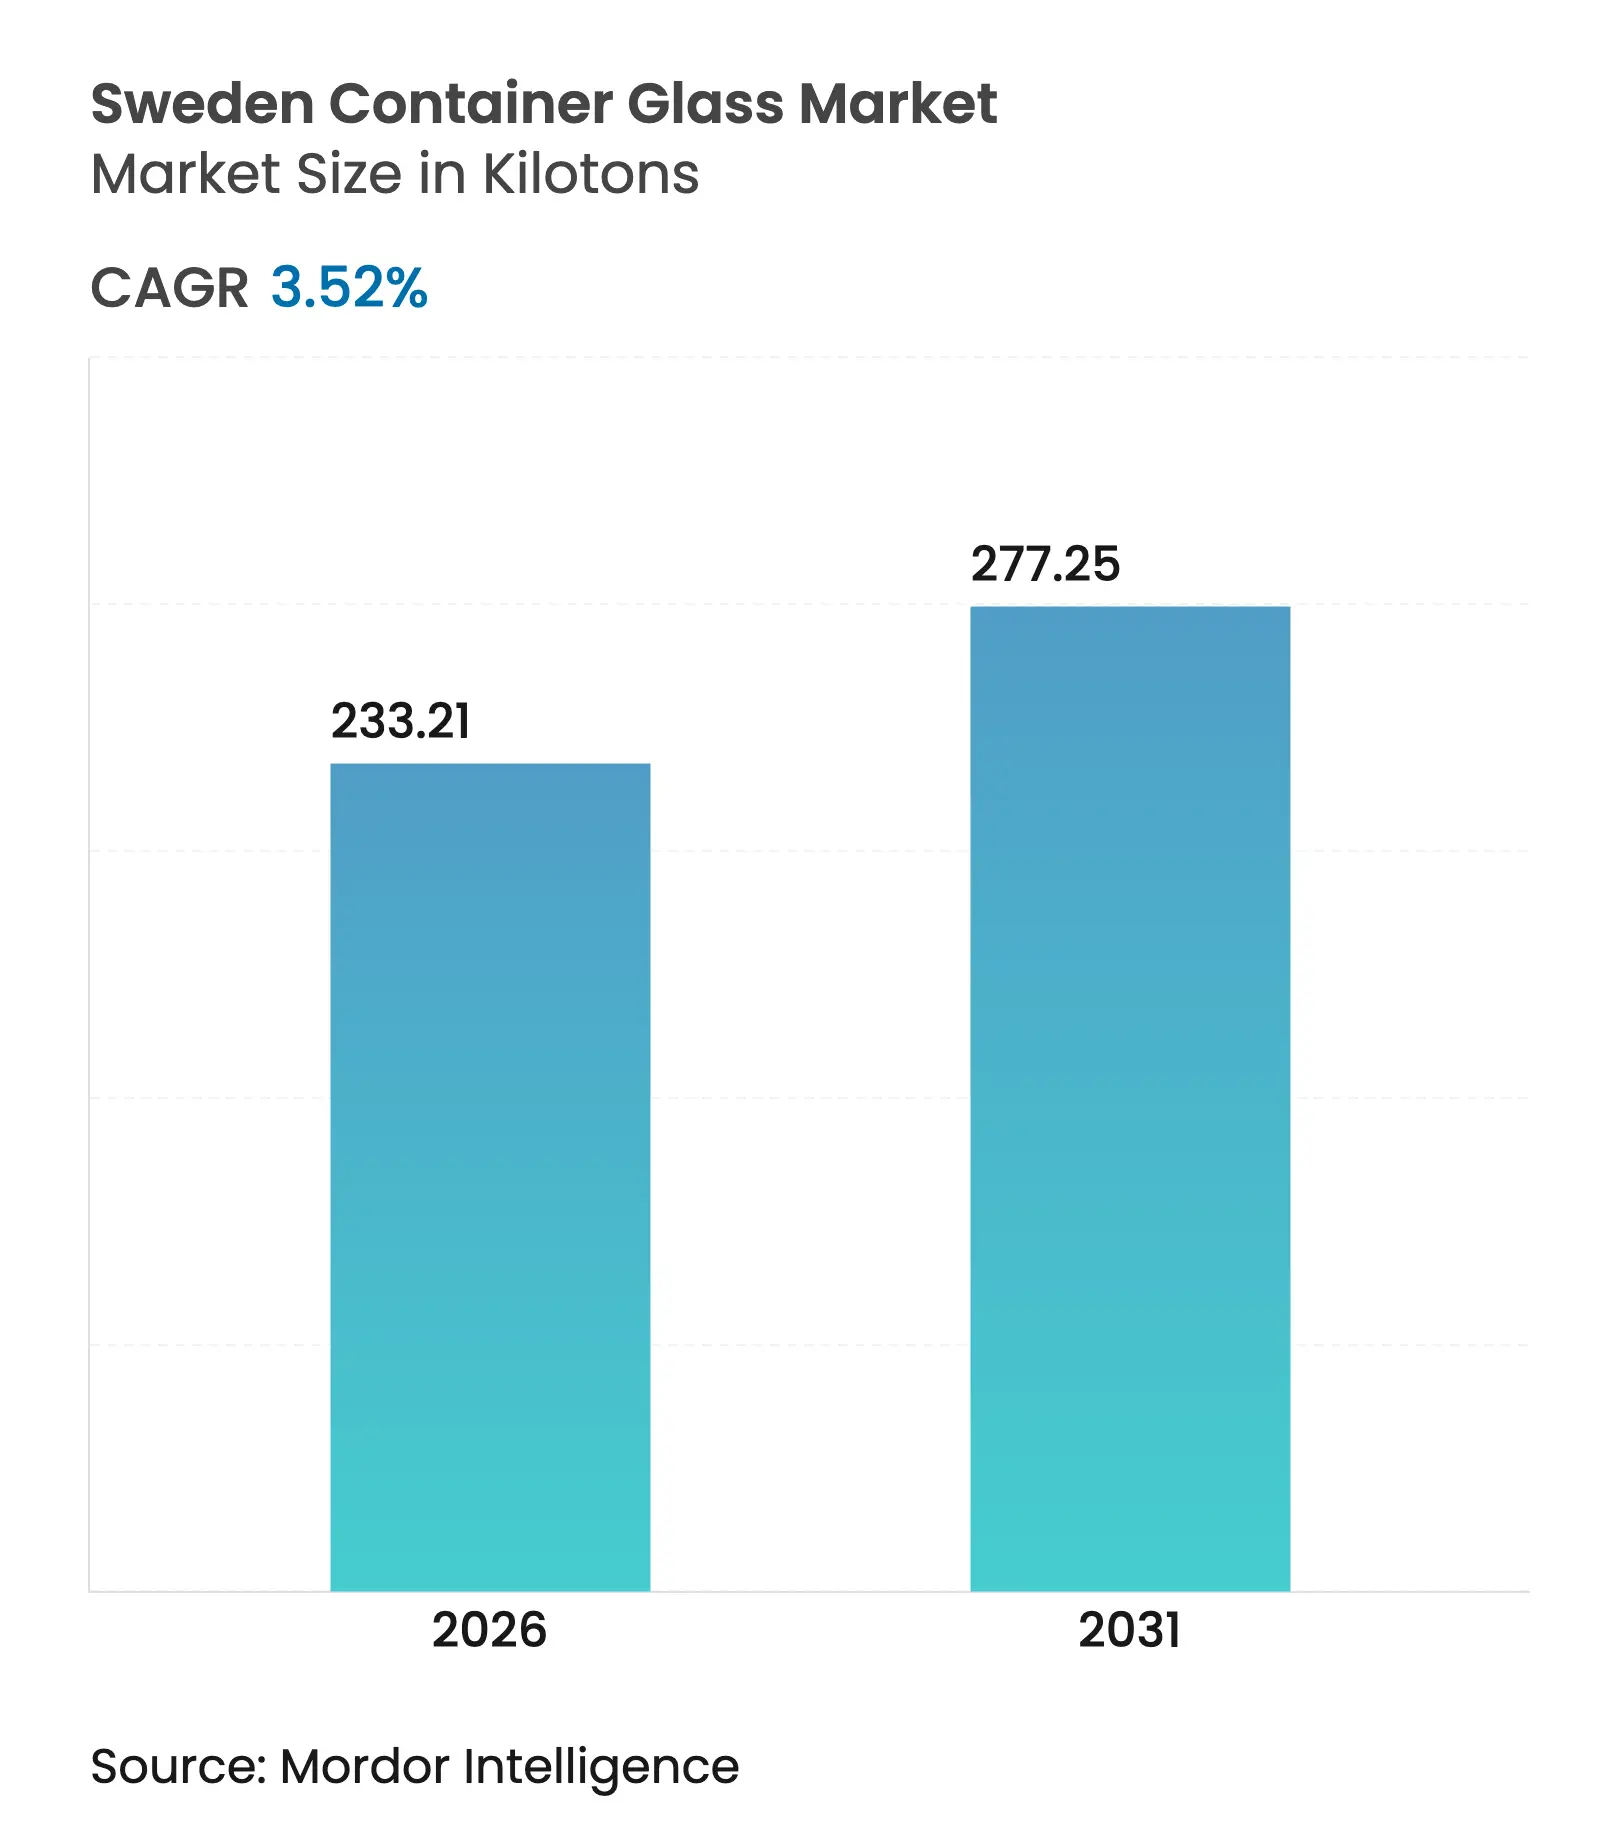
| Market Volume (2026) | 233.21 kilotons |
| Market Volume (2031) | 277.25 kilotons |
| CAGR | 3.52 % |
| Market Concentration | High |
Major Players *Disclaimer: Major Players sorted in no particular order. Image © Mordor Intelligence. Reuse requires attribution under CC BY 4.0. |
Sweden Container Glass Market Analysis by Mordor Intelligence
The Sweden container glass market size was valued at 225.28 kilotons in 2025 and estimated to grow from 233.21 kilotons in 2026 to reach 277.25 kilotons by 2031, at a CAGR of 3.52% during the forecast period (2026-2031). Robust post-consumer cullet availability from Sweden’s 86% glass recycling rate underpins cost-efficient furnace operations, while EU and national policies that penalize single-use plastics continue to channel demand toward glass packaging. Premiumization in beverages and cosmetics, coupled with health-driven preferences for chemically inert materials, further supports steady volume growth. At the same time, electricity price volatility and competition from lightweight PET and aluminum constrain operating margins. Producers are therefore accelerating hybrid furnace investments, active cullet procurement, and lightweight bottle development to defend competitiveness.
Key Report Takeaways
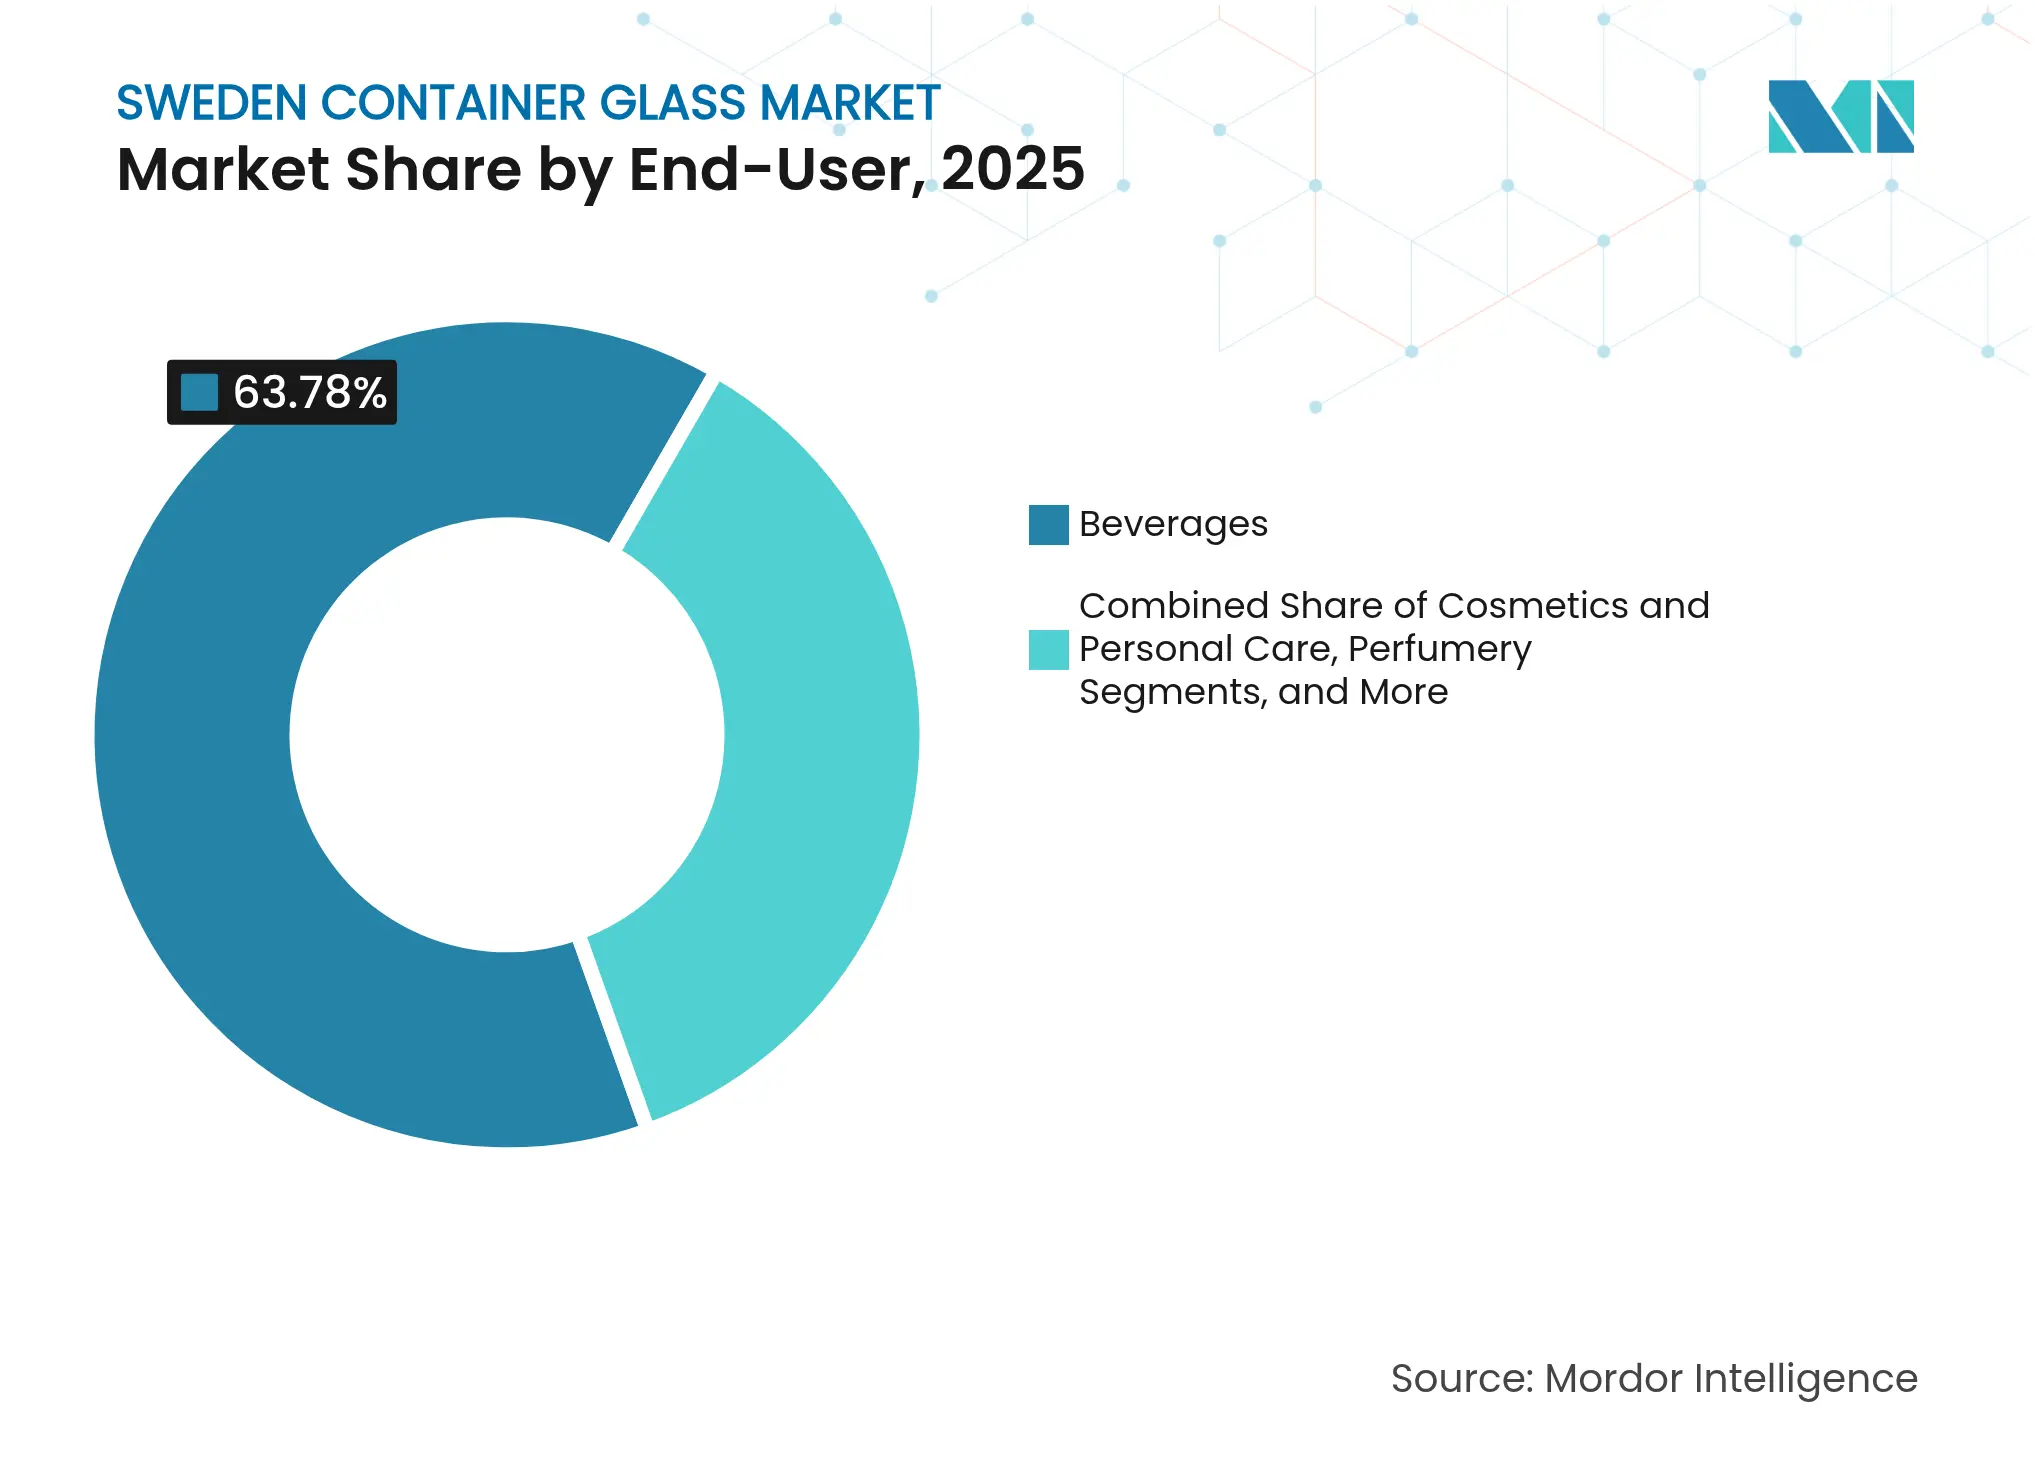
- By end-user, beverages captured 63.78% of the Sweden container glass market share in 2025.
- By color, the Sweden container glass market for amber glass is projected to grow at a 4.55% CAGR between 2026-2031.
Note: Market size and forecast figures in this report are generated using Mordor Intelligence's proprietary estimation framework, updated with the latest available data and insights as of 2026.
Sweden Container Glass Market Trends and Insights
Drivers Impact Analysis
| Driver | (~) % Impact on CAGR Forecast | Geographic Relevance | Impact Timeline | |||
|---|---|---|---|---|---|---|
Strong recycling infrastructure and circular economy policies Strong recycling infrastructure and circular economy policies | +1.2% | National, urban focus | Long term (≥ 4 years) | (~) % Impact on CAGR Forecast:+1.2% | Geographic Relevance:National, urban focus | Impact Timeline:Long term (≥ 4 years) |
Premiumization trends in food and beverage packaging Premiumization trends in food and beverage packaging | +0.8% | Stockholm, Göteborg premium hubs | Medium term (2-4 years) | |||
High consumer preference for sustainable materials High consumer preference for sustainable materials | +0.7% | Metropolitan areas nationwide | Medium term (2-4 years) | |||
Government support for low-carbon manufacturing Government support for low-carbon manufacturing | +0.5% | Industrial regions | Long term (≥ 4 years) | |||
Growing demand in pharmaceuticals and cosmetics Growing demand in pharmaceuticals and cosmetics | +0.4% | Life-sciences clusters | Medium term (2-4 years) | |||
Expansion of organic and artisanal food brands Expansion of organic and artisanal food brands | +0.3% | Premium markets | Medium term (2-4 years) | |||
| Source: Mordor Intelligence | ||||||
Strong Recycling Infrastructure and Circular Economy Policies
Container glass benefits from Sweden’s 5,000-station collection network, which serves 2 million households and supplies cullet sufficient to achieve an 86% recycling rate in 2022. Each 10% rise in cullet lowers furnace energy use by 3% and CO₂ emissions by 5%.[1]SGD Pharma, “Cullet and Energy Savings,” sgd-pharma.com Extended producer responsibility fees that reward high recyclability, combined with an 87.6% beverage container return rate in 2024, reinforce volume security. The forthcoming EU Circular Economy Act is expected to raise secondary raw material targets, positioning Swedish plants to monetize cullet surpluses, while peers in less mature systems face higher virgin material costs.
Premiumization Trends in Food and Beverage Packaging
Life sciences companies with SEK 385 billion (USD 34.6 billion) net sales favor glass for quality signaling and recyclability. Arla Foods designed 95% of its Swedish packaging to be recyclable in 2023, reinforcing supplier demand for glass jars and bottles. Systembolaget’s sustainability procurement rules maintain glass as the default container for premium wine and spirits, despite the growing popularity of Bag-in-Box formats. Reusable, lightweight designs, such as Vetropack’s Echovai bottles, demonstrate how glass can offset transport cost disadvantages while preserving upscale branding.
High Consumer Preference for Sustainable Materials
Nine in ten Swedes cite environmental motives for recycling, and 76% consider sustainability in packaging when making purchase decisions. Single-use plastic reduction targets from the 2022 National Plastic Action Plan further encourage brand owners to adopt glass. Additionally, glass benefits from positive health perceptions; surveys show that consumers associate glass with chemical inertness, particularly for baby food and premium beverages. Urban affluence amplifies this sentiment, encouraging a willingness to pay for glass containers despite higher shelf prices.
Government Support for Low-Carbon Manufacturing
The Industriklivet program finances industrial decarbonization projects that collectively aim to cut 10 million tonnes of CO₂ annually. Grants, soft loans, and test-bed access lower the risk of hybrid-furnace pilots, such as Gerresheimer’s project, which will halve Lohr’s fossil-gas use and abate 25,000 tonnes of CO₂ per year. Policies mandating carbon criteria in public procurement, like Klimatkalkyl, create future demand premiums for low-emission glass.
Restraints Impact Analysis
| Restraint | (~) % Impact on CAGR Forecast | Geographic Relevance | Impact Timeline | |||
|---|---|---|---|---|---|---|
High energy costs for glass melting and forming High energy costs for glass melting and forming | -0.9% | National | Short term (≤ 2 years) | (~) % Impact on CAGR Forecast:-0.9% | Geographic Relevance:National | Impact Timeline:Short term (≤ 2 years) |
Competition from lightweight PET and aluminum Competition from lightweight PET and aluminum | -0.6% | Beverage and food segments | Medium term (2-4 years) | |||
Limited domestic raw material availability Limited domestic raw material availability | -0.3% | Nationwide | Medium term (2-4 years) | |||
Logistics challenges in northern regions Logistics challenges in northern regions | -0.2% | Northern Sweden | Long term (≥ 4 years) | |||
| Source: Mordor Intelligence | ||||||
High Energy Costs for Glass Melting and Forming
Furnace operations consume 1,400-1,600 °C of heat, accounting for 59% of process emissions in terms of energy. Swedish electricity spot prices spiked during winter 2024, trimming Gerresheimer’s Primary Packaging Glass EBITDA by 14.8%. EU ETS Phase IV will abolish free allowances from 2026, exposing fossil-driven furnaces to higher carbon charges. Volatile power pricing encourages hybrid-furnace or full-electric retrofits, yet the capital payback extends beyond near-term budgets, forcing producers to hedge energy or pass costs downstream.
Competition from Lightweight PET and Aluminum
Deposit-return data show 2.8 billion beverage containers were collected in 2024, many of which were PET bottles or aluminum cans. Aluminum cans weigh 60-70% less than glass bottles and currently achieve a 76% recycling rate in Europe. Nordic monopolies have embraced Bag-in-Box, pushing glass share down in table-wine segments. Cans and PET also support e-commerce logistics, challenging glass unless further lightweighting and return-system efficiencies are achieved.
Segment Analysis
By End-User: Beverages Dominate, Cosmetics Accelerate
Beverages captured 63.78% of Sweden container glass market share in 2025 as the deposit-return system secured reverse-logistics loops that protect bottle circulation. Spirits, beer, and wine rely on glass for barrier and premium cues, while deposit hikes to SEK 2 for small drink units are designed to move the system toward a 90% target. The Sweden container glass market size allocated to beverages will remain resilient because health-driven consumers prefer glass over plastic for taste and perceived purity, shielding volumes from lightweight rival formats.
Cosmetics and personal care are the fastest-growing users, advancing at a 4.38% CAGR through 2031. Sweden’s life-sciences clusters anchor R&D-heavy brands that deploy glass jars for upmarket positioning and inertness toward complex formulations. Artisanal skin-care labels in Stockholm and Göteborg adopt colored flasks to differentiate shelf appeal, helping the Sweden container glass market broaden its value mix. Although unit sizes are smaller, high margins and design complexity lift revenue relevance beyond pure tonnage contribution.
Note: Segment shares of all individual segments available upon report purchase
By Color: Flint Prevails, Amber Gains Momentum
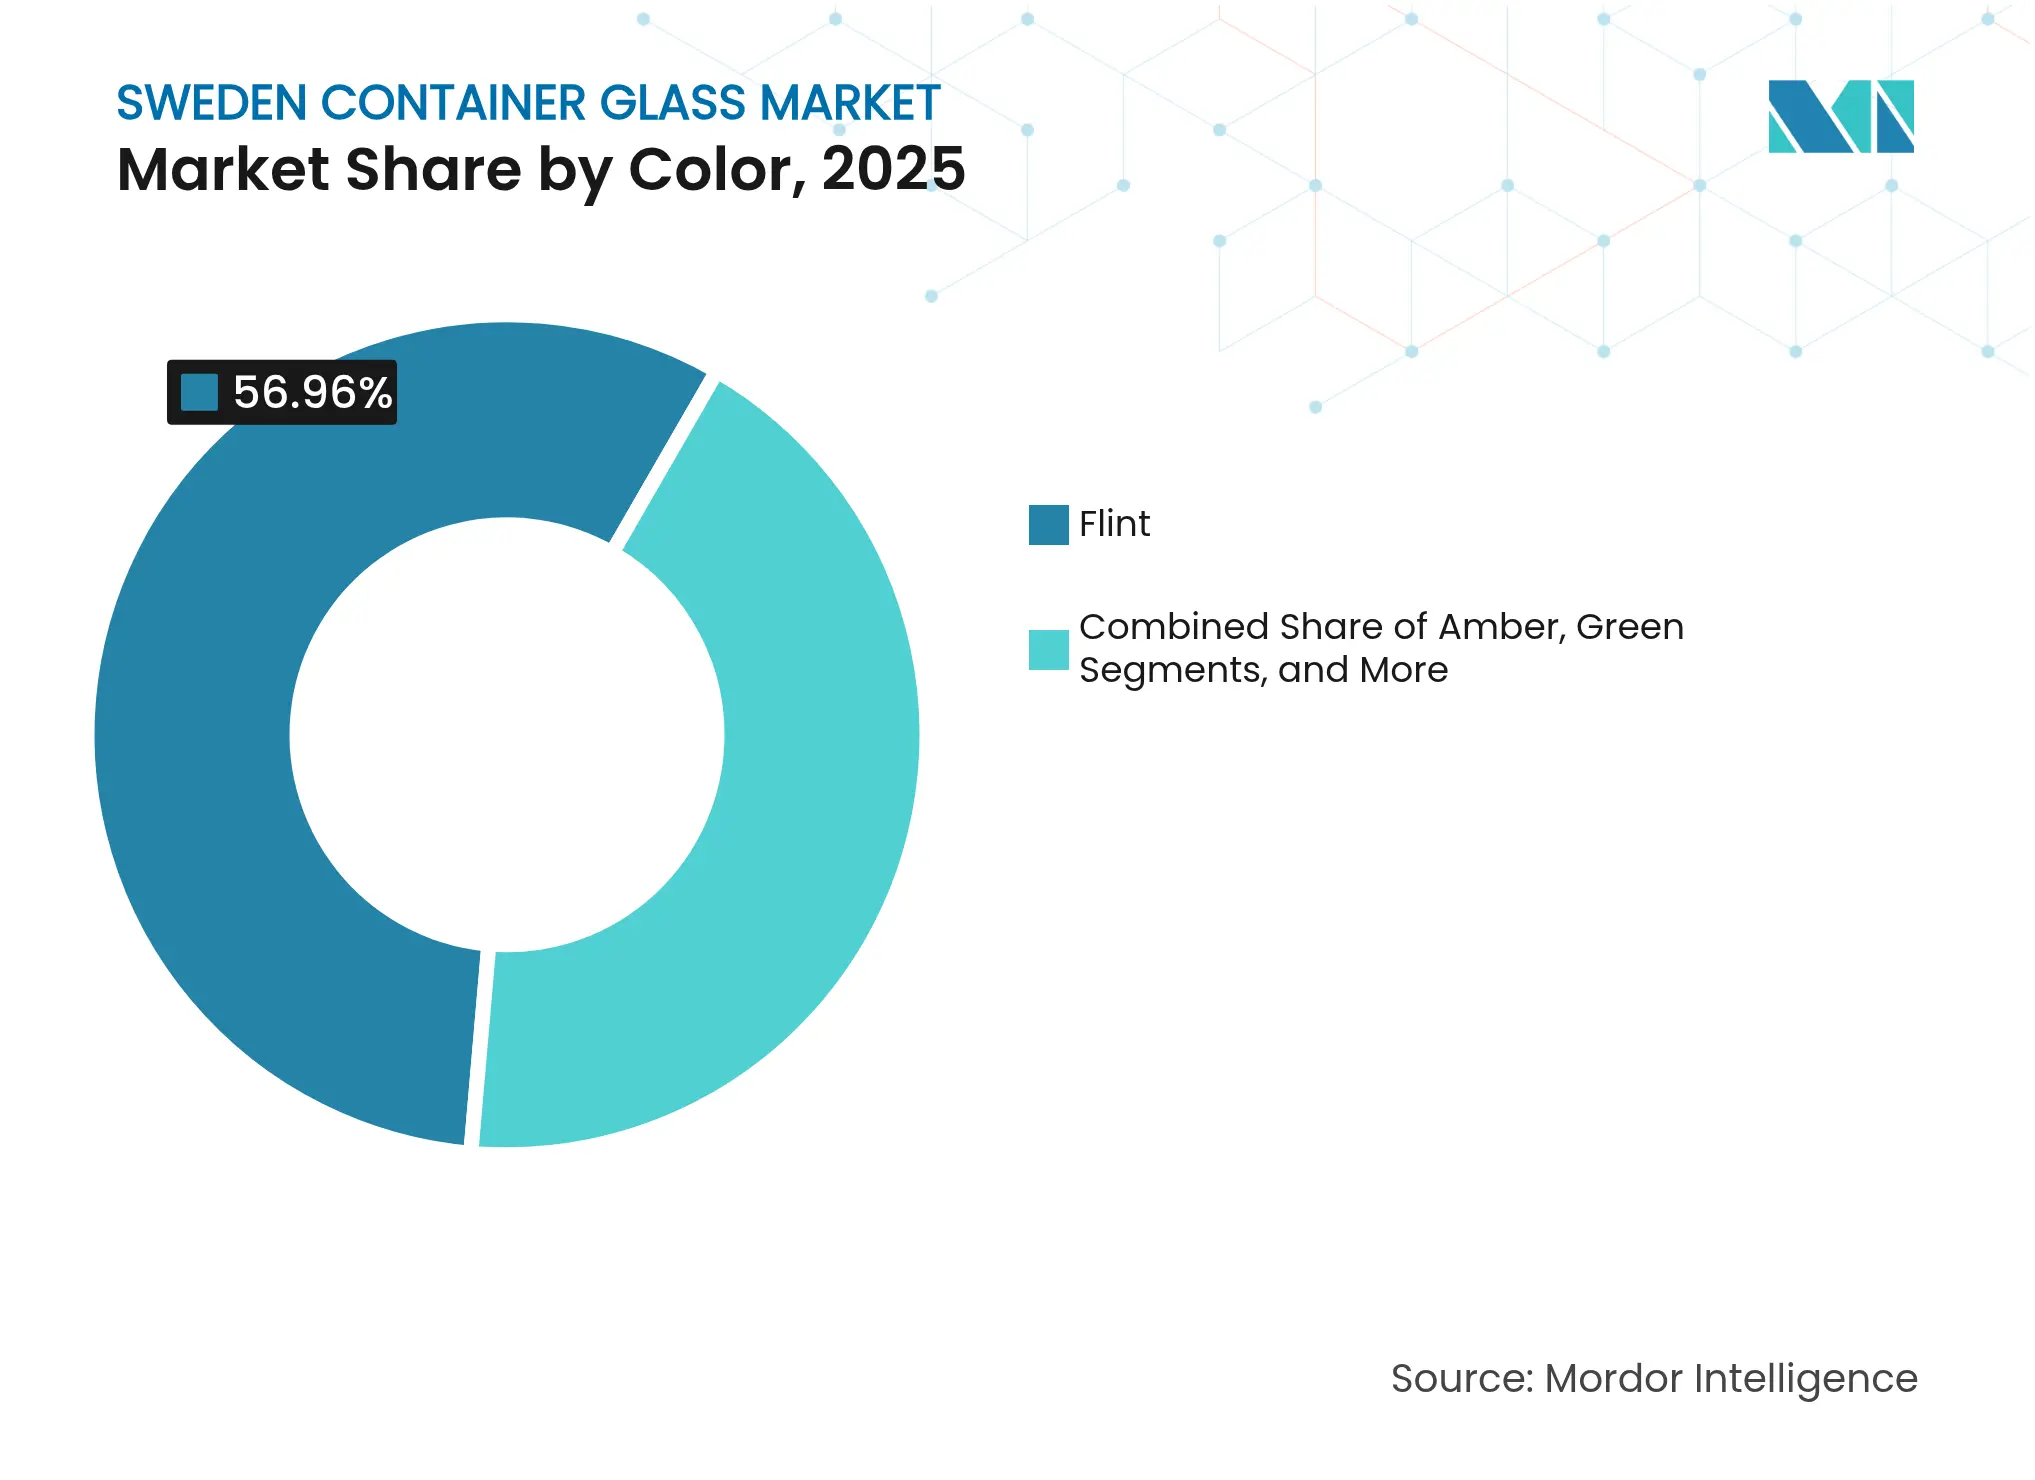
Flint glass held 56.96% of Sweden container glass market share in 2025 due to its versatility for wine, dairy, and condiments, and because transparency aids shelf appeal for premium beverages. The subsector benefits from cullet transparency, making sorting more economical within Sweden’s color-separated collection streams.
Amber glass is forecast to grow at a 4.55% CAGR, driven by pharmaceutical and craft-beverage demand that requires UV protection and a vintage aesthetic. SGD Pharma’s 2 billion-vial capacity includes extensive amber options tailored to photostability standards, signaling a significant upward trend in drug packaging volumes. Lightweight amber beer bottles launched by Ardagh in 2025 weigh 300 g, combining protection with freight efficiency. The Sweden container glass market size devoted to amber thus advances faster than the overall market, while niche greens and custom hues serve boutique spirits and culinary oils.
Note: Segment shares of all individual segments available upon report purchase
Geography Analysis
Southern urban corridors, including Stockholm, Göteborg, and Malmö, absorb the lion’s share of sales, reflecting high GDP per capita, dense retail networks, and hospitality venues that demand branded glass packaging. Cullet recovery efficiency in these cities guarantees a stable recycled feedstock price, supporting the Sweden container glass market’s cost advantage.
Central industrial belts host major filling lines and distribution hubs that feed both domestic shelves and Nordic exports. Access to rail corridors and ferry links to Denmark and Finland positions these areas as glass-bottle transit nodes, reducing landed cost for neighboring markets.
Northern Sweden, though sparsely populated, faces longer last-mile routes and harsher winters that raise distribution costs. Logistics upgrades under Sweden’s green-industrial strategy aim to electrify regional freight, which, over time, could mitigate glass’s weight penalty relative to PET. Meanwhile, glass demand in ski resorts and eco-tourism zones benefits from overt sustainability messaging that resonates with visiting consumers.

Competitive Landscape
Market Concentration
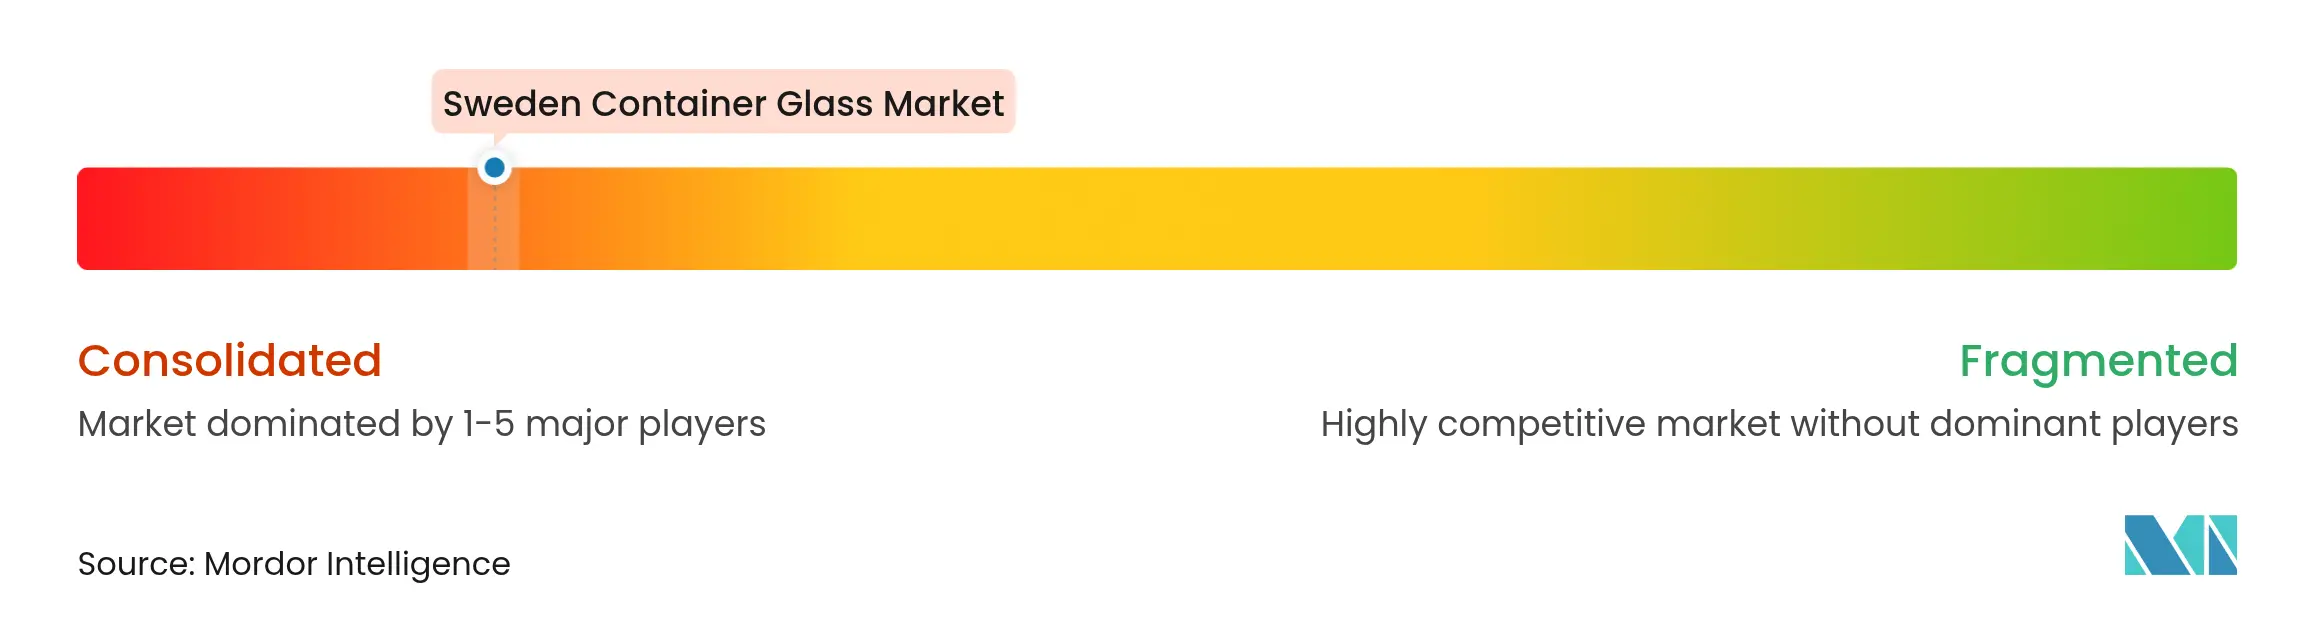
The Sweden container glass market features moderate consolidation as European multinationals operate local furnaces alongside niche Swedish converters. Hybrid-furnace trials are underway to meet net-zero roadmaps. Gerresheimer’s Lohr project will reduce CO₂ emissions by 25,000 tonnes annually, utilizing 50% renewable power.
SGD Pharma tested full-hydrogen burners in 2024, indicating potential fossil-free paths for pharmaceutical vials. Vetropack’s Echovai system delivers tempered reusable bottles that reduce breakage and weight, expanding the circular-use proposition. Ardagh Group’s USD 4.3 billion debt-for-equity swap in July 2025 freed liquidity for lightweighting R&D, highlighting sector-wide pressure to fund decarbonization amid slim margins.[3]Stock Titan, “Ardagh Group Recapitalization,” stocktitan.net
Concurrently, partnerships with recyclers such as CAP Glass secure a steady inflow of cullet, a tactic mirrored by smaller Swedish players who leverage FTI’s collection contracts. Competitive differentiation now hinges on carbon intensity metrics, cullet ratios, and design services more than on sheer furnace scale.
Sweden Container Glass Industry Leaders

*Disclaimer: Major Players sorted in no particular order
Recent Industry Developments
- July 2025: Ardagh Group closed a USD 4.3 billion recapitalization, extending bond maturities to 2030 and injecting USD 1.5 billion of fresh capital.
- July 2025: Ardagh introduced a 300g lightweight wine bottle focused on reducing freight emissions.
- April 2025: Ardagh and CAP Glass partnered to expand recycled-glass capacity in Northern Europe.
- January 2025: Gerresheimer confirmed the hybrid furnace installation at Lohr to halve fossil gas use.
- December 2024: Gerresheimer finalized the acquisition of Bormioli Pharma to broaden its molded-glass offerings.
Table of Contents for Sweden Container Glass Industry Report
1. INTRODUCTION
- 1.1Study Assumptions and Market Definition
- 1.2Scope of the Study
2. RESEARCH METHODOLOGY
3. EXECUTIVE SUMMARY
4. MARKET LANDSCAPE
- 4.1Market Overview
- 4.2Market Drivers
- 4.2.1Strong recycling infrastructure and circular economy policies
- 4.2.2Premiumization trends in food and beverage packaging
- 4.2.3High consumer preference for sustainable materials
- 4.2.4Government support for low-carbon manufacturing
- 4.2.5Growing demand in pharmaceuticals and cosmetics
- 4.2.6Expansion of organic and artisanal food brands
- 4.3Market Restraints
- 4.3.1High energy costs for glass melting and forming
- 4.3.2Competition from lightweight PET and aluminum
- 4.3.3Limited domestic raw material availability
- 4.3.4Logistics challenges in northern regions
- 4.4PESTEL Analysis
- 4.5Industry Supply-Chain Analysis
- 4.6Container Glass Furnace Capacity and Locations in Sweden
- 4.6.1Plant Locations and Year of Commencement
- 4.6.2Production Capacities
- 4.6.3Types of Furnaces
- 4.6.4Color of Glass Produced
- 4.7Export-Import Data of Container Glass - Covering Key Import and Export Destinations
- 4.7.1Import Volume and Value, 2021-2024
- 4.7.2Export Volume and Value, 2021-2024
- 4.8Porter’s Five Forces Analysis
- 4.8.1Threat of New Entrants
- 4.8.2Bargaining Power of Suppliers
- 4.8.3Bargaining Power of Buyers
- 4.8.4Threat of Substitutes
- 4.8.5Competitive Rivalry
- 4.9Raw Material Analysis
- 4.10Recycling Trends for Glass Packaging
- 4.11Demand vs Supply Analysis for Glass Packaging
5. MARKET SIZE AND GROWTH FORECASTS (VOLUME)
- 5.1By End-user
- 5.1.1Beverages
- 5.1.1.1Alcoholic
- 5.1.1.1.1Beer
- 5.1.1.1.2Wine
- 5.1.1.1.3Spirits
- 5.1.1.1.4Other Alcoholic Beverages (Cider and Other Fermented Drinks)
- 5.1.1.2Non-Alcoholic
- 5.1.1.2.1Juices
- 5.1.1.2.2Carbonated Drinks (CSDs)
- 5.1.1.2.3Dairy Product Based Drinks
- 5.1.1.2.4Other Non-Alcoholic Beverages
- 5.1.2Food (Jam, Jelly, Marmalades, Honey, Sausages and Condiments, Oil, Pickles)
- 5.1.3Cosmetics and Personal Care
- 5.1.4Pharmaceuticals (excluding Vials and Ampoules)
- 5.1.5Perfumery
- 5.2By Color
- 5.2.1Green
- 5.2.2Amber
- 5.2.3Flint
- 5.2.4Other Colors
6. COMPETITIVE LANDSCAPE
- 6.1Market Concentration
- 6.2Strategic Moves and Developments
- 6.3Company Market Share Analysis, (Based on Latest Production Capacity)
- 6.4Company Profiles (includes Global level Overview, Market level overview, Core Segments, Financials as available, Strategic Information, Market Rank/Share for key companies, Products and Services, and Recent Developments)
- 6.4.1Blueglass of Sweden AB
- 6.4.2Ardagh Glass Limmared AB
- 6.4.3Stoelzle Glass Group
- 6.4.4SGD Group S.A.S.
- 6.4.5Croxsons AB
- 6.4.6Vetropack Nordic AB
- 6.4.7Gerresheimer Sweden AB
- 6.4.8Verallia Sweden AB
- 6.4.9Saverglass Scandinavia AB
- 6.4.10Gerresheimer Sweden AB
- 6.4.11Labglas AB
7. MARKET OPPORTUNITIES AND FUTURE OUTLOOK
- 7.1White-space and Unmet-Need Assessment
Sweden Container Glass Market Report Scope
Glass containers are vessels made from glass used to store and protect products such as food, beverages, pharmaceuticals, cosmetics, and chemicals. Available in diverse shapes and sizes, such as bottles, jars, and vials, these containers provide airtight seals and protect contents from external contaminants. Glass packaging is valued for its non-reactive nature, preservation of product quality, and high recyclability. These attributes make glass containers a preferred choice for packaging across multiple industries
The Sweden container glass market is segmented by end-user vertical (beverages [alcoholic beverages (beer, wine, spirits, and other alcoholic beverages {cider and other fermented drinks}), non-alcoholic beverages (juices, carbonated drinks (CSDs), dairy product-based drinks, other non-alcoholic beverages)], food [jam, jelly, marmalades, honey, sausages and condiments, oil, pickles], cosmetics and personal care, pharmaceuticals (excluding vials and ampoules), and perfumery, by color (green, amber, flint and other colors). The report offers market forecasts and size in volume (kilotons) for all the above segments.