New Zealand Container Glass Market Size and Share
Market Overview
| Study Period | 2020 - 2031 |
|---|---|
| Base Year For Estimation | 2025 |
| Forecast Data Period | 2026 - 2031 |
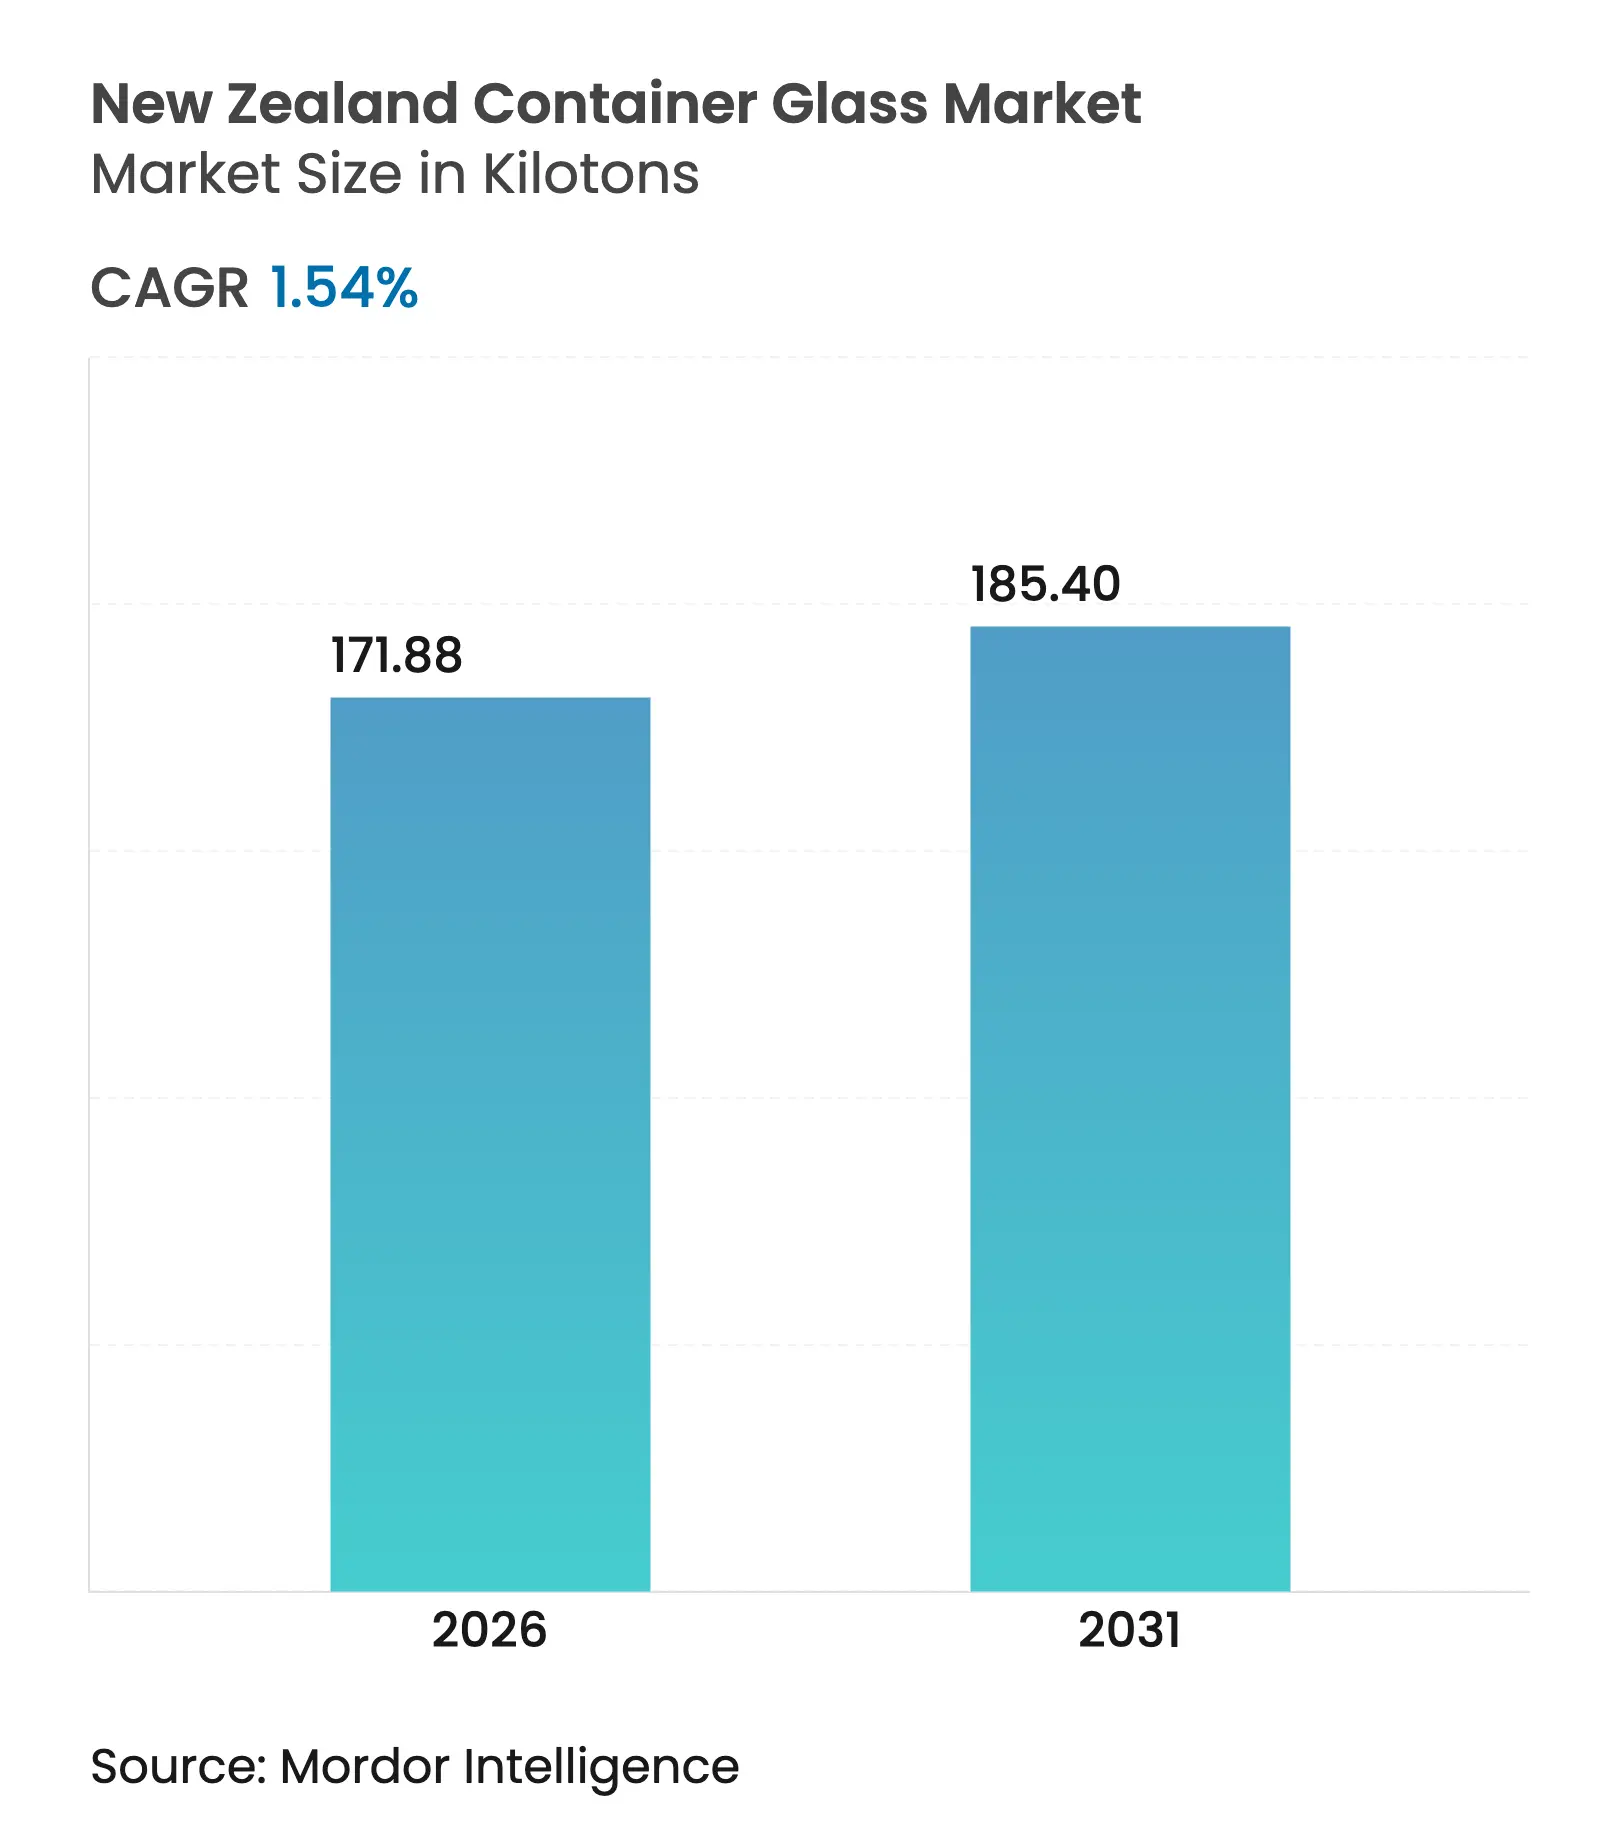
| Market Volume (2026) | 171.88 kilotons |
| Market Volume (2031) | 185.4 kilotons |
| CAGR | 1.54 % |
| Market Concentration | High |
Major Players *Disclaimer: Major Players sorted in no particular order. Image © Mordor Intelligence. Reuse requires attribution under CC BY 4.0. |
New Zealand Container Glass Market Analysis by Mordor Intelligence
The New Zealand container glass market size was valued at 169.27 kilotons in 2025 and estimated to grow from 171.88 kilotons in 2026 to reach 185.4 kilotons by 2031, at a CAGR of 1.54% during the forecast period (2026-2031). The market’s modest expansion reflects a mature domestic base coping with high electricity and freight costs, even as rising recycling rates, plastic-phase-out rules, and export premiumization sustain demand. The growing preference for recyclable packaging among wine, craft beer, and specialty food exporters, combined with Visy’s 70% recycled-content milestone, reinforces glass as the default circular material.[1]VISY, “Industry-leading 70% recycled glass target smashed by manufacturer Visy,” visy.com Policy support, in the form of a national container-return scheme and standardized kerbside collection, augments cullet supply and lowers energy intensity during melting. Although substitution threats from PET and metal persist, the New Zealand container glass market benefits from its insulation against foreign competition through remote-island shipping barriers and strict food-contact rules.
Key Report Takeaways
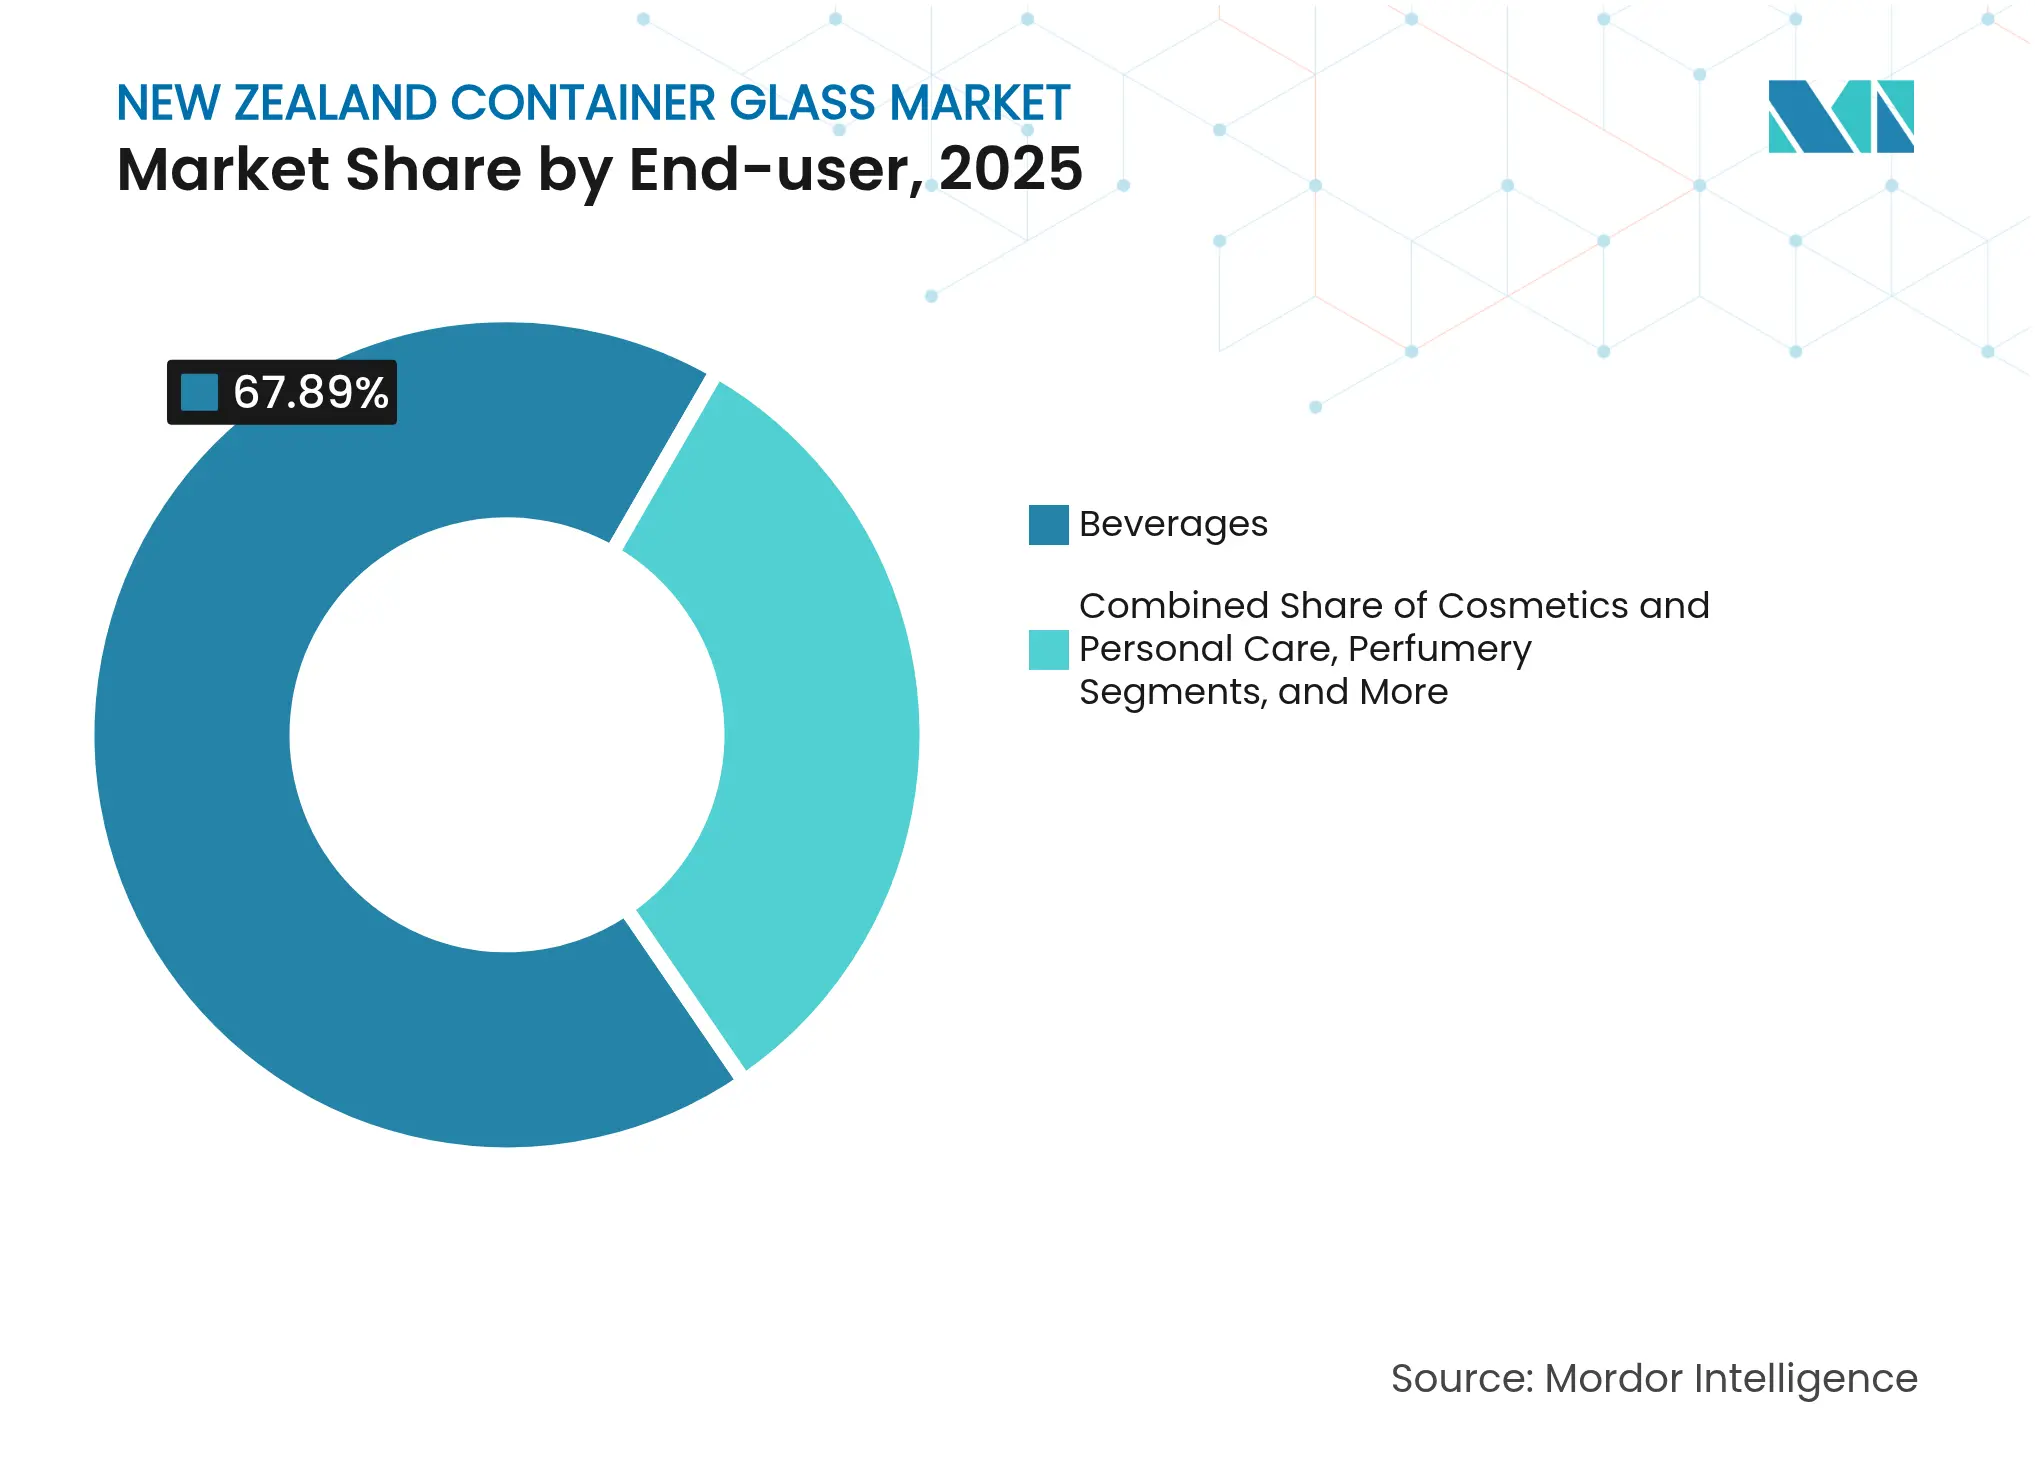
- By end-user, beverages captured 67.89% of the New Zealand container glass market share in 2025.
- By color, the New Zealand container glass market for amber glass is projected to grow at a 2.78% CAGR between 2026-2031.
Note: Market size and forecast figures in this report are generated using Mordor Intelligence's proprietary estimation framework, updated with the latest available data and insights as of 2026.
New Zealand Container Glass Market Trends and Insights
Drivers Impact Analysis
| Driver | (~) % Impact on CAGR Forecast | Geographic Relevance | Impact Timeline | |||
|---|---|---|---|---|---|---|
Rising demand for sustainably-packaged premium food and beverage products Rising demand for sustainably-packaged premium food and beverage products | +0.4% | Auckland, Wellington, Christchurch | Medium term (2-4 years) | (~) % Impact on CAGR Forecast:+0.4% | Geographic Relevance:Auckland, Wellington, Christchurch | Impact Timeline:Medium term (2-4 years) |
Accelerating glass recycling rate and new cullet processing investments Accelerating glass recycling rate and new cullet processing investments | +0.3% | Auckland manufacturing hub | Short term (≤ 2 years) | |||
Government phase-out of hard-to-recycle plastics Government phase-out of hard-to-recycle plastics | +0.5% | Nationwide | Medium term (2-4 years) | |||
Expansion of craft beer and wine exports Expansion of craft beer and wine exports | +0.2% | Marlborough, Central Otago, Hawke’s Bay | Long term (≥ 4 years) | |||
Premium mānuka-honey export packaging requirements Premium mānuka-honey export packaging requirements | +0.1% | North Island | Medium term (2-4 years) | |||
Adoption of QR-coded smart bottles for traceability Adoption of QR-coded smart bottles for traceability | +0.1% | Nationwide | Long term (≥ 4 years) | |||
| Source: Mordor Intelligence | ||||||
Rising demand for sustainably-packaged premium food and beverage products
Consumer preference for circular materials elevates the New Zealand container glass market as brands seek credible sustainability credentials for export buyers. The country’s 71% recycling rate positions glass ahead of competing substrates for premium positioning, prompting beverage, honey, and specialty-food producers to lock in long-term supply contracts. These buyers value glass’s inertness, shelf-life benefits, and ability to showcase product quality, supporting price premiums that counterbalance slow tonnage growth. Domestic producers capitalize on the trend to secure better margins and insulate themselves from fluctuations in commodity prices. Growing interest in refillable and returnable schemes further solidifies glass's position in premium categories, reinforcing brand storytelling around provenance and circularity. The driver, therefore, translates more into value than volume, yet still adds incremental kilotons that underpin the forecast CAGR.
Accelerating glass recycling rate and new cullet processing investments
Visy’s upgrade to oxygen-fueled furnaces and cullet pre-heating reduces energy consumption by 30%, equivalent to heating 32,000 homes annually. Higher recycled content reduces dependence on imported soda ash and offers meaningful carbon reductions, as demanded by export markets. Government-funded kerbside harmonization boosts collection volumes, closing the loop between households and the Auckland furnace. Improved cullet quality lowers melting temperatures, mitigating exposure to volatile wholesale electricity prices. These efficiencies enable Visy to maintain local production viability, retain employment, and defer the need for imported finished bottles. As the cullet supply chain matures, further gains in recycled content are expected, reinforcing circular economy objectives and mitigating market volatility resulting from raw material cost spikes.
Government phase-out of hard-to-recycle plastics
The Waste Minimization Regulations 2025 extend plastic bans on trays, PVC, and polystyrene, driving brand owners to pre-empt regulatory deadlines by switching to glass.[2]New Zealand Legislation, “Waste Minimisation (Plastic and Related Products) Amendment Regulations 2025,” legislation.govt.nz The predictable policy roadmap enables manufacturers to invest in tooling for new jars and bottle formats without fear of stranded assets. Compliance requirements across key export destinations amplify the domestic ban’s influence, as overseas retailers increasingly screen suppliers on recyclability scores. For food-contact categories, glass meets stringent migration and barrier standards, making the substitution straightforward from a regulatory standpoint. While the transition imposes re-engineering costs, it ultimately expands the addressable demand for the New Zealand container glass market through the introduction of incremental SKUs that were formerly packed in banned plastics.
Expansion of craft beer and wine exports
Despite a rise in bulk wine shipments, premium wineries and breweries rely on bottle aesthetics to protect their brand equity abroad. Packaged wine exports totaled 134.6 million liters in 2025, underpinning sustained flint and green bottle demand. Craft brewers partner with reuse platform Again Again for returnable flagons, integrating QR codes that track container turns and appeal to eco-conscious consumers. Regional producers in Marlborough and Central Otago commission distinctive embossing and specialty colors to signal provenance on-shelf, widening the product mix for Visy. The export-oriented beverage cluster, therefore, fuels both baseline volume and premium-tier innovation within the New Zealand container glass market, supporting steady long-term growth.
Restraints Impact Analysis
| Restraint | (~) % Impact on CAGR Forecast | Geographic Relevance | Impact Timeline | |||
|---|---|---|---|---|---|---|
Availability of substitute materials (PET, metal, paper) Availability of substitute materials (PET, metal, paper) | -0.3% | Urban centers | Short term (≤ 2 years) | (~) % Impact on CAGR Forecast:-0.3% | Geographic Relevance:Urban centers | Impact Timeline:Short term (≤ 2 years) |
High energy cost for glass melting in NZ High energy cost for glass melting in NZ | -0.4% | Manufacturing sites | Short term (≤ 2 years) | |||
Limited domestic silica-sand supply; import dependence Limited domestic silica-sand supply; import dependence | -0.2% | Nationwide | Medium term (2-4 years) | |||
Remote-island freight costs eroding export competitiveness Remote-island freight costs eroding export competitiveness | -0.3% | Export-focused segments | Medium term (2-4 years) | |||
| Source: Mordor Intelligence | ||||||
Availability of substitute materials (PET, metal, paper)
Sophisticated, lightweight PET bottles, aluminum cans, and barrier paper systems have eroded the share of glass in price-sensitive lines such as ginger beer and table wine. Record Aluminum’s USD 100 million can plant, scheduled for 2026, will localize metal packaging supply, lowering lead times and shipping costs. Wine producers are piloting flat, recycled-PET bottles for e-commerce channels, where weight savings reduce freight emissions. Life-cycle analyses cited by Nordic retailers show these formats generate less than half the carbon footprint of a traditional 750 ml glass bottle, pressuring brand owners to diversify packaging. Although premium tiers still favor glass, rapid improvements in alternative substrates are restraining the growth prospects of the New Zealand container glass market in mainstream SKUs.
High energy cost for glass melting in NZ
Wholesale electricity prices climbed 230% year-on-year in 2024 as gas shortages tightened supply. Glass melting requires furnace temperatures exceeding 1,500 °C, making Visy’s Auckland plant exceptionally vulnerable. Some industrial peers have reduced shifts or imported finished containers rather than bear peak-price exposures. While Visy’s oxygen-fuel switch has lifted energy efficiency by a third, variable spot prices still erode margins and deter capacity expansion. Energy hedging contracts provide partial relief but cannot fully offset systemic supply constraints that the Ministry of Business, Innovation and Employment expects to persist for at least three years. The restraint has the highest negative impact on the forecast CAGR, underscoring the sector’s dependence on affordable baseload power.
Segment Analysis
By End-user: Beverages Dominate Despite Diversification
The beverages segment accounted for 67.89 % of the New Zealand container glass market share in 2025, translating into 114.93 kilotons of demand. Premium wine and craft beer lines rely on flint and green bottles to protect delicate flavor profiles and convey artisanal branding in export channels. Visy’s annual output exceeds 700 million containers, with approximately three-quarters of these used for alcoholic beverages. While bulk wine shipments exceed packaged volumes, boutique wineries continue to favor bottles for cellar-door and high-end retail sales, thereby sustaining domestic glass demand. Non-alcoholic beverages, including kombucha and natural fruit juices, are expected to add stable incremental volume as wellness trends continue to accelerate.
The cosmetics and personal-care category is the fastest-growing, expanding at a 2.63% CAGR through 2031, driven by eco-luxury skincare launches that require premium jars and droppers. Local brands view glass as a differentiator in online channels, where unboxing aesthetics influence repeat purchases. Food applications, including mānuka honey, jams, and condiments, maintain mid-single-digit growth, drawing vigor from provenance marketing and regulatory bans on composite plastic lids. Pharmaceutical usage remains a small yet resilient niche centered on over-the-counter syrups and nutraceuticals. Collectively, these non-beverage lines diversify risk and offer value-added margin opportunities that buttress the New Zealand container glass market.
Note: Segment shares of all individual segments available upon report purchase
By Color: Flint Leads While Amber Accelerates
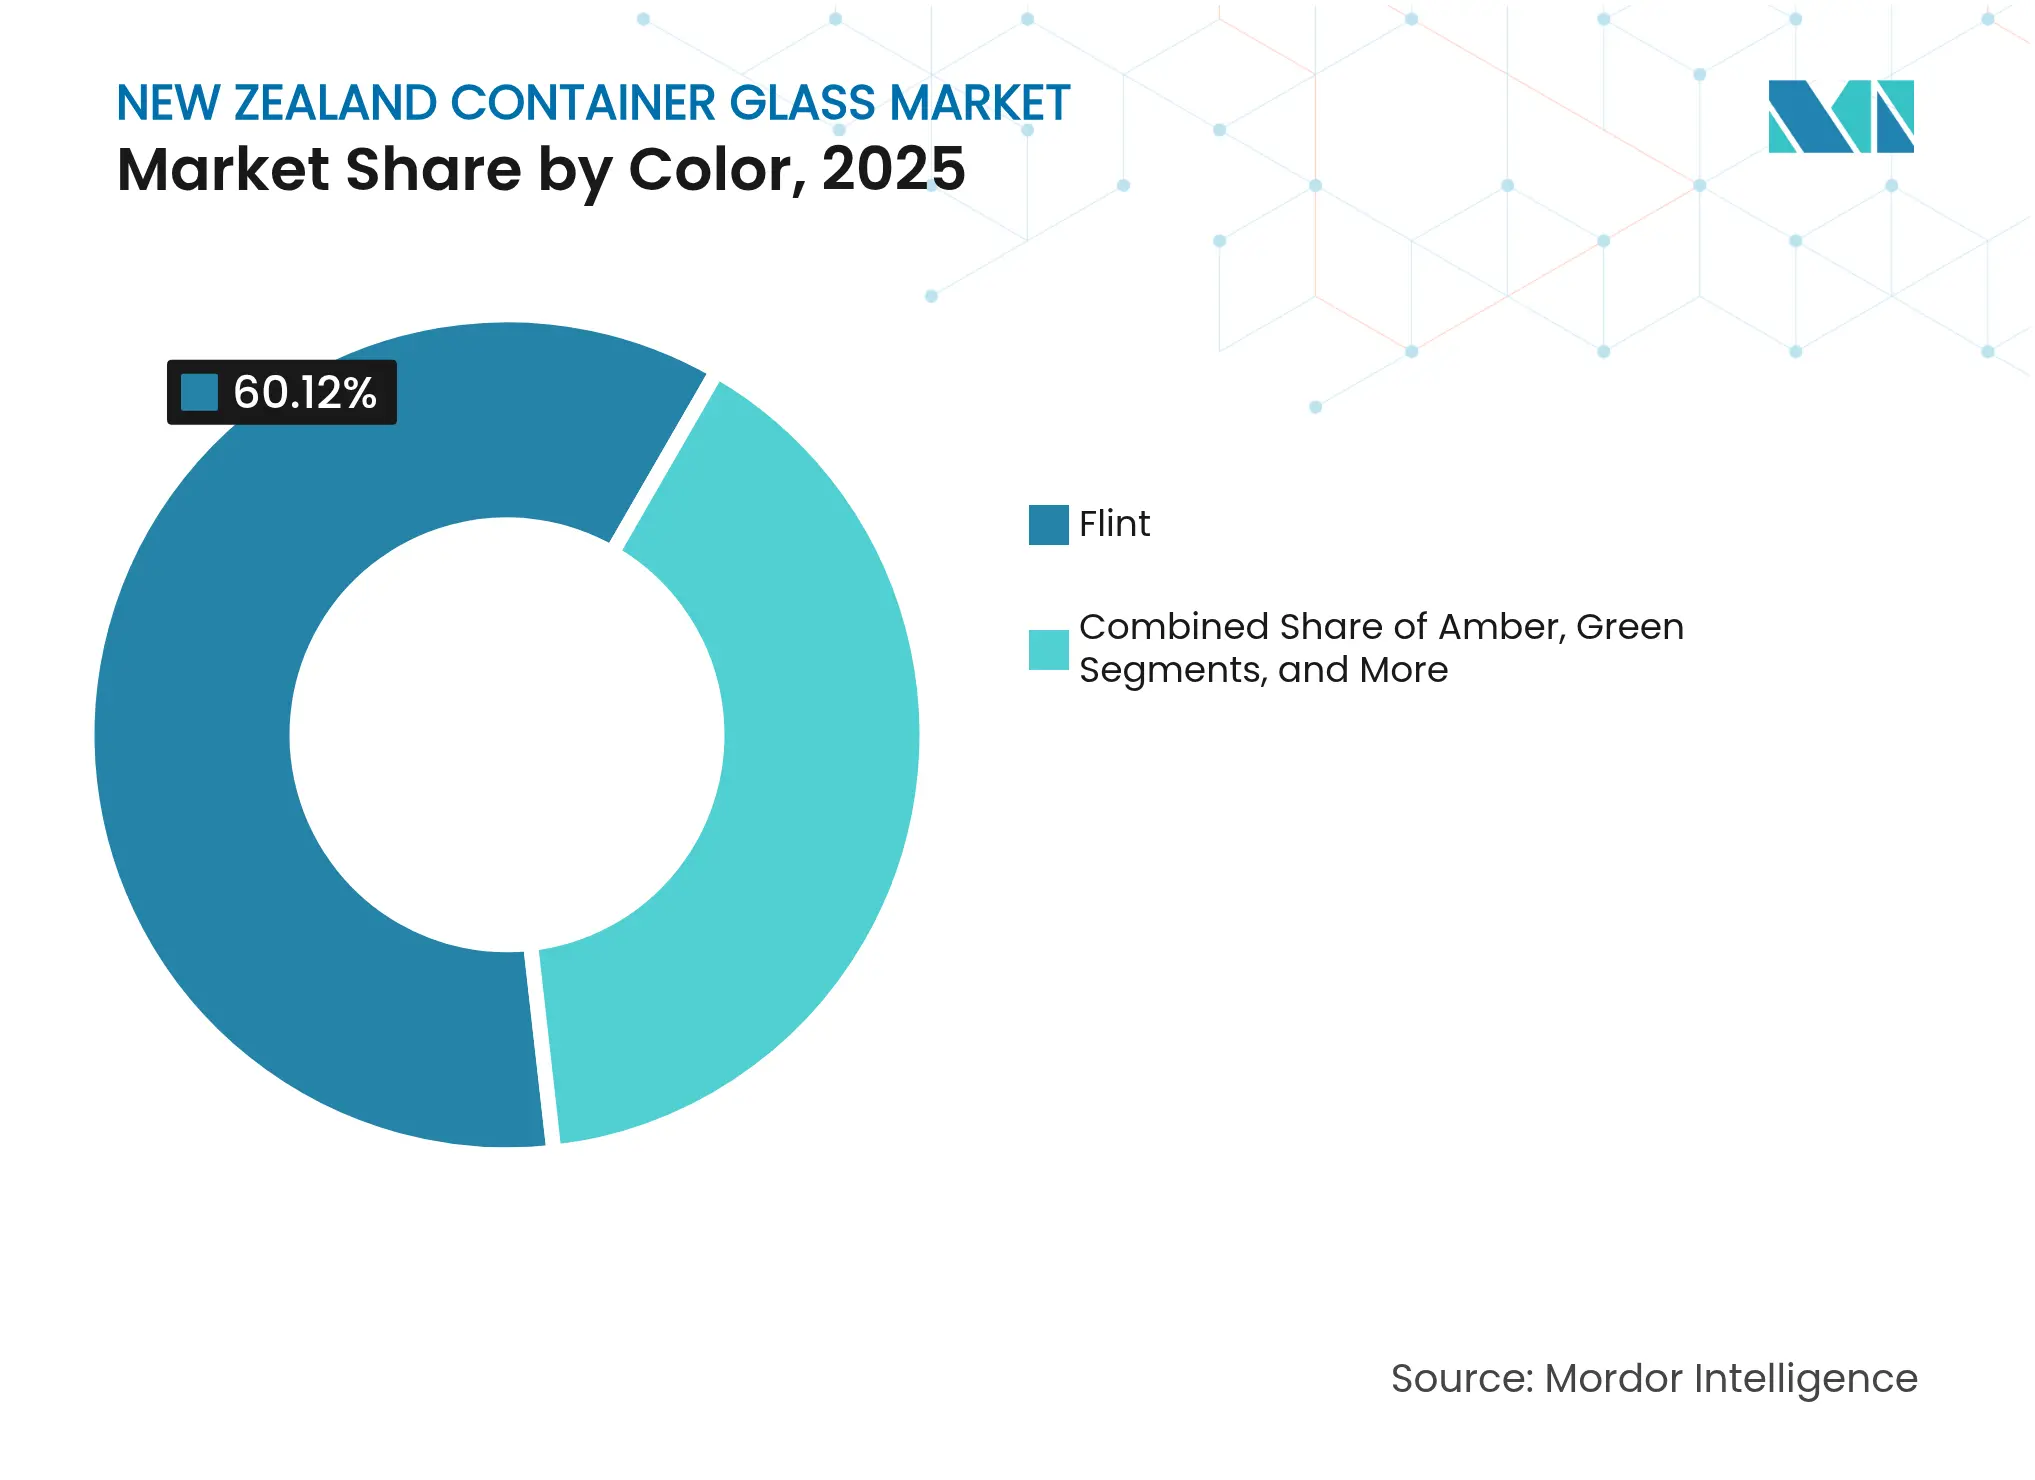
Flint bottles accounted for 60.12% of the New Zealand container glass market size in 2025, equivalent to approximately 101.78 kilotons. Transparent glass enables wineries and honey producers to showcase color clarity, a trait associated with perceived purity and quality. Energy-efficient flint furnaces and high cullet input reduce emissions, providing manufacturers with a sustainability talking point to relay downstream. Green glass retains a loyal wine following as heritage labels remain committed to traditional bottle palettes despite environmental scrutiny.
Amber glass is projected to grow at a 2.78% CAGR, driven by its superior UV-blocking properties, which extend shelf life for light-sensitive pharmaceuticals and specialty oils. Native fragrance houses have migrated to custom amber flacons that reinforce natural brand cues and attract international buyers. Visy reports that colored batches achieve recycled-content averages of 75%, occasionally reaching the 90% mark, thanks to lower color-matching constraints. Though representing a smaller base, Amber’s faster trajectory indicates an evolving mix toward function-led color choice within the New Zealand container glass market.
Note: Segment shares of all individual segments available upon report purchase
Geography Analysis
Auckland hosts the country’s sole furnace, supplying both North and South Islands via an integrated rail-and-road network that minimizes double handling. Concentration enhances energy-recovery economics but exposes the supply chain to single-site risk in the event of unplanned outages. The port of Auckland funnels most import sand and export bottles, while secondary volumes move through Tauranga and Napier to serve wine clusters in Hawke’s Bay. Rail upgrades funded under the government’s sustainable freight plan slash inland costs for heavy cullet shipments, further reinforcing closed-loop logistics.
South Island demand centers on Marlborough and Central Otago, where wine estates require bespoke bottle molds to convey terroir stories overseas. Bottles often travel northbound empty and return southbound filled, optimizing back-haul rates. Remote distribution to west-coast tourism hubs remains truck-reliant, adding notable freight premiums that can nudge small producers toward alternative packaging. Nevertheless, the regional councils’ high glass recovery rates, exceeding 80% in Nelson, sustain cullet flows back to Auckland and improve supply certainty for the furnace.
Internationally, New Zealand’s export geography hinges on Australian transshipment. Disruption at Brisbane or Sydney triggers ripple effects across cold-chain schedules for bottled wine. Diversion to North Asian direct services reduces dwell times but incurs higher freight. To hedge, exporters increasingly hold safety stocks in bonded Australian warehouses, altering shipping splits yet keeping production domestic. Geography therefore shapes the operational resilience and cost competitiveness of the New Zealand container glass market without fundamentally undermining forecast growth.

Competitive Landscape
Market Concentration
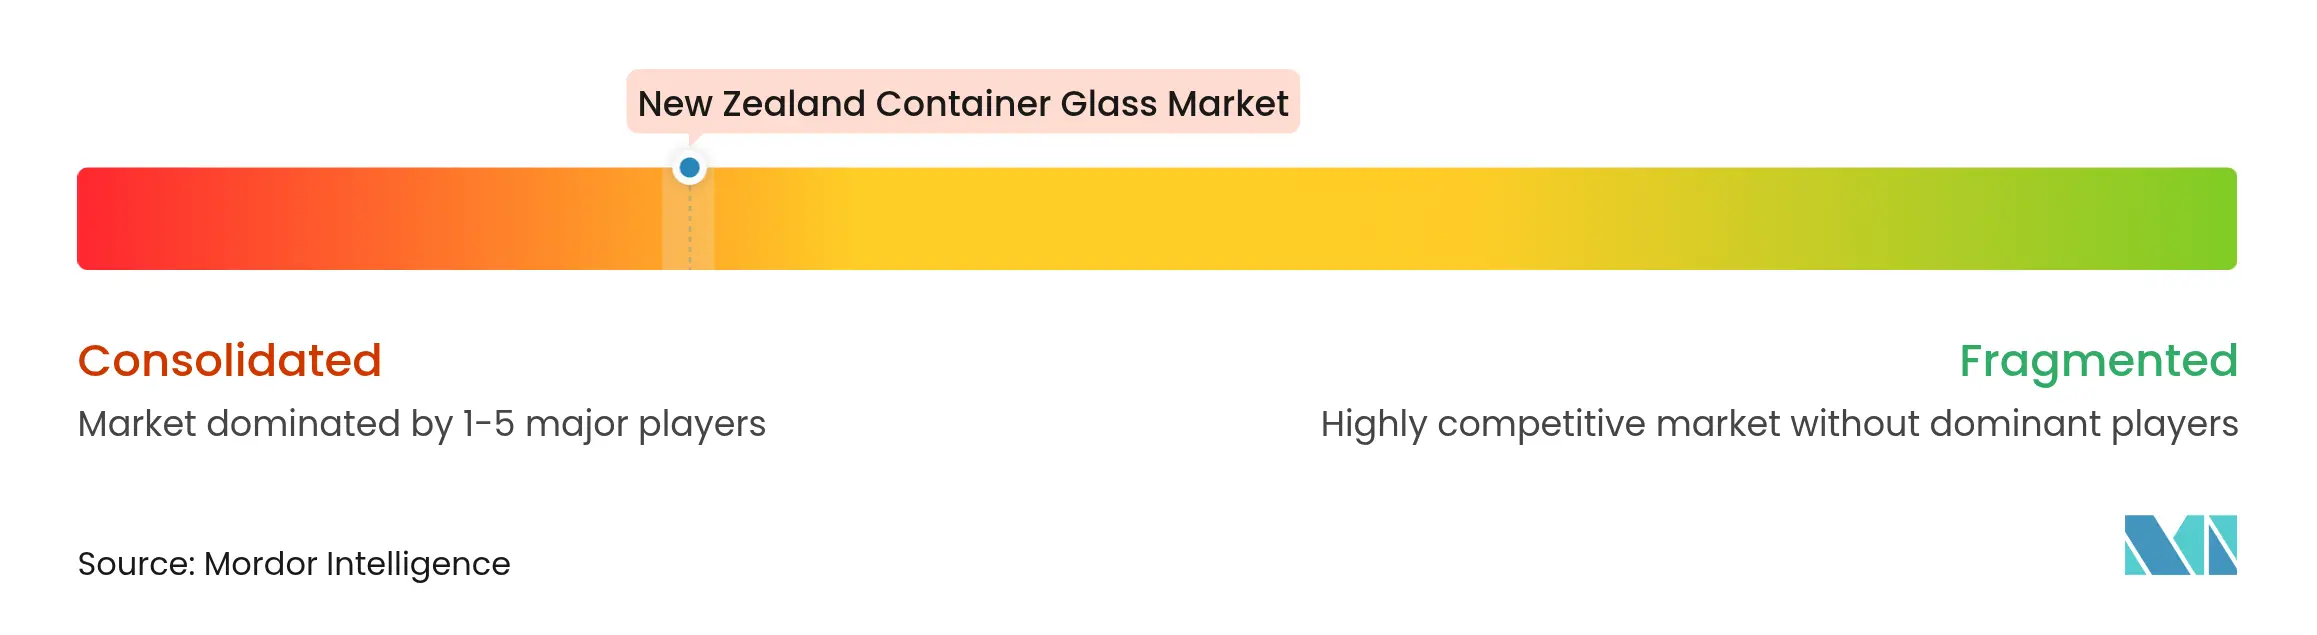
Visy’s monopoly over domestic melting confers formidable scale in procurement, furnace utilization, and sustainability investments. Achieving 70% recycled content positions the company ahead of its global network and solidifies its reputation as a leader in circular packaging. The firm allocates capital to digital furnace controls and lightweighting R&D that trim resource inputs while preserving bottle integrity. Yet, monopoly status also heightens systemic risk; any prolonged outage could force reliance on imports at elevated freight rates.
Distributor consolidation is reshaping the premium import tier. TricorBraun’s acquisition of UniquePak in 2024 and Plasdene Glass-Pak’s purchase of Wainhouse in 2025 expand design libraries and improve just-in-time availability for niche SKUs.[3]TricorBraun, “TricorBraun acquires UniquePak and Alplas Products,” tricorbraun.com These players target high-margin spirits, pharmaceuticals, and luxury cosmetics that domestic mass furnaces cannot efficiently service. Saverglass and Stoelzle supply ultra-premium decanters, exploiting gaps in Visy’s range. While import share remains modest, heightened service levels and product breadth provide credible alternatives that temper Visy’s pricing power.
Strategic emphasis across all participants converges on sustainability. Visy’s optical-sorting upgrades and 200,000-tonne cullet plant expansion underpin local glass recycling goals. The Glass Packaging Forum coordinates industry funding for collection infrastructure, ensuring financial responsibility is shared across brand owners. Concurrently, technology vendors pilot blockchain traceability for refillable flagons, blending circularity with consumer engagement. Competitive differentiation thus pivots less on furnace count and more on decarbonization pathways and supply-chain transparency within the New Zealand container glass market.
New Zealand Container Glass Industry Leaders

*Disclaimer: Major Players sorted in no particular order
Recent Industry Developments
- April 2025: Plasdene Glass-Pak acquired Auckland-based Wainhouse Glass Packaging, creating Plasdene Glass-Pak NZ and enlarging rigid-packaging supply across food, beverage and pharmaceutical lines.
- April 2025: Visy has reached an average 70% recycled-glass content milestone in its New Zealand operations, marking the first in its global network to achieve this benchmark.
- May 2024: TricorBraun completed the acquisition of UniquePak and Alplas Products, deepening premium glass-packaging distribution capabilities across Australia and New Zealand.
- February 2024: Visy finished a AUD 50 million glass-recycling facility upgrade at Laverton, doubling processing capacity to 200,000 tonnes annually.
Table of Contents for New Zealand Container Glass Industry Report
1. INTRODUCTION
- 1.1Study Assumptions and Market Definition
- 1.2Scope of the Study
2. RESEARCH METHODOLOGY
3. EXECUTIVE SUMMARY
4. MARKET LANDSCAPE
- 4.1Market Overview
- 4.2Market Drivers
- 4.2.1Rising demand for sustainably-packaged premium food and beverage products
- 4.2.2Accelerating glass recycling rate and new cullet processing investments
- 4.2.3Government phase-out of hard-to-recycle plastics
- 4.2.4Expansion of craft beer and wine exports
- 4.2.5Premium mānuka-honey export packaging requirements
- 4.2.6Adoption of QR-coded smart bottles for traceability
- 4.3Market Restraints
- 4.3.1Availability of substitute materials (PET, metal, paper)
- 4.3.2High energy cost for glass melting in NZ
- 4.3.3Limited domestic silica-sand supply; import dependence
- 4.3.4Remote-island freight costs eroding export competitiveness
- 4.4PESTEL Analysis
- 4.5Industry Supply-Chain Analysis
- 4.6Container Glass Furnace Capacity and Locations in New Zealand
- 4.6.1Plant Locations and Year of Commencement
- 4.6.2Production Capacities
- 4.6.3Types of Furnaces
- 4.6.4Color of Glass Produced
- 4.7Export-Import Data of Container Glass - Covering Key Import and Export Destinations
- 4.7.1Import Volume and Value, 2021-2024
- 4.7.2Export Volume and Value, 2021-2024
- 4.8Porter’s Five Forces Analysis
- 4.8.1Threat of New Entrants
- 4.8.2Bargaining Power of Suppliers
- 4.8.3Bargaining Power of Buyers
- 4.8.4Threat of Substitutes
- 4.8.5Competitive Rivalry
- 4.9Raw Material Analysis
- 4.10Recycling Trends for Glass Packaging
- 4.11Demand vs Supply Analysis for Glass Packaging
5. MARKET SIZE AND GROWTH FORECASTS (VOLUME)
- 5.1By End-user
- 5.1.1Beverages
- 5.1.1.1Alcoholic
- 5.1.1.1.1Beer
- 5.1.1.1.2Wine
- 5.1.1.1.3Spirits
- 5.1.1.1.4Other Alcoholic Beverages (Cider and Other Fermented Drinks)
- 5.1.1.2Non-Alcoholic
- 5.1.1.2.1Juices
- 5.1.1.2.2Carbonated Drinks (CSDs)
- 5.1.1.2.3Dairy Product Based Drinks
- 5.1.1.2.4Other Non-Alcoholic Beverages
- 5.1.2Food (Jam, Jelly, Marmalades, Honey, Sausages and Condiments, Oil, Pickles)
- 5.1.3Cosmetics and Personal Care
- 5.1.4Pharmaceuticals (excluding Vials and Ampoules)
- 5.1.5Perfumery
- 5.2By Color
- 5.2.1Green
- 5.2.2Amber
- 5.2.3Flint
- 5.2.4Other Colors
6. COMPETITIVE LANDSCAPE
- 6.1Market Concentration
- 6.2Strategic Moves and Developments
- 6.3Company Market Share Analysis, (Based on Latest Production Capacity)
- 6.4Company Profiles (includes Global level Overview, Market level overview, Core Segments, Financials as available, Strategic Information, Market Rank/Share for key companies, Products and Services, and Recent Developments)
- 6.4.1Visy Glass Ltd
- 6.4.2Saverglass Nz Ltd
- 6.4.3Cpack Ltd
- 6.4.4Cospak Ltd
- 6.4.5TricorBraun Inc
- 6.4.6Feemio Group Co., Ltd
- 6.4.7Chandler Glass & Packaging
7. MARKET OPPORTUNITIES AND FUTURE OUTLOOK
- 7.1White-space and Unmet-Need Assessment
New Zealand Container Glass Market Report Scope
Container glass is designed for crafting glass containers, including bottles, jars, drinkware, and bowls. Its key attributes include chemical inertness, sterility, and non-permeability, rendering it especially sought after in the beverage, food, pharmaceutical, and cosmetic sectors. The research also examines underlying growth influencers and significant industry vendors, all of which help to support market estimates and growth rates throughout the anticipated period. The market estimates and projections are based on the base year factors and arrived at top-down and bottom-up approaches.
New Zealand container glass market is segmented by end-user vertical (beverages [alcoholic beverages (beer, wine, spirits, and other alcoholic beverages {cider and other fermented drinks}), non-alcoholic beverages (juices, carbonated drinks (CSDs), dairy product-based drinks, other non-alcoholic beverages)], food [jam, jelly, marmalades, honey, sausages and condiments, oil, pickles], cosmetics and personal care, pharmaceuticals (excluding vials and ampoules), and perfumery), by color (green, amber, flint and other colors). The report offers market forecasts and size in volume (kilotons) for all the above segments.