
Swarm Intelligence Market Size and Share
Market Overview
| Study Period | 2020 - 2031 |
|---|---|
| Market Size (2026) | USD 107.34 Billion |
| Market Size (2031) | USD 466.83 Billion |
| Growth Rate (2026 - 2031) | 34.18 % |
| Fastest Growing Market | Asia Pacific |
| Largest Market | North America |
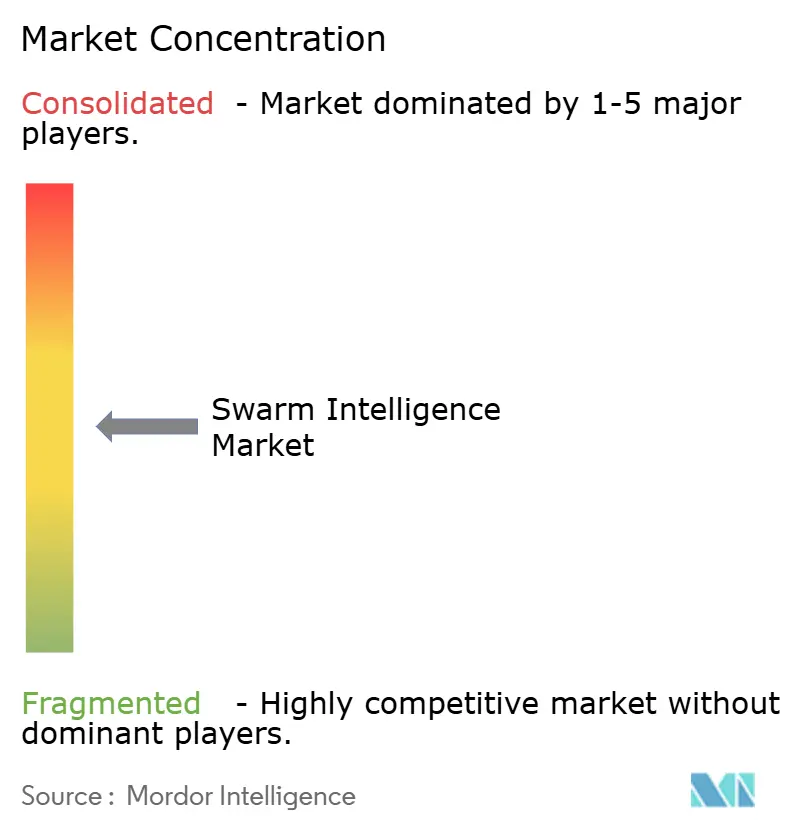
| Market Concentration | Medium |
Major Players *Disclaimer: Major Players sorted in no particular order Image © Mordor Intelligence. Reuse requires attribution under CC BY 4.0. | |
Swarm Intelligence Market Analysis by Mordor Intelligence
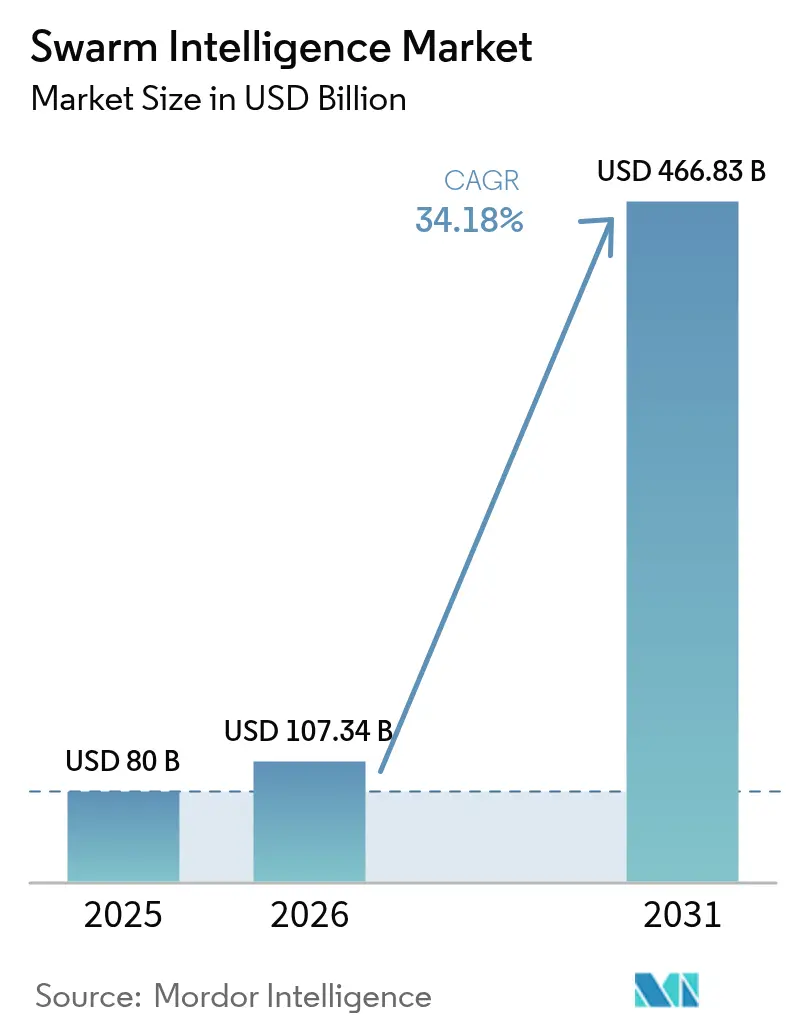
The Swarm Intelligence Market size was valued at USD 80 million in 2025 and estimated to grow from USD 107.34 million in 2026 to reach USD 466.83 million by 2031, at a CAGR of 34.18% during the forecast period (2026-2031).
Real-time coordination, enabled by neuromorphic edge chips that converge bio-inspired algorithms with low-latency computing, and the rising demand for distributed decision-making architectures underpin this growth. Transportation and logistics automation, defense UAV swarms, and smart-city pilot projects are among the key early commercial traction areas, while sustained venture funding for bio-inspired processors lowers adoption barriers. Competitive differentiation shifts toward flexible platforms that can support multiple algorithm families, accommodate heterogeneous robotic fleets, and meet stringent data-sovereignty requirements. Intensifying hardware constraints in the silicon supply chain and shortages of cross-disciplinary talent temper the otherwise strong outlook for the swarm intelligence market.
Key Report Takeaways
- By end-user industry, transportation and logistics held 27.68% of the swarm intelligence market share in 2025, while smart cities and mobility exhibit the fastest 39.28% CAGR through 2031.
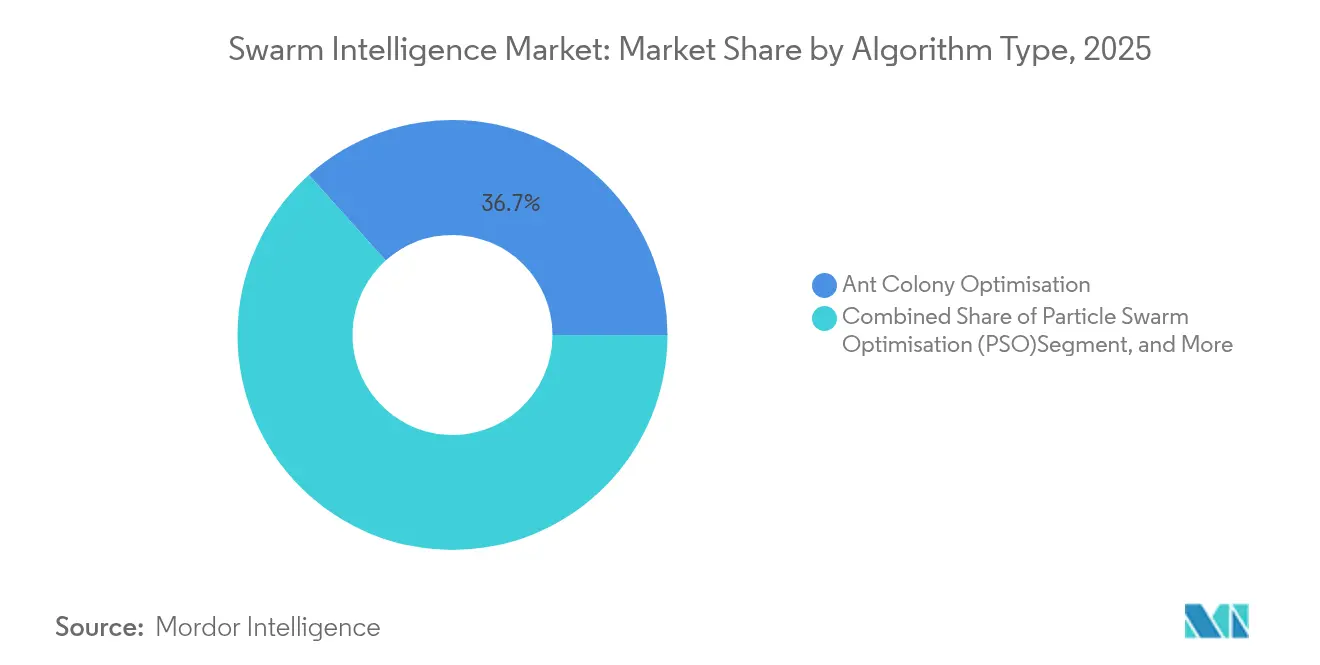
- By algorithm type, ant colony optimisation captured 36.65% share of the swarm intelligence market size in 2025; bee colony algorithms are projected to expand at a 34.75% CAGR to 2031.
- By platform type, UAV swarms led with a 37.65% share of the swarm intelligence market in 2025, whereas unmanned underwater vehicles posted the highest 35.64% CAGR through 2031.
- By deployment mode, edge/on-device architectures commanded 45.55% share of the swarm intelligence market in 2025, and hybrid modes are poised for a 34.92% CAGR over the forecast period.
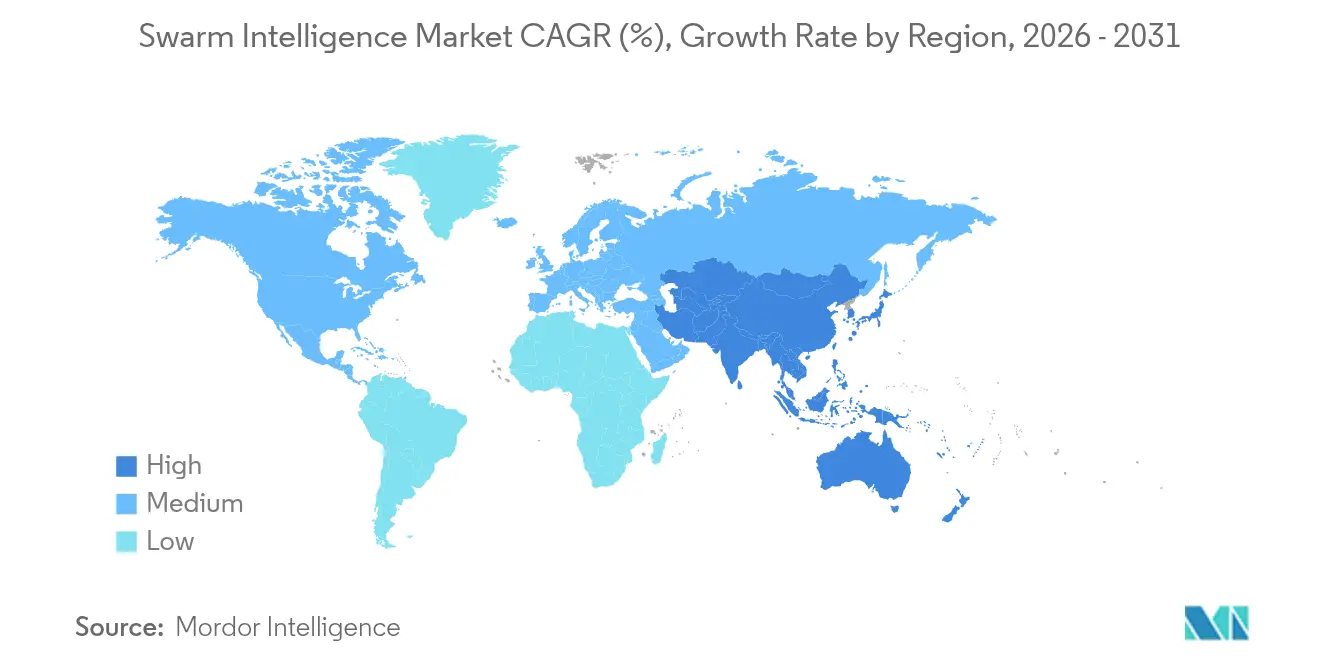
- By geography, North America contributed 33.72% share of the swarm intelligence market in 2025; Asia Pacific advances quickest at a 35.90% CAGR to 2031.
Note: Market size and forecast figures in this report are generated using Mordor Intelligence’s proprietary estimation framework, updated with the latest available data and insights as of 2026.
Market Trends and Insights
Drivers Impact Analysis of Swarm Intelligence Market*
| Driver | (~) % Impact on CAGR Forecast | Geographic Relevance | Impact Timeline |
|---|---|---|---|
| Rising adoption of swarm robotics in logistics and warehouses | +8.2% | North America and Europe concentrated, global influence | Medium term (2-4 years) |
| Deployment of UAV swarms for defense and disaster response | +7.5% | North America and Asia Pacific core, spill-over to MEA | Short term (≤2 years) |
| Decentralised optimisation for big-data IoT networks | +6.8% | Global with early smart-city adoption | Long term (≥4 years) |
| Collaborative AI platforms for large-scale decision-making | +4.3% | North America and EU leading, Asia Pacific scaling | Medium term (2-4 years) |
| Venture funding for bio-inspired edge-AI chips | +5.1% | Silicon Valley and European tech hubs core | Short term (≤2 years) |
| APAC BVLOS drone-swarm regulatory green-lights | +4.4% | Asia Pacific core, global demonstration effects | Short term (≤2 years) |
| Source: Mordor Intelligence | |||
Rising adoption of swarm robotics in logistics and warehouse automation
Warehouse operators gain up to 40% cost savings versus single-agent systems when multi-robot swarms handle dynamic routing. Experiments at MIT achieved 4 × faster task completion and cut operator workload by 50.9%, confirming throughput gains that mitigate acute labour shortages.[1]MIT News, “Warehouse robots learn teamwork,” mit.eduGermany-based Cellumation’s Celluveyor moves 5,200 parcels per hour with self-organising hexagonal cells, validating modular, easily scalable swarm conveyor designs. As fulfillment volumes keep rising, these economic incentives accelerate deployments across global logistics hubs. Edge-based coordination further eliminates the latency bottlenecks typical of cloud-centric control, strengthening the business case for the swarm intelligence market.
Growing deployment of UAV swarms for defense surveillance and disaster response
Military programmes such as the Czech-origin Interceptor autonomous kinetic drone illustrate how coordinated swarms neutralise hostile aerial targets under contested bandwidth. Disaster-relief research at the University of São Paulo shows drone collectives spotting wildfires and greenhouse-gas leaks faster than satellites while maintaining operations during communication blackouts. Government procurement drives edge-AI advances that later migrate into civil inspection and emergency-response use cases, broadening the addressable swarm intelligence market.
Demand for decentralised optimisation in big-data IoT networks
With billions of endpoints sending telemetry, centralised orchestration strains under compute and latency loads. Luleå University of Technology demonstrated collaborative robots that navigate deep-mine tunnels without GPS, underscoring the value of swarm heuristics in constrained IoT fields.[2]Luleå University of Technology, “Autonomous drones in mining environments,” ltu.se Smart-city pilots employ aerial swarms to monitor traffic, emissions, and waste, diverting resources autonomously as conditions change. As distributed intelligence proves scalable, adoption widens across utilities, telecoms, and urban-services operators seeking resilient network performance.
Collaborative AI platforms for large-scale brainstorming and decision-making
Conversational Swarm Intelligence tools at Carnegie Mellon University outperformed standard group chats; more than 80% of participants reported higher engagement and productivity. Financial multi-agent systems leveraging swarm learning exceeded benchmark trading models in cumulative returns while lowering volatility. Healthcare pilot studies protect patient privacy by processing diagnostic insights across distributed nodes. Together, these results reinforce enterprise interest in collective-intelligence platforms that remove hierarchical bottlenecks.
Restraints Impact Analysis of Swarm Intelligence Market*
| Restraint | (~) % Impact on CAGR Forecast | Geographic Relevance | Impact Timeline |
|---|---|---|---|
| Shortage of cross-disciplinary swarm-algorithm engineers | -4.8% | North America and Europe most acute | Long term (≥4 years) |
| Communication latency and reliability limitations | -3.2% | Global, amplified in remote settings | Medium term (2-4 years) |
| Algorithmic-liability concerns in autonomous trading | -2.1% | North America and EU regulatory zones | Medium term (2-4 years) |
| Silicon supply constraints on neuromorphic edge nodes | -2.9% | Global, pronounced in Asia-Pacific foundries | Short term (≤2 years) |
| Source: Mordor Intelligence | |||
Shortage of cross-disciplinary swarm-algorithm engineers
Global supply of professionals fluent in biology, robotics, and distributed systems lags demand. Academic analysis in SAGE Open notes curricula seldom combine these domains, creating capability gaps for employers. Salary premiums that exceed 40% over conventional robotics roles still fail to close vacancies, leaving start-ups at a disadvantage against cash-rich incumbents. The talent constraint slows prototype-to-production cycles and limits scale-out speed in the swarm intelligence industry.
Communication latency and reliability limits on real-time coordination
Swarm control deteriorates once round-trip latency tops 250-300 milliseconds, according to peer-reviewed Sensors experiments.[3]MDPI Sensors, “Latency thresholds in swarm control,” mdpi.com Achord-network testing confirms intermittent links demand adaptive routing and error-correcting protocols, elevating system complexity.[4]arXiv, “ACHORD network for swarms,” arxiv.org Ground clutter, metallic obstructions, and multi-path fading in urban canyons challenge drone fleets, while underwater acoustic channels further reduce bandwidth. Although 5G and edge caching alleviate some pressure, physics-imposed signal delays persist as a structural cap on real-time swarm performance.
*Our forecasts treat driver/restraint impacts as directional, not additive. The impact forecasts reflect baseline growth, mix effects, and variable interactions.
Swarm Intelligence Market Segment Analysis
By Algorithm Type:
Application-specific optimisation steers adoptionAnt colony optimisation retained the largest 36.65% share of the swarm intelligence market in 2025 as its probabilistic path-finding fits vehicle routing and warehouse picking needs. Bee colony methods are set for a 34.75% CAGR to 2031 because their decentralised resource allocation suits dynamic smart-city services. Particle swarm optimisation gains traction in financial services where model training achieved 98% accuracy for cryptocurrency price prediction. Hybrid frameworks now switch algorithms in real time to match context, as Texas A&M researchers showed in adaptive agricultural robots. This pivot toward configurable stacks broadens supplier opportunities while deepening software differentiation.
Growing experimentation with firefly, glow-worm, bacterial foraging, and artificial fish heuristics targets niche grids, sensor coverage, or energy-harvest optimisation. Early quantum-accelerated swarm prototypes promise exponential search-space pruning, hinting at disruptive future gains once hardware matures. As adopters pursue outcome-specific metrics rather than general benchmarks, vendors capable of integrating multi-algorithm libraries capture a larger slice of the swarm intelligence market.



By End-user Industry:
Logistics scale meets smart-city momentumTransportation and logistics held 27.68% share of the swarm intelligence market in 2025 due to immediate paybacks in parcel throughput and last-mile routing. Urban-mobility schemes, including coordinated eVTOL taxis and adaptive traffic grids, propel a 39.28% CAGR in smart-city adoption. Defense programmes remain pivotal for funding leading-edge swarm research that later transitions to civil infrastructure inspection. Health-care pilots apply distributed learning for diagnostics while safeguarding sensitive data. Agriculture and mining deploy ruggedised ground and aerial swarms in hazardous zones, raising worker safety and asset utilisation. Retail fulfilment centres extend use cases beyond conveyance to inventory auditing, and utilities employ cooperative agents for grid load-balancing, attesting to the cross-sector depth of the swarm intelligence market.
By Platform Type:
UAV still dominant but underwater systems surgeUAV collectives represented 37.65% of the swarm intelligence market in 2025, buoyed by regulatory approvals for beyond visual-line-of-sight operations. Unmanned underwater vehicles track the fastest 35.64% CAGR as offshore energy, telecom cable inspection, and marine-biology surveys require coordinated subsurface autonomy. Ground robot swarms automate ore extraction and industrial inspection where GPS is absent. Autonomous surface vessels patrol coastlines and monitor environmental conditions. Software-only multi-agent systems emerge for financial and grid simulations, underscoring that swarm logic can extend beyond physical robots. Interoperability standards now allow mixed aerial-ground-maritime fleets under one console, amplifying the total addressable swarm intelligence market.

By Deployment Mode:
Edge computing anchors distributed intelligenceEdge/on-device setups led with 45.55% of the swarm intelligence market in 2025. Neuromorphic chips executing 0.96 pJ per synaptic operation sustain real-time inference under milliwatt budgets. Hybrid orchestration grows fastest at 34.92% CAGR, blending local autonomy with periodic cloud synchronisation for mission updates, heavier analytics, or reinforcement-learning retraining. Pure cloud deployments linger where high compute is essential yet latency is tolerable, such as large-scale simulations. Quantum cloud experiments already optimise microgrid loads, hinting at a future in which cloud augmentation shifts from optional to strategic for certain swarm functions.
Geography Analysis
North America Swarm Intelligence Market
North America contributed 33.72% of the swarm intelligence market in 2025. Pentagon procurement, e-commerce warehouse automation, and USD 7.9 billion in CHIPS Act incentives spur early demand for neuromorphic processors. Venture capital concentration in Silicon Valley accelerates start-up formation, yet tight labour markets make it harder for smaller firms to secure cross-disciplinary talent. Regulatory sandboxes for autonomous vehicles further encourage field trials.
APAC Swarm Intelligence Market
Asia Pacific delivers the steepest 35.90% CAGR to 2031 for the swarm intelligence market. China’s comprehensive 2024 UAV safety rules create predictable certification pathways, and governmental city-cluster programmes unlock large-scale demonstration zones. Japan and South Korea pioneer molecular and service-robotics integration, while regional semiconductor fabs anchor supply for bespoke edge AI chips. Substantial corporate funding, such as SoftBank’s USD 4 billion injection into Skild AI, underscores rising investor appetite.
Europe Swarm Intelligence Market
Europe sustains growth through harmonised drone regulations under Implementing Regulation 2019/947 that enforce risk-based operational categories. The ROBOMINERS initiative illustrates how swarm ideas feed heavy-industry automation, and ethical-AI frameworks reassure stakeholders about liability and transparency. A deliberate but methodical approval process protects public trust, albeit at a slower deployment cadence than Asia Pacific.

Regulatory Landscape
Regulation for swarm intelligence is tightening around safety, accountability, and trustworthy AI. The EU Artificial Intelligence Act (Regulation (EU) 2024/1689), entered into force in August 2024 and sets August 2, 2026 as a key enforcement milestone for high-risk AI systems, is the clearest compliance pull-through. For physical-world multi-agent and swarm robotic deployments, this elevates expectations for risk management, technical documentation, human oversight, and post-market monitoring, which increases the need for auditable coordination logic and validated operating constraints.
Separately, governments are formalizing validation and interoperability for defense-grade swarm capabilities. The White House issued a June 2026 presidential action on advanced AI innovation and security, while the U.S. Department of War published an Artificial Intelligence Strategy in January 2026 that introduced the Swarm Forge project and connected demonstrations to transitions of validated swarm packages. In Asia, China advanced an intelligent-agent standards direction in 2026 through Implementation Opinions issued by the Cyberspace Administration of China, the National Development and Reform Commission, and the Ministry of Industry and Information Technology, signaling emphasis on standardized interconnection protocols alongside certification pathways for aerial autonomy.
Value Chain Analysis
The swarm intelligence value chain spans (1) algorithm and autonomy software (multi-agent coordination, planning, and optimization libraries), (2) edge AI compute and sensor stacks (neuromorphic/AI accelerators, perception sensors, comms modules), (3) platform OEMs and integrators (UAV/UGV/USV/UUV and industrial robotics fleets), and (4) deployment and operations layers (mission planning, command-and-control consoles, simulation/digital twins, and lifecycle support). Recent activity highlights the integration-heavy nature of delivery, with autonomy specialists and data providers increasingly pairing with platform primes to convert swarm logic into deployable systems rather than standalone software.
Integration and assurance bottlenecks tend to cluster around communications reliability, contested-data integrity, and interoperability across heterogeneous fleets. That keeps verified intelligence inputs and edge execution central to commercialization. Examples of value-chain linking include Shield AI and ST Engineering signing an MOU in February 2026 to integrate Hivemind autonomy into manned-unmanned teaming and drone swarms, and Powerus and Swarmer signing an MOU in June 2026 to explore coordination software integration across air and maritime autonomous systems. Data enrichment is also moving upstream into swarm operations, supported by Swarmer partnering with Molfar Intelligence in June 2026 to incorporate verified OSINT datasets into models for autonomous situational awareness.
Competitive Landscape
Competition in the swarm intelligence market remains moderate and fluid. Established chipmakers like Intel earmarked USD 25.1 billion in 2024 capital expenditure for AI-ready fabs that will underpin next-generation neuromorphic edge nodes. Start-ups such as Swarm Technology and Unanimous AI focus on proprietary coordination algorithms and SaaS platforms. Automotive OEMs stake claims via patents on multi-vehicle trajectory optimisation, exemplified by Volkswagen filings with the USPTO.
Strategic focus has shifted toward horizontally scalable platforms that accommodate varied robot types and multiple algorithm families. OffWorld’s modular mining swarms and H2 Clipper’s patent for airship assembly showcase how niche specialists gain ground by solving domain-specific pain points. M&A interest is growing as incumbents look for algorithm or edge-hardware acquisitions to accelerate time-to-market.
Intellectual property portfolios centred on real-time task allocation, low-power consensus, and cross-platform communication attract premium valuations. Firms able to bundle algorithm libraries with energy-efficient silicon and middleware are positioned to capture outsized revenue as deployments scale.
Swarm Intelligence Industry Leaders
Unanimous AI
Swarm Technology
Valutico UK Ltd
Hydromea
Kim Technologies
- *Disclaimer: Major Players sorted in no particular order
Swarm Intelligence Market Companies Covered in this Report
- Swarm Technology
- Unanimous AI
- Hydromea SA
- Sentien Robotics
- Dobots
- Brainalyzed Insight
- ConvergentAI Inc.
- Kim Technologies
- Swarm Systems Ltd.
- Power-Blox AG
- DJI
- Hewlett Packard Enterprise (HPE)
- IBM
- Intel
- Valutico UK Ltd
- HexaDrone
- AeroVironment
- Kratos Defense and Security
- Bluefin Robotics
- Marine AI
- Thales Group

Market Opportunities and Future Outlook
A key opportunity area is interoperable, edge-first swarm stacks that can operate in GNSS-denied and bandwidth-constrained environments, aligning with buyer needs in defense, disaster response, and critical infrastructure monitoring. The ITEA 4 SwarmAI project labeled in May 2026 reinforces this direction, with 32 partners working on autonomous edge-AI for multi-domain vehicle coordination and signaling an industry push toward standardized interfaces and deployable components for heterogeneous fleets rather than single-platform solutions.
Commercial whitespace also extends beyond robotics into software-only multi-agent systems and larger-scale AI operations, where swarm-style optimization functions as a compute and coordination technique. For example, Refiant launched the Protea model in July 2026 using swarm-style optimization to manage very large context windows, pointing to cross-pollination between swarm intelligence methods and enterprise AI infrastructure. On the physical side, MIT CSAIL demonstrated FloatForm in July 2026, a swarm of autonomous robotic boats capable of collective assembly and transport, supporting new use cases in marine construction, inspection, and environmental operations that fit the report scope across UAV/USV/UUV swarms and hybrid edge deployments.
Recent Industry Developments in Swarm Intelligence Market
- June 2026: Hydromea secured a USD 1 million AUKUS Maritime Innovation Challenge grant to develop a next-generation underwater communication system. The award strengthens subsea swarm-enablement by accelerating high-bandwidth links needed for coordinated UUV/ROV operations and faster subsea-to-cloud data movement.
- August 2025: Unanimous AI was selected for U.S. Air Force funding to build its Hyperchat AI technology into Microsoft Teams to optimize collaboration. The integration focus connects collective-intelligence workflows with a widely used enterprise platform, expanding pathways for swarm-style deliberation tools to move from pilots into governed deployments.
- January 2024: Unanimous AI announced it was awarded an Air Force contract aimed at enabling networked teams to form a collective superintelligence. The contract signaled defense interest in human-machine swarm decision-making methods and helped validate procurement-driven commercialization for multi-agent collaboration software.


Swarm Intelligence Market Report Scope and Research Methodology
Market Definition and Coverage
For this study, the swarm intelligence market is defined as revenue earned from software and systems that use swarm-based algorithms to coordinate multiple agents, so group behavior can solve tasks like optimization, routing, and autonomy.
Scope exclusions: We exclude general AI and robotics revenue where swarm-based coordination is not a stated design requirement, and we also exclude standalone hardware sales unless tied to a swarm intelligence software or system deployment.
Segments Covered in This Report
- By Algorithm Type
- Ant Colony Optimisation (ACO)
- Particle Swarm Optimisation (PSO)
- Bee Colony / Honey-Bee Algorithms
- Firefly and Glow-worm Algorithms
- Bacterial Foraging, Artificial Fish and Others
- By End-user Industry
- Transportation and Logistics
- Defense and Security
- Robotics and Industrial Automation
- Healthcare and Life Sciences
- Agriculture and Mining
- BFSI and Financial Services
- Smart Cities and Mobility
- Retail and E-commerce
- Energy and Utilities
- By Platform Type
- UAV Swarms
- UGV Swarms
- USV Swarms
- UUV Swarms
- Software-Only Multi-Agent Systems
- By Deployment Mode
- Edge / On-Device
- Cloud
- Hybrid
- By Geography
- North America
- United States
- Canada
- Mexico
- South America
- Brazil
- Argentina
- Chile
- Rest of South America
- Europe
- Germany
- United Kingdom
- France
- Italy
- Spain
- Netherlands
- Russia
- Rest of Europe
- Asia Pacific
- China
- India
- Japan
- South Korea
- ASEAN
- Rest of Asia Pacific
- Middle East and Africa
- Middle East
- GCC (Saudi Arabia, UAE, Qatar, etc.)
- Turkey
- Rest of Middle East
- Africa
- South Africa
- Rest of Africa
- Middle East
- North America
Data Sources, Market Sizing, and Validation
Desk Research
Desk work starts with building a clear understanding of where swarm intelligence is actually implemented, and where it is only discussed as a concept. We rely on public sources such as NIST publications, IEEE and ACM research proceedings, OECD AI policy trackers, and national statistics portals that help us interpret adoption signals and digital spending context. We also review regulators and aviation bodies where relevant, because swarm-enabled UAV usage and autonomy rules influence timelines.
To avoid overcounting, we cross-check these signals with company filings, investor decks, product documentation, patents, and reputable press coverage that describes real deployments and paid programs. Select paid subscriptions are used mainly for company financials and intelligence, news and financials, and patent databases, to confirm timing and revenue exposure. The sources listed here are illustrative only, and many other public references were used to collect data, validate assumptions, and clarify gaps.
Primary Interviews and Surveys
Primary work was used to pressure test what counts as paid swarm intelligence versus adjacent AI tooling, and to confirm typical pricing setups across software-only and platform-linked deployments. We spoke with a mix of solution builders, system integrators, and end-user teams across APAC, EMEA, and the Americas, and then used follow-up questions to close gaps on adoption speed, deployment modes (edge, cloud, hybrid), and practical buying cycles.
Distribution of primary research fieldwork respondents
| Company type | Respondent position | Region |
|---|---|---|
| Top tier: 29% | CXOs: 22% | APAC: 38% |
| Mid tier: 49% | Functional/Unit leaders: 35% | EMEA: 37% |
| Smaller Players: 22% | Managers: 43% | Americas: 25% |
Market-Sizing & Forecasting
Sizing is built using a top-down model where our starting point is the addressable demand pool created from automation and autonomy spend signals, which are then filtered through swarm intelligence penetration rates by platform type and end-user usage patterns. Once that structure is in place, we check the totals with selective bottom-up approximations, such as sampled average selling price ranges for software and services multiplied by likely deployment volumes, plus channel checks on how often swarm features are purchased as a paid module.
Key inputs used in the model include the mix of algorithm types used in commercial deployments (such as ant colony optimization, particle swarm optimization, and swarm-based networks), the split of deployment mode (edge/on-device, cloud, hybrid), and platform exposure (UAV, UGV, USV, UUV, and software-only multi-agent systems). We also track adoption indicators by end-user groups, including transportation and logistics, robotics and automation, and healthcare, because buying triggers and rollout speed differ across them. Where bottom-up coverage is thin, the gaps are handled by applying conservative adoption ranges validated through interviews, and then adjusted so they stay consistent with observed program activity and public proof points.
For forecasting, scenario analysis is used because the market is sensitive to regulatory pace, enterprise readiness, and funding cycles, and these drivers do not move in a straight line each year. The scenarios are anchored using expert views on how quickly multi-agent autonomy shifts from pilots to scaled deployments, followed by a year-by-year smoothing step so the curve stays realistic.
Data Validation & Update Cycle
Validation is done by comparing the model output with independent signals, and then checking whether the implied adoption levels look reasonable by platform and end-user category. When a number looks off, we re-check the inputs for unit consistency, double counting, and timing mismatches, and then re-contact interviewees if a major assumption changed. Before sign-off, the work is reviewed in multiple steps so the final totals and growth rates match the story told by the underlying indicators.
Reports are refreshed annually, and interim updates are made when material events occur, such as regulatory changes that alter autonomous operations, or large public deployments that shift demand expectations. Right before delivery, a final review pass is completed so clients receive the latest updated view instead of an older snapshot.
Mordor Intelligence's Swarm Intelligence Market Size Compared With Other Published Estimates
Published market sizes for swarm intelligence can vary a lot, and it usually happens because the scope line is drawn differently and the adoption timing is assumed in different ways. Differences also show up when one estimate treats platform-linked systems and software-only deployments as the same thing, or when currency timing and refresh cadence are not aligned.
The benchmark table shows a noticeable spread, and in Mordor Intelligence's model the market value is limited to commercial swarm intelligence solutions across defined algorithm types and deployment modes, instead of counting broader AI autonomy revenue that does not require swarm coordination. Another driver is how fast deployment moves from pilots to scaled rollouts, where some publishers assume a steeper near-term ramp without checking it against end-user budgeting cycles and platform readiness. Currency conversion year and the handling of services also matter, since bundling and implementation revenue can inflate totals if it is not tied to swarm-specific work.
Benchmark comparison
| Source | Market Size | Gaps in Research Methodology |
|---|---|---|
| Mordor Intelligence | USD 0.08 B (2025) | |
| Global Consultancy A | USD 0.08 B (2024) | Uses an earlier base year and may include adjacent AI autonomy spending that is not strictly tied to swarm-based coordination, which can shift the starting value even if the growth rate looks similar. |
| Industry Publisher B | USD 0.03 B (2023) | Anchors the market at a smaller historical value and appears to emphasize narrower software-only definitions, which can understate platform-linked deployments and delay the counted revenue into later years. |
Looking at the table together, the main takeaway is that the size differences are mostly explained by what is included as swarm intelligence, and by how quickly scaled deployments are assumed to occur. Our approach stays traceable to clear scope rules, a repeatable demand pool build, and interview-checked adoption ranges, which makes the final number easier to reconcile with real-world rollout signals.


Key Questions Answered in the Report
What is the current size of the swarm intelligence market?
The swarm intelligence market size is USD 107.34 million in 2026.
How fast is the swarm intelligence market expected to grow?
The market is projected to post a 34.18% CAGR, reaching USD 466.83 million by 2031.
Which industry accounts for the largest end-user share?
Transportation and logistics led with a 27.68% share in 2025 owing to warehouse automation and last-mile delivery optimisation.
Which region is expanding the quickest?
Asia Pacific is forecast to grow at a 35.90% CAGR through 2031, driven by supportive drone regulations and smart-city investments.
What deployment mode dominates current adoption?
Edge/on-device architectures held 45.55% share in 2025 because they meet low-latency and data-sovereignty requirements.
What is the principal restraint limiting market expansion?
A shortage of engineers skilled in both biology and distributed robotics imposes a -4.8% drag on forecast CAGR, slowing commercial roll-outs.
Page last updated on:


 Your data is secure and never sold or shared.


