
Mobile Artificial Intelligence Market Size and Share
Market Overview
| Study Period | 2020 - 2031 |
|---|---|
| Market Size (2026) | USD 30.48 Billion |
| Market Size (2031) | USD 83.15 Billion |
| Growth Rate (2026 - 2031) | 22.23 % |
| Fastest Growing Market | Asia-Pacific |
| Largest Market | Asia Pacific |
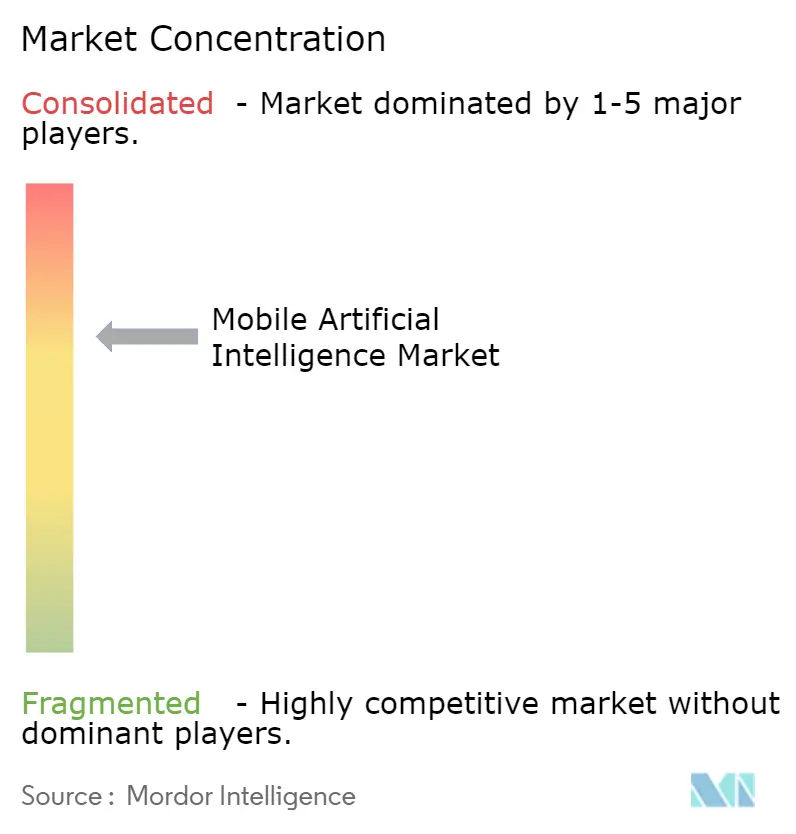
| Market Concentration | Medium |
Major Players *Disclaimer: Major Players sorted in no particular order Image © Mordor Intelligence. Reuse requires attribution under CC BY 4.0. | |
Mobile Artificial Intelligence Market Analysis by Mordor Intelligence
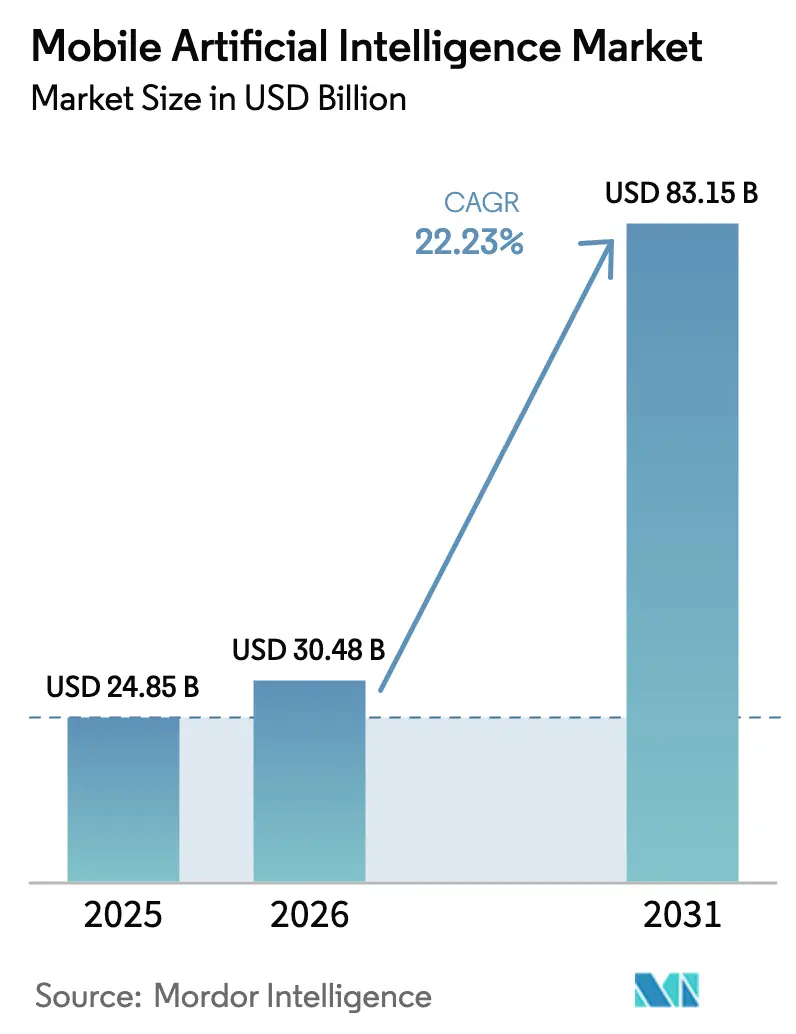
The mobile artificial intelligence market size is projected to expand from USD 24.85 billion in 2025 and USD 30.48 billion in 2026 to USD 83.15 billion by 2031, registering a CAGR of 22.23% between 2026 to 2031. Chip suppliers are redirecting transistor budgets toward dedicated neural processing units and high-bandwidth memory because EU and Chinese privacy rules now oblige latency-sensitive inference to remain on the device. Shorter product cycles, twelve months for flagship mobile chipsets in 2025 versus eighteen months in 2020, are forcing fabless designers to lock in advanced CoWoS and I-Cube packaging capacity years ahead, tightening supply and strengthening incumbent bargaining power. Energy efficiency gains are enabling phones to run 7-billion-parameter language models within a 6 watt-hour budget, opening use cases such as real-time video editing that previously required cloud assistance.[1]IEEE Staff, “Energy-Efficient On-Device LLM Inference,” IEEE Transactions on Mobile Computing, ieeexplore.ieee.org Meanwhile, Asia-Pacific vendors are vertically integrating silicon and software to avoid export limits on cutting-edge nodes, a strategy that lifted the region to 37.16% mobile artificial intelligence market share in 2025 and will continue to shape competitive dynamics through 2031.
Key Report Takeaways
- By application, smartphones held 41.23% of the mobile artificial intelligence market share in 2025, while robotics is forecast to expand at a 23.81% CAGR to 2031.
- By component, hardware accounted for 62.13% of the mobile artificial intelligence market size in 2025; software is projected to register a 22.41% CAGR during 2026-2031.
- By technology, CPU accounted for 38.62% of the mobile artificial intelligence market share in 2025, while NPU / AI Accelerator is forecast to expand at a 23.59% CAGR in 2031.
- By processing type, on-device processing captured 67.13% of the mobile artificial intelligence market size in 2025, whereas hybrid processing will grow at a 22.32% CAGR through 2031.
- By end-user industry, consumer electronics accounted for 46.37% of the mobile artificial intelligence market share in 2025, while healthcare and life-sciences is forecast to expand at a 23.54% CAGR in 2031.
- By geography, Asia-Pacific led with a 37.16% mobile artificial intelligence market share in 2025 and is also the fastest-growing geography at a 24.12% CAGR out to 2031.
Note: Market size and forecast figures in this report are generated using Mordor Intelligence’s proprietary estimation framework, updated with the latest available data and insights as of January 2026.
Market Trends and Insights
Drivers Impact Analysis of Mobile Artificial Intelligence Market*
| Driver | (~) % Impact on CAGR Forecast | Geographic Relevance | Impact Timeline |
|---|---|---|---|
| AI-Capable Processor Demand Surge | 4.2% | Global, with concentration in North America, China, South Korea | Short term (≤ 2 years) |
| Generative-AI Smartphone Launches | 3.8% | Asia-Pacific core, spill-over to Europe and North America | Short term (≤ 2 years) |
| Edge-AI Chip Energy-Efficiency Gains | 3.5% | Global, particularly relevant for battery-constrained devices in APAC and North America | Medium term (2-4 years) |
| Consumer Privacy and Low-Latency Need | 3.1% | Europe (GDPR), China (PIPL), California (CCPA), with global adoption | Medium term (2-4 years) |
| Memory Subsystem Breakthroughs for On-Device LLMs | 2.9% | Global, led by advanced manufacturing hubs in Taiwan, South Korea, US | Medium term (2-4 years) |
| Proliferation of Open-Source TinyML Model Zoos | 2.4% | Global, with developer communities concentrated in North America, Europe, India | Long term (≥ 4 years) |
| Source: Mordor Intelligence | |||
AI-Capable Processor Demand Surge
Vendors shipped more than 320 million AI-ready phones in 2025, and buyers now judge premium devices by NPU TOPS rather than CPU clock speeds. Snapdragon 8 Elite delivers 45 TOPS at 8 watts on a 3 nm node, a 60% efficiency jump over its predecessor.[2]Qualcomm Corp., “Qualcomm Unveils Snapdragon 8 Elite,” qualcomm.com Apple’s A18 Pro hits 35 TOPS with a 16-core neural engine, letting a 3-billion-parameter model stay local. MediaTek’s Dimensity 9400 folds ray-tracing and diffusion-model hardware into a single SoC for mixed-reality tasks. Faster product cycles are tightening foundry and packaging supply, solidifying the position of firms that signed long-term capacity contracts during the 2023-2024 boom.
Generative-AI Smartphone Launches
Samsung’s Galaxy S25 integrates Gemini Nano for call transcription without the cloud, eliminating 50-150 ms round-trip latency.[3]Samsung Electronics, “Galaxy S25 Series Unveiled,” news.samsung.com Google’s Pixel 9 introduced Magic Editor, performing diffusion-model inpainting locally in under three seconds. Xiaomi’s 15 Pro leverages HyperOS 2.0 to orchestrate multi-app workflows offline. Devices now compete on inference latency and energy draw instead of megapixel count, repositioning software ecosystems as enduring competitive moats.
Edge-AI Chip Energy-Efficiency Gains
Intel's Core Ultra 2, leveraging a 3 nm accelerator tile, achieves an impressive 48 TOPS at just 7 watts, showcasing significant advancements in energy-efficient processing. Meanwhile, Arm's Cortex-X5 has made notable progress by reducing INT8 energy consumption per inference by 40%, a development that highlights its focus on optimizing performance for AI workloads. Looking ahead, Samsung's Exynos 2500, equipped with HBM3E, aims to boost bandwidth to a staggering 1.2 TB/s by mid-2026, all while cutting DRAM energy in half, which represents a major leap in memory technology. Thanks to these technological advancements, power consumption for a 7-billion-parameter run has plummeted from 15 Wh in 2023 to a mere 6 Wh in 2025. This substantial reduction not only makes mobile AI workloads more efficient but also broadens their scope significantly, enabling applications to evolve from simple photo edits to more complex and continuous tasks such as ongoing health monitoring.
Consumer Privacy and Low-Latency Need
The EU AI Act treats biometric inference as high-risk, pushing manufacturers to keep models on device. China bars cross-border face-data transfers, while the California CCPA update lets users audit inference paths, nudging vendors toward local processing. A 2025 PwC survey found 68% of Western consumers willing to pay extra for local data handling. Latency compounds the privacy case: cloud inference breaks immersive AR when delays exceed 20 ms.
Restraints Impact Analysis of Mobile Artificial Intelligence Market*
| Restraint | (~) % Impact on CAGR Forecast | Geographic Relevance | Impact Timeline |
|---|---|---|---|
| Premium Pricing of AI Chipsets | -2.8% | Global, with acute impact in price-sensitive markets (India, Southeast Asia, Latin America) | Short term (≤ 2 years) |
| Thermal and Power-Budget Constraints | -2.3% | Global, particularly for sustained workloads in smartphones and tablets | Medium term (2-4 years) |
| Regulatory Scrutiny on On-Device Data | -1.6% | Europe (GDPR), China (PIPL), California (CCPA) | Medium term (2-4 years) |
| Advanced Substrate Supply Crunch | -1.4% | Global, concentrated in Taiwan and South Korea manufacturing hubs | Long term (≥ 4 years) |
| Source: Mordor Intelligence | |||
Premium Pricing of AI Chipsets
Snapdragon 8 Elite sells to OEMs for about USD 160, roughly 50% above a Snapdragon 7 Gen 3, adding USD 80-120 to retail prices in mid-tier handsets. Apple faces a similar gap between A18 Pro and A16, compressing margins in inflation-sensitive regions. CoWoS and I-Cube packaging tack on another USD 20-30 per die as demand outruns capacity. High entry prices confine cutting-edge AI to flagships until 2027, slowing mass adoption.
Thermal and Power-Budget Constraints
Despite employing vapor-chamber cooling technology, the iPhone 16 Pro experiences a significant performance reduction, with its neural engine throttling by 40% after just eight minutes of operation. This limitation highlights the challenges faced by manufacturers in managing heat dissipation effectively in compact devices. In contrast, Samsung's Galaxy S25 Ultra leverages graphene spreaders to extend its operational duration to twelve minutes before encountering similar throttling issues. However, this improvement comes with trade-offs, including an additional 15 grams in weight and a 10% increase in device thickness, which may impact user preferences. Meanwhile, lithium-ion energy density has reached a plateau, stabilizing around 280 Wh/kg, which limits further advancements in battery performance. As a result, the industry is increasingly adopting a hybrid approach that combines on-device and cloud inference as a practical and efficient workaround to address these limitations.
*Our forecasts treat driver/restraint impacts as directional, not additive. The impact forecasts reflect baseline growth, mix effects, and variable interactions.
Mobile Artificial Intelligence Market Segment Analysis
By Application:
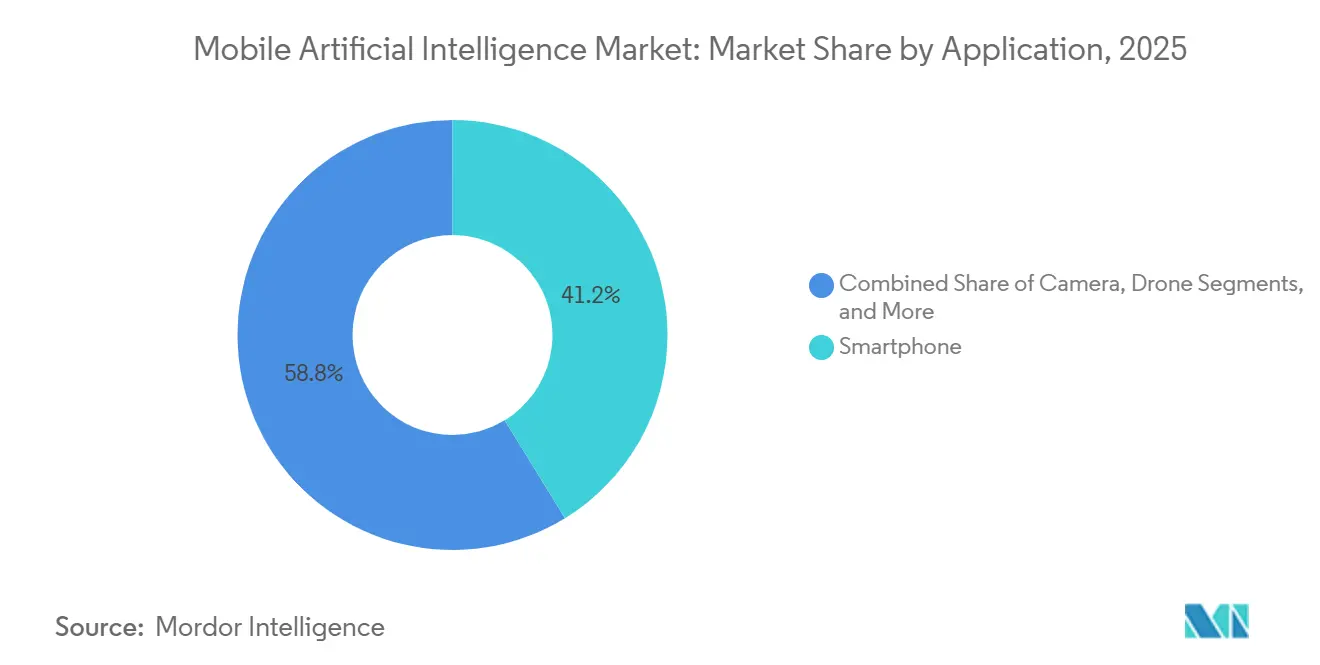
Smartphones Anchor Revenue, Robotics AcceleratesSmartphones contributed 41.23% of the mobile artificial intelligence market size in 2025, confirming their role as the volume engine for silicon vendors. Growth is tapering, however, because mature markets are saturated and differentiation is shifting to software ecosystems that lock users in for longer upgrade cycles. Industrial robotics, by contrast, is forecast to climb at a 23.81% CAGR as labor shortages in logistics spur investment in mobile AI vision and path-planning modules.
The widening gap between smartphone volume and robotics velocity drives portfolio diversification. Chipmakers can leverage smartphone scale to amortize R&D while targeting high-margin robots that accept higher power envelopes. Qualcomm’s robotics-ready RB5 and NVIDIA’s 15-watt Jetson Orin Nano illustrate how suppliers repurpose mobile core IP for autonomous machines.



By Component:
Software Gains as Monetization ShiftsHardware dominated with a 62.13% share in 2025, but software licensing is growing at a 22.41% CAGR, driven by SDK fees and model marketplaces that generate recurring revenue beyond silicon. Qualcomm’s AI Hub monetizes over one hundred tuned models through per-device fees, and Apple’s Core ML locks creators into the App Store’s distribution economics.
As hardware margins compress under node and packaging costs, vendors seek annuity streams from developer ecosystems. This dynamic reshapes competition: firms that control both silicon and the OS can capture value twice, while pure-play chip designers must ally with platform owners or risk commoditization.
By Technology:
NPUs Disrupt CPU DominanceCPUs still held 38.62% revenue in 2025, yet NPUs and related accelerators are projected to rise at a 23.59% CAGR because transformer attention favors matrix units and INT8 arithmetic. GPUs retain a foothold in mixed-reality gaming, but their 5 watt-plus sustained draw caps share in battery-bound devices. DSPs, notably Qualcomm’s Hexagon 780, assume always-on tasks such as wake word detection, freeing the main NPU for bursty workloads.
A single SoC now contains heterogeneous AI blocks. Apple’s A18 Pro combines a neural engine, GPU tensor cores, and a secure enclave, letting iOS schedule tasks across engines to avoid thermal hotspots. This heterogeneity increases software complexity, rewarding vendors with integrated compiler stacks.
By Processing Type:
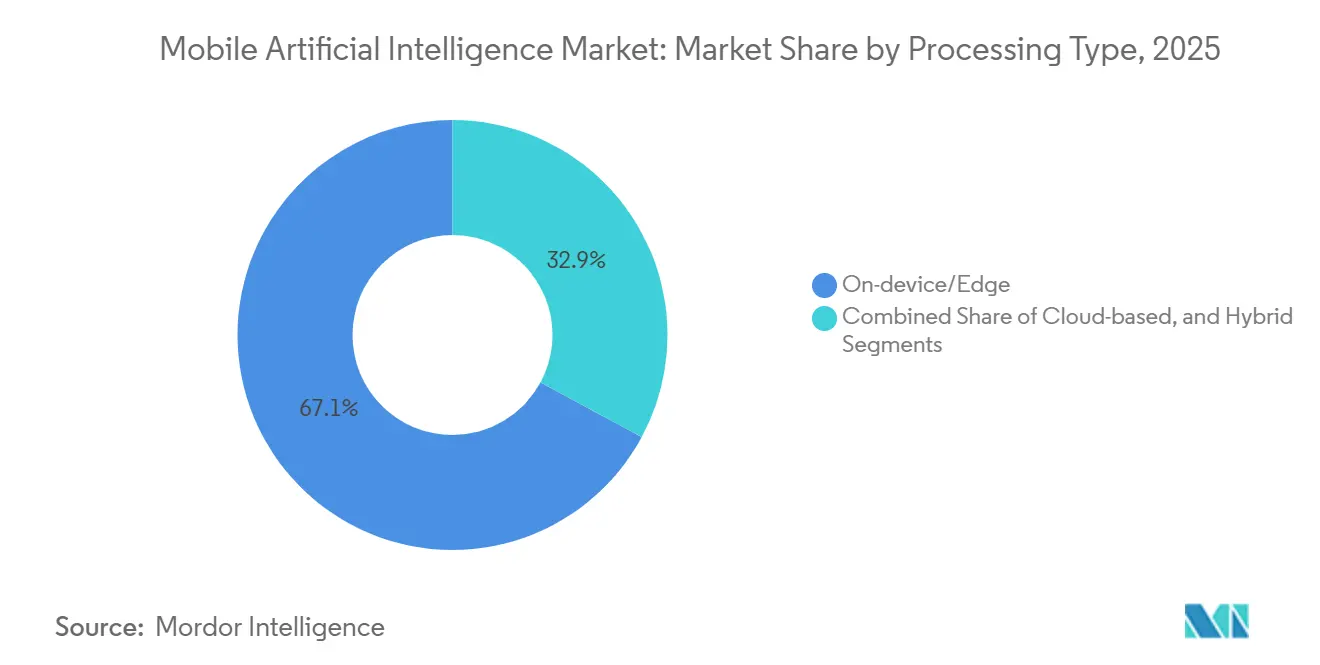
Hybrid Models Reconcile Latency and PowerOn-device inference claimed 67.13% of the 2025 mobile artificial intelligence market size, but hybrid strategies that split work between edge and cloud will expand at 22.32% CAGR through 2031. Google’s Gemini Nano first attempts local execution and falls back to servers only when confidence dips under a threshold, balancing latency, privacy, and energy.
Thermal ceilings of 5-7 watts in phone form factors make sustained local diffusion modeling impractical. Hybrid designs, therefore, are not a compromise but a necessity that lets OEMs deploy smaller 1-3 billion-parameter local models while leaning on cloud GPUs for heavy lifting when bandwidth allows.
By End-User Industry:
Healthcare Emerges as High-Margin NicheConsumer electronics remained the top customer at 46.37% in 2025, yet healthcare is accelerating at 23.54% CAGR as FDA-cleared diagnostics migrate to mobile endpoints for point-of-care testing. Automotive OEMs are embedding mobile AI for driver monitoring and in-cabin personalization, expanding attach rates for AI chipsets in dashboards and domain controllers.
Healthcare’s margin appeal is tempered by ISO 13485 and IEC 62304 compliance costs, lengthening design cycles but also building entry barriers against low-cost entrants. Defense and aerospace buyers, though small in volume, pay premiums for radiation-hardened variants, diversifying supplier revenue streams beyond consumer refresh cycles.
Geography Analysis
APAC Mobile Artificial Intelligence Market
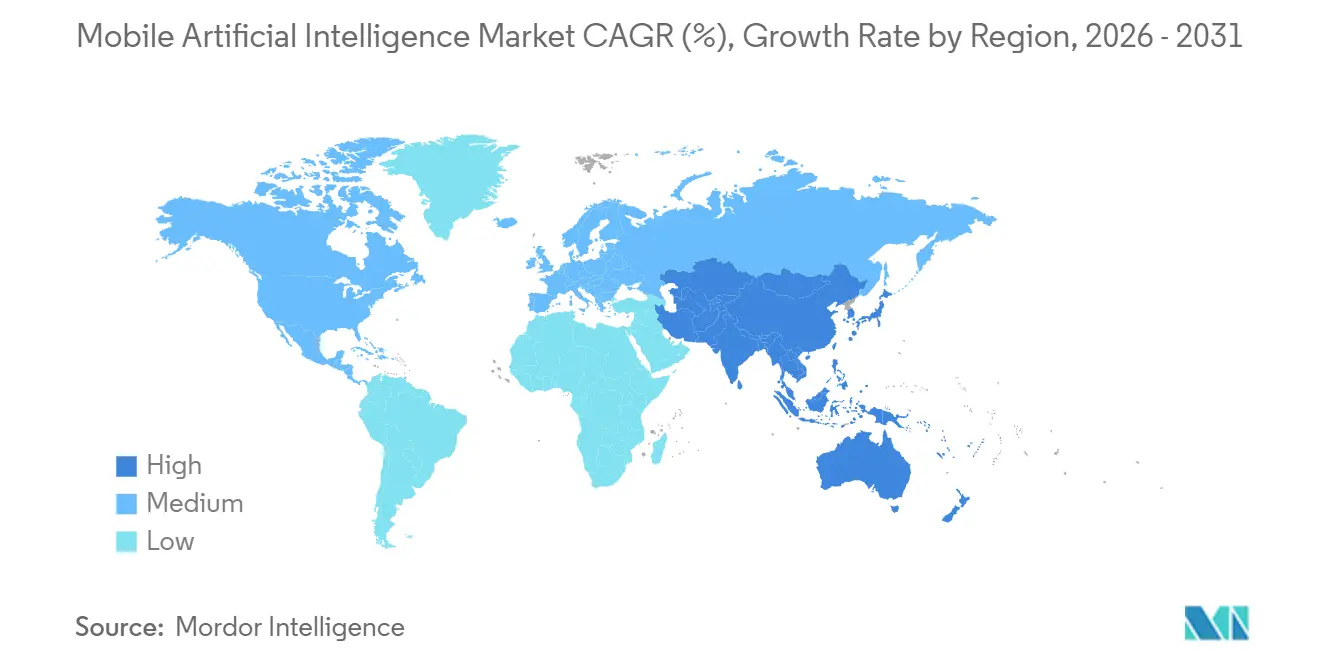
Asia-Pacific captured 37.16% of the mobile artificial intelligence market share in 2025 and will rise at a 24.12% CAGR as Chinese OEMs design in-house chipsets to sidestep export controls. State-backed funds exceeding USD 50 billion support 7 nm and 5 nm production lines at SMIC and Hua Hong, dialing down reliance on TSMC.
Northeast and South Asia Mobile Artificial Intelligence Market
Japan’s carriers are investing in 5G edge AI nodes for autonomous mobility pilots, while South Korea’s vertically integrated Samsung funnels packaging breakthroughs directly into Galaxy devices. India’s PLI subsidies attract Foxconn and Pegatron to localize AI-phone assembly, positioning the country as the world’s low-cost production hub for mid-tier devices.
The Americas and EMEA Mobile Artificial Intelligence Market
North America remains lucrative for ruggedized enterprise handhelds, but unit volumes trail Asia-Pacific. Europe’s strict privacy laws drive on-device processing, yet slow new feature rollouts pending audits. The Middle East and Africa grow selectively via smart city budgets, while macroeconomic volatility suppresses South American upgrades.

Regulatory Landscape
Mobile AI deployments are increasingly shaped by AI-specific rules and privacy regimes that push latency-sensitive inference onto the device. In the European Union, the EU AI Act (Regulation (EU) 2024/1689) was enacted on 13 June 2024, with full application starting 2 August 2026; the European Commission AI Office becomes active from 2 August 2025, creating a clearer governance and enforcement path for handset OEMs, chipset vendors, and app developers placing AI-enabled mobile products on the EU market.
In the United States, the NIST AI Risk Management Framework (AI RMF 1.0) is a widely used voluntary benchmark for trustworthy AI, structured around Govern, Map, Measure, and Manage. For global mobile AI suppliers, aligning device-level model governance, transparency documentation, and risk controls to both the EU AI Act requirements and NIST AI RMF practices has become a practical way to reduce compliance friction across regions while keeping on-device data handling as a core design principle.
Value Chain Analysis
The mobile AI value chain starts with model development and optimization (quantization, pruning, compilation) and runs through silicon IP (CPU/GPU/DSP/NPU blocks), EDA tool flows, foundry production, advanced packaging, memory integration, and OEM device assembly. Leading-edge mobile AI SoCs rely on advanced nodes and tight co-design across the OS, frameworks, and runtimes, with platform owners and chipset leaders differentiating via SDKs, tuned model catalogs, and on-device inference stacks that translate NPU TOPS into user-facing latency and battery outcomes.
Bottlenecks have shifted toward advanced packaging and memory rather than logic alone. CoWoS-type capacity and HBM are cited constraint points as mobile chip designers redirect transistor budgets toward NPUs and higher-bandwidth memory paths. The chain is also becoming more regionally segmented due to export controls and localized compliance needs; for example, Qualcomm expanding its relationship with Hugging Face (June 2026) to broaden developer access to open models across Snapdragon platforms, and Apple securing China deployment clearance for Apple Intelligence with local partners including Alibaba (Qwen) and Baidu (July 2026), underline that distribution increasingly depends on both silicon capability and in-market model and regulatory partnerships.
Competitive Landscape
Qualcomm, Apple, and MediaTek together shipped roughly 60% of mobile AI chipsets in 2025, implying a moderately concentrated hardware arena. Apple’s full-stack control, from silicon to App Store, lets it tune latency and energy with an advantage rivals struggle to match. Samsung wields similar leverage through its Exynos line and Galaxy brand, demonstrated when the S25 used in-house silicon for certain regions while pairing Snapdragon elsewhere to hedge risk.
Qualcomm compensates for the lack of a device business by cultivating developers through AI Hub and a mature Neural Processing SDK, seeding its IP across Android’s broad OEM base. Emerging challengers such as Graphcore and Cerebras court robotics and defense markets that tolerate higher power envelopes in exchange for extreme throughput. Unisoc and Rockchip address sub-USD 200 handsets with 12 nm AI chips, exploiting supply resilience on mature nodes.
Patent filings illuminate future skirmishes. Qualcomm lodged 87 AI-mobile patents during 2024-2025, centering on INT4 quantization and memory compression, while Apple’s 62 filings focus on secure enclaves and federated learning for privacy-sensitive inference. NVIDIA’s entrance with Jetson Orin Nano throws CUDA’s vast ecosystem behind embedded AI, potentially shifting momentum in drones and industrial robots.
Mobile Artificial Intelligence Industry Leaders
Qualcomm Technologies Inc.
Apple Inc.
Samsung Electronics Co. Ltd.
MediaTek Inc.
Huawei Technologies Co. Ltd. (HiSilicon)
- *Disclaimer: Major Players sorted in no particular order
Mobile Artificial Intelligence Market Companies Covered in this Report
- Qualcomm Technologies Inc.
- Apple Inc.
- Samsung Electronics Co. Ltd.
- MediaTek Inc.
- Huawei Technologies Co. Ltd. (HiSilicon)
- Alphabet Inc. (Google)
- Nvidia Corporation
- Intel Corporation
- Microsoft Corporation
- International Business Machines Corporation
- Arm Ltd.
- OPPO
- Xiaomi Corporation
- Vivo Mobile Communication Co. Ltd.
- Honor Device Co. Ltd.
- Baidu Inc.
- Taiwan Semiconductor Manufacturing Company Limited (TSMC)
- Synopsys Inc.
- Cadence Design Systems Inc.
- Graphcore Ltd.
- Cerebras Systems Inc.

Market Opportunities and Future Outlook
Opportunities are widening around on-device and hybrid inference stacks that deliver measurable user value without persistent cloud dependence, especially in privacy-sensitive and latency-critical experiences such as call transcription, photo and video editing, and assistant workflows. China-specific deployments show a clear whitespace for localized model partnerships and compliance-led product variants. Apple Intelligence received deployment approval in China in July 2026 with Alibaba (Qwen) and Baidu integrations, indicating that feature parity in large smartphone markets can hinge on approved local model providers and on-device execution paths.
A second opportunity cluster centers on model compression and mobile-first optimization that expands what can run within phone thermal and memory limits. This shift pushes value toward tooling, runtimes, and developer ecosystems rather than raw silicon alone. Qualcomm's June 2026 expansion with Hugging Face supports a broader open, developer-driven pipeline from device to cloud, while Apple's reported evaluation of PrismML-style compression approaches reflects OEM interest in packaging larger capabilities into constrained footprints. Separately, the EU AI Act reaching full application on 2 August 2026 and US state-level rules such as Colorado's AI Act taking effect in June 2026 increase demand for compliance-ready mobile AI features, including documentation, transparency controls, and governance workflows that can be productized across device portfolios and app ecosystems.
Recent Industry Developments in Mobile Artificial Intelligence Market
- July 2026: The Cyberspace Administration of China cleared multiple mobile on-device generative AI services for public offering, including Apple Intelligence, Samsung Galaxy AI, and Huawei Celia AI. The decision reduces a key commercialization barrier in the world's largest smartphone market and reinforces the need for in-country compliance and product packaging for on-device AI features.
- June 2026: Qualcomm announced an agreement to acquire Modular Inc. for about USD 3.9 billion in stock, with closing targeted for the second half of 2026. Adding Modular's software capabilities strengthens Qualcomm's push toward software-defined AI stacks that help developers deploy and optimize inference across devices and edge platforms anchored by Snapdragon.
- June 2024: The European Union enacted the EU AI Act (Regulation (EU) 2024/1689). Its risk-based obligations and timeline to full application on 2 August 2026 have accelerated device-side governance, transparency work, and design choices that keep sensitive inference local to meet regulatory and privacy expectations.


Mobile Artificial Intelligence Market Report Scope and Research Methodology
Market Definition and Coverage
This market covers revenue generated from enabling artificial intelligence features on mobile devices and nearby edge endpoints, including the related hardware, software, and services that make on-device, cloud-based, and hybrid AI possible.
Scope exclusions: We exclude general-purpose cloud AI that is not tied to mobile endpoints, along with non-mobile enterprise AI deployments that do not ship through mobile device ecosystems.
Segments Covered in This Report
- By Application
- Smartphone
- Camera
- Drone
- Robotics
- Automotive
- Other Applications
- By Component
- Hardware
- Software
- Services
- By Technology
- CPU
- GPU
- NPU / AI Accelerator
- DSP
- By Processing Type
- On-Device / Edge
- Cloud-Based
- Hybrid
- By End-User Industry
- Consumer Electronics
- Automotive and Mobility
- Industrial and Manufacturing
- Healthcare and Life-Sciences
- Defense and Aerospace
- Other End-User Industries
- By Geography
- North America
- United States
- Canada
- Mexico
- South America
- Brazil
- Argentina
- Rest of South America
- Europe
- Germany
- United Kingdom
- France
- Italy
- Spain
- Rest of Europe
- Asia-Pacific
- China
- India
- Japan
- South Korea
- Australia and New Zealand
- Rest of Asia-Pacific
- Middle East
- Saudi Arabia
- United Arab Emirates
- Turkey
- Rest of Middle East
- Africa
- South Africa
- Nigeria
- Egypt
- Rest of Africa
- North America
Data Sources, Market Sizing, and Validation
Desk Research
Desk work starts by mapping what is shipped and adopted, then translating that into an addressable revenue pool for mobile AI. We used public sources such as telecom and connectivity releases from the International Telecommunication Union, trade statistics from UN Comtrade, patent and assignee signals from USPTO and WIPO, and macro indicators from the World Bank and OECD to ground demand conditions.
To keep assumptions realistic, we also reviewed company filings, earnings call transcripts, developer conference disclosures, and standards and association materials that describe on-device compute trends and AI software packaging. For cross-checking financial baselines and product exposure, we used select paid subscriptions for company financials and intelligence, news and financials coverage, patent databases, and shipment-level import and export views where it helped validate directionally. These examples are illustrative and not exhaustive, and additional public references were used to collect, validate, and clarify data points during the study.
Primary Interviews and Surveys
Primary work was used to confirm what is counted as mobile AI revenue, how pricing is moving for AI-capable chips and bundled software, and where cloud inference is still billed separately. We spoke with stakeholders across the value chain, including device ecosystem participants, component and software specialists, and buyers from consumer electronics, automotive and mobility, and industrial use cases. Coverage was balanced across APAC, EMEA, and the Americas.
Distribution of primary research fieldwork respondents
| Company type | Respondent position | Region |
|---|---|---|
| Top tier: 37% | CXOs: 18% | APAC: 53% |
| Mid tier: 43% | Functional/Unit leaders: 23% | EMEA: 29% |
| Smaller Players: 20% | Managers: 59% | Americas: 18% |
Market-Sizing & Forecasting
Sizing is built using top-down logic where device and component shipment signals, adoption penetration of AI-capable devices, and attach rates of AI software and services are reconstructed into annual revenue, then filtered by processing type (on-device, cloud-based, and hybrid). In parallel, selective bottom-up approximations were used to sanity-check totals, such as sampled average selling price (ASP) times units for AI processors, followed by channel checks on software monetization and service bundles.
Inputs that mattered most included smartphone and adjacent device shipment trends, the share of devices with NPUs or AI accelerators, average compute capability shifts by technology node, the mix between on-device inference versus cloud calls, and ASP progression for AI hardware and paid AI features. When a bottom-up path had gaps, we bridged them using conservative ranges from interviews and then stress-tested outcomes against public disclosures and shipment directionality.
For forecasting, we relied on scenario analysis supported by short-run smoothing of key drivers, since mobile AI adoption can move quickly with product cycles and connectivity upgrades. The forward view is tied to variables that respondents could validate, including expected NPU penetration, upgrade cycles, regional demand strength, and the pace of AI feature monetization in devices and apps.
Data Validation & Update Cycle
Validation is done through multiple checks so that any single data stream cannot steer the final number too far. Model outputs are compared with independent signals like device shipment momentum, reported AI-capable platform adoption, and price movement direction for key enabling components, then variance flags are reviewed before sign-off.
Where anomalies show up, analysts revisit scope boundaries, re-check currency conversions for the same time window, and re-contact relevant experts to confirm assumptions that changed due to new launches or policy moves. The report is refreshed annually, with interim updates when material market events occur, and a final pre-delivery pass is done to ensure the latest datapoints are reflected in the narrative and numbers.
Mordor Intelligence's Mobile Artificial Intelligence Market Sizing Compared With Other Published Estimates
Published market values for mobile AI can look far apart because the timing and the counting rules are not the same across studies, even when the topic label looks identical. Differences often come from which revenue streams are treated as mobile-first, how hybrid (device plus cloud) usage is billed, and whether the figure is reported in constant or current USD.
In our checks, the largest spread usually appears when older ASP curves are kept for AI-capable processors or currencies are converted using an annual average that does not match the shipment and pricing period, and then the totals drift as product cycles shift. When quarterly refresh points, FX timing, and device-cycle validation gates are applied consistently, the estimate stays tied to device shipments, NPU penetration, and processing mix, which is where the refresh-led practice used by Mordor Intelligence typically reduces avoidable swings.
Benchmark comparison
| Source | Market Size | Gaps in Research Methodology |
|---|---|---|
| Mordor Intelligence | USD 24.85 B (2025) | |
| Global Consultancy A | USD 23.85 B (2025) | Uses a different base year and forecast window, and the scope is more centered on technology-node and device categories, which can leave some bundled software and service monetization counted differently across regions. |
| Industry Report B | USD 22.15 B (2025) | Applies a factory-gate revenue lens and tighter value-chain boundaries, which can exclude downstream software and services that are recognized outside manufacturer-level revenues. |
The comparison indicates that most variance comes from scope edges and timing choices that influence ASPs, currency conversion, and what is treated as mobile-tied services. By keeping inputs traceable to shipment momentum, adoption indicators, and pricing checks, the final value is easier to reproduce and to update when the market moves.


Key Questions Answered in the Report
How large will the mobile artificial intelligence market be by 2031?
It is forecast to reach USD 83.15 billion by 2031, advancing at a 22.23% CAGR from 2026.
Which application segment is set to grow fastest?
Robotics leads with a projected 23.81% CAGR during 2026-2031 on rising demand for autonomous industrial platforms.
Why is Asia-Pacific dominant in mobile AI hardware?
Vertical integration among Chinese, Japanese, South Korean, and Indian firms secures silicon supply and accelerates design cycles, resulting in 37.16% market share in 2025.
What limits on-device generative AI today?
Thermal ceilings of 5-7 watts and premium chip pricing push vendors toward hybrid edge–cloud inference models.
Page last updated on:


 Your data is secure and never sold or shared.


