ESG Software Market Size and Share
Market Overview
| Study Period | 2020 - 2031 |
|---|---|
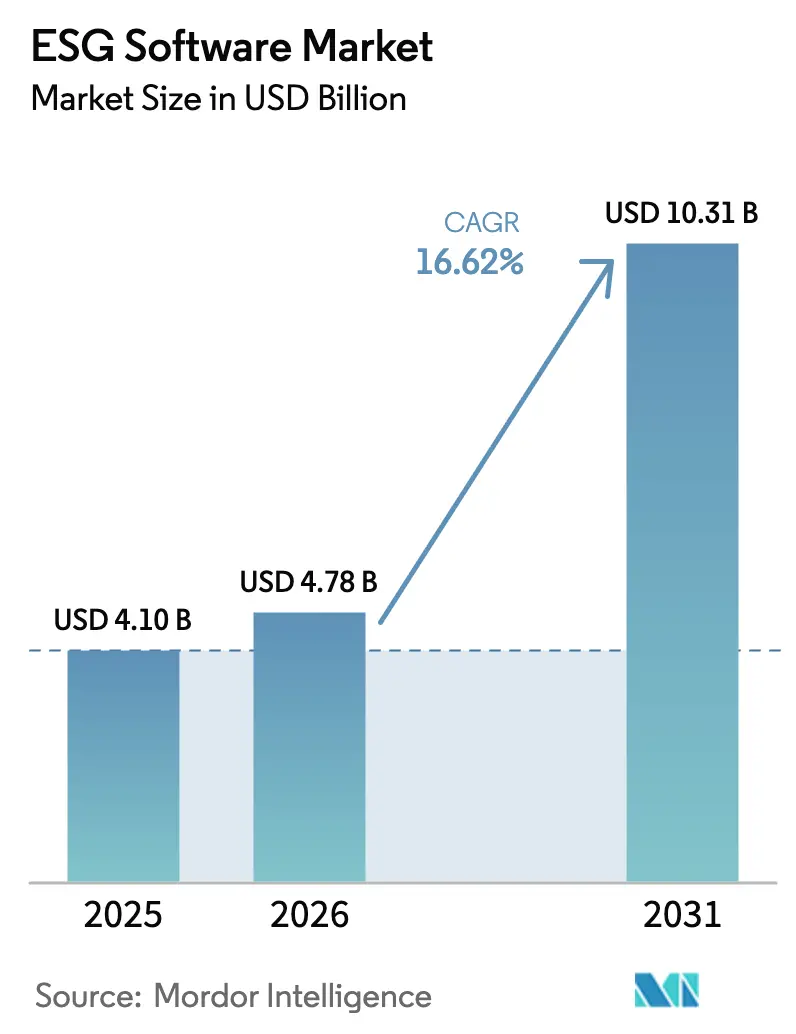
| Market Size (2026) | USD 4.78 Billion |
| Market Size (2031) | USD 10.31 Billion |
| Growth Rate (2026 - 2031) | 16.62% CAGR |
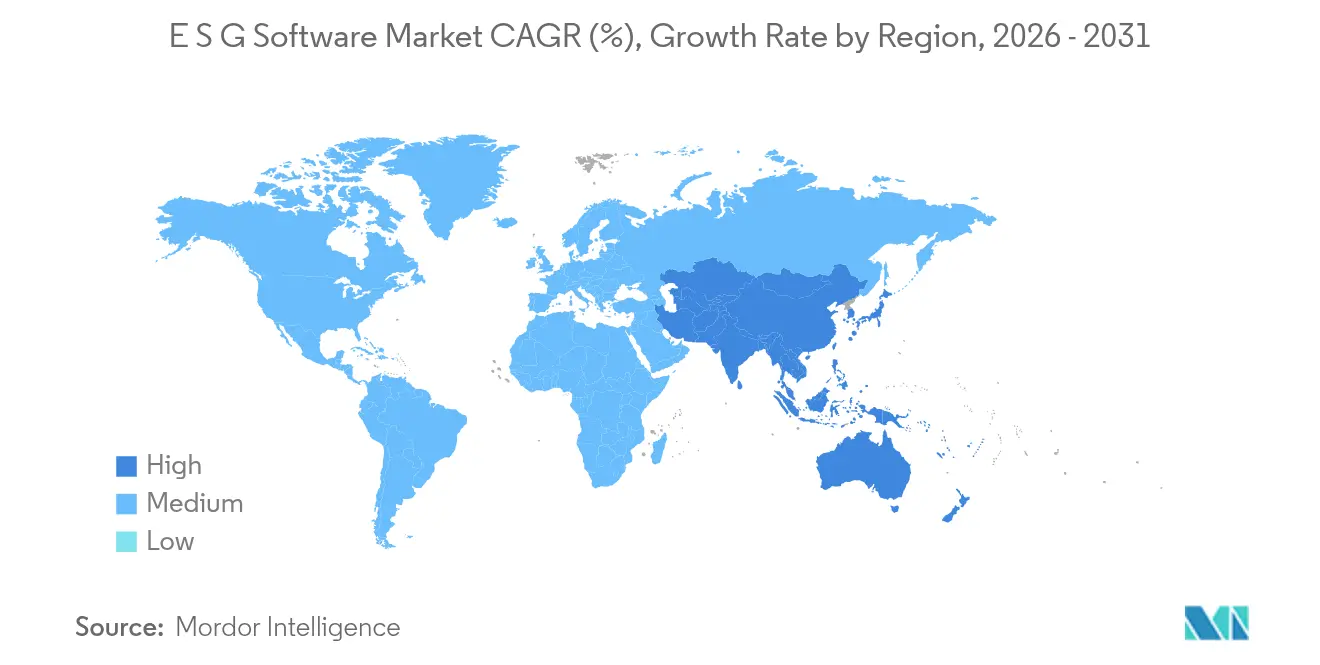
| Fastest Growing Market | Asia Pacific |
| Largest Market | Europe |
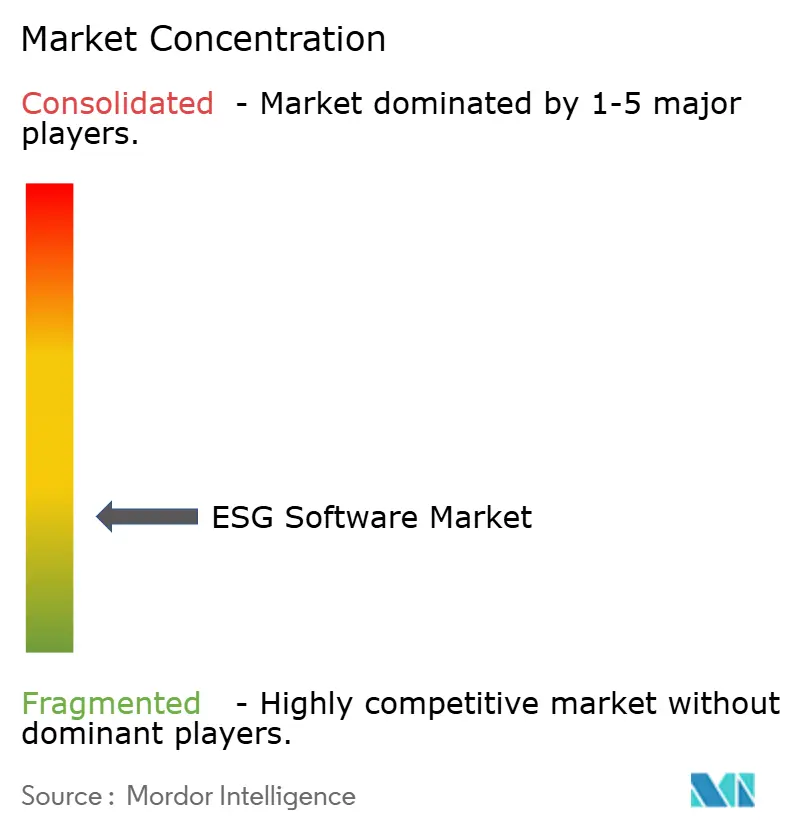
| Market Concentration | Low |
Major Players*Disclaimer: Major Players sorted in no particular order Image © Mordor Intelligence. Reuse requires attribution under CC BY 4.0. | |
ESG Software Market Analysis by Mordor Intelligence
The ESG software market size in 2026 is estimated at USD 4.78 billion, growing from 2025 value of USD 4.1 billion with 2031 projections showing USD 10.31 billion, growing at 16.62% CAGR over 2026-2031. Rapid growth springs from converging regulatory mandates, mounting investor scrutiny, and technology advances that simplify data aggregation and reporting. Europe’s Corporate Sustainability Reporting Directive (CSRD) and the United States Securities and Exchange Commission (SEC) climate rules now obligate thousands of firms to disclose standardized environmental, social, and governance (ESG) metrics, accelerating global demand for purpose-built platforms. Artificial intelligence (AI) and blockchain innovations further elevate the ESG software market by automating data quality checks and ensuring immutable audit trails. Cloud-native deployment lowers the entry barrier for small and medium enterprises (SMEs), while rising expectations for supply-chain transparency keep spending high across manufacturing, retail, and energy verticals.
Key Report Takeaways
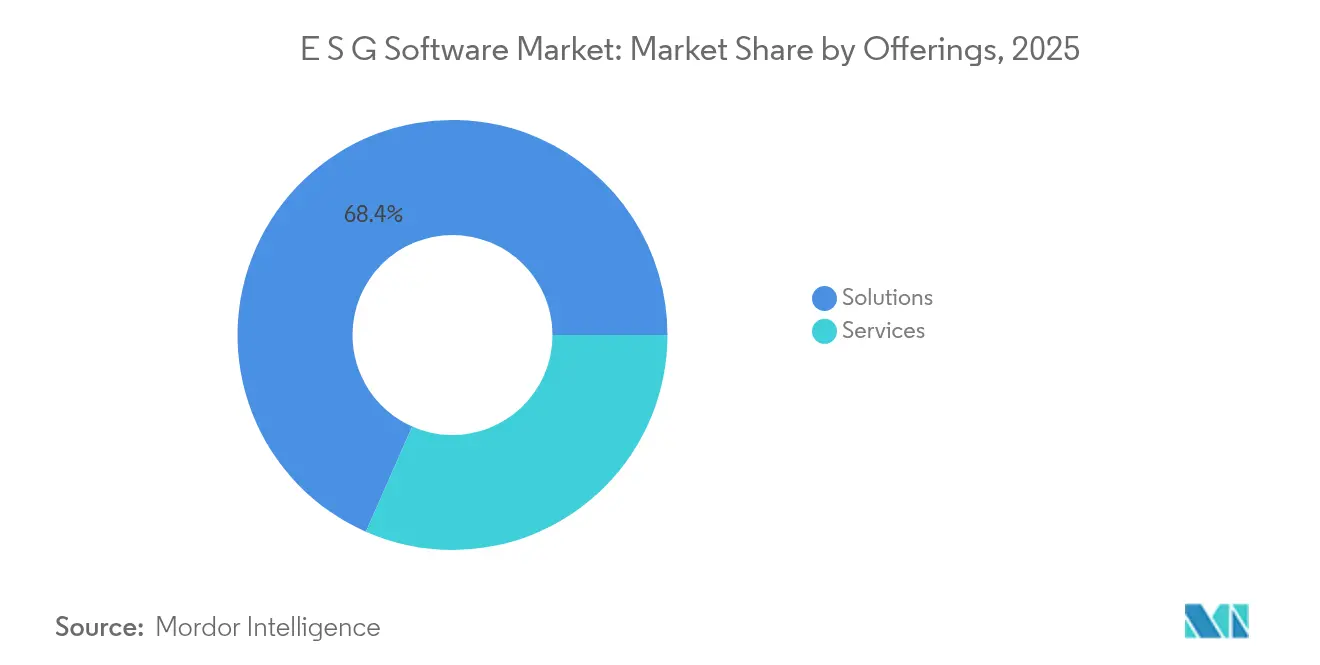
- By offering, solutions led with 68.40% revenue share in 2025, whereas services are forecast to grow at an 18.06% CAGR through 2031.
- By deployment, cloud accounted for 75.30% of the ESG software market share in 2025, while hybrid models are projected to expand at 19.9% CAGR to 2031.
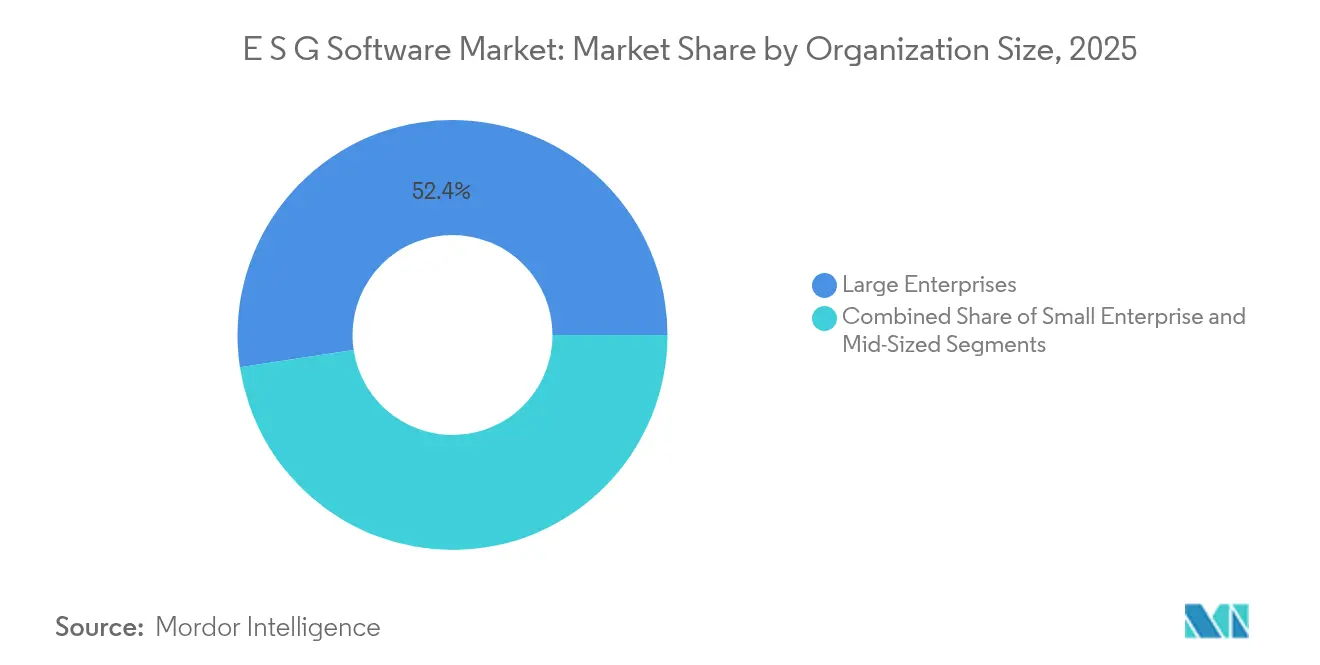
- By organization size, large enterprises held 52.40% of the ESG software market share in 2025, yet small enterprises are advancing at 22.05% CAGR during 2026-2031.
- By functionality, reporting and disclosure tools captured 38.10% of the ESG software market size in 2025; scenario analysis and forecasting are set to rise at a 24.3% CAGR to 2031.
- By end-user industry, banking & financial services commanded 24.60% of the ESG software market size in 2025, while energy & utilities will post the fastest 19.85% CAGR through 2031.
- By geography, Europe led with 34.90% revenue share in 2025, whereas Asia-Pacific is advancing at a 21.25% CAGR between 2026-2031.
Note: Market size and forecast figures in this report are generated using Mordor Intelligence’s proprietary estimation framework, updated with the latest available data and insights as of 2026.
Global ESG Software Market Trends and Insights
Drivers Impact Analysis*
| Driver | (~) % Impact on CAGR Forecast | Geographic Relevance | Impact Timeline |
|---|---|---|---|
| Regulatory push for standardized ESG disclosures | +4.2% | Global; strongest in EU and US | Medium term (2–4 years) |
| Investor & stakeholder pressure for transparency | +3.8% | Global; concentrated in developed markets | Short term (≤ 2 years) |
| Operational efficiency gains via centralized ESG data | +2.9% | Global; early adoption by large enterprises | Medium term (2–4 years) |
| Rising adoption of cloud-native ESG platforms among SMEs | +2.1% | APAC and North America | Long term (≥ 4 years) |
| AI-powered predictive analytics enabling proactive risk management | +1.8% | North America and Europe | Long term (≥ 4 years) |
| Tokenization & blockchain for immutable ESG data provenance | +1.2% | Europe and APAC | Long term (≥ 4 years) |
| Source: Mordor Intelligence | |||
Regulatory Push for Standardized ESG Disclosures
Global policymakers have synchronized sustainability rules, forcing firms to align with CSRD in Europe, SEC climate directives in the United States, and similar statutes in California and Asia-Pacific. The CSRD alone expands mandatory reporting to more than 50,000 companies, requiring double materiality assessments that many legacy systems cannot support.[2]Autorité des Marchés Financiers, “Corporate Sustainability Reporting Directive (CSRD): EFRAG and the European Commission Publish Implementation Guidance and FAQs,” amf-france.org Parallel SEC rules oblige large accelerated filers to disclose Scope 1 and Scope 2 emissions starting with fiscal year 2025, intensifying demand for multi-framework compliance engines sec.gov. Vendors that embed pre-mapped disclosure templates and audit-ready evidence repositories have become preferred partners, especially among global multinationals navigating overlapping frameworks.
Investor & Stakeholder Pressure for Transparency
Institutional investors link access to capital with granular ESG performance data. European retail banking research indicates 24% of customers would switch banks over poor ESG credentials. Corporations such as Digital Realty already track 66% renewable energy consumption and evaluate 60% of their suppliers for ESG risks using dedicated software, signaling how real-time dashboards influence stakeholder confidence. Green bond volumes continue to climb, so automated investor reporting modules and API-level integrations with treasury systems have become must-have features for CFOs.
Operational Efficiency Gains via Centralized ESG Data
Aggregating sustainability metrics within a single platform slashes manual workloads and eliminates conflicting spreadsheets. Japanese conglomerates adopting Sherpa & Company’s SmartESG cut data-collection hours by up to 70% while aligning with local disclosure rules. Companies now embed ESG key performance indicators (KPIs) inside enterprise resource planning (ERP) systems, streamlining everything from energy use to supplier code-of-conduct audits. The payoff includes quicker validation cycles, near-real-time carbon footprint insights, and shared visibility for cross-functional teams.
Rising Adoption of Cloud-Native ESG Platforms Among SMEs
Because CSRD and similar mandates extend to smaller organizations, demand is rising for subscription-based offerings that remove heavy upfront investment. Platforms such as SmartHead and VERSO automate double materiality assessments and visualize material risks in guided dashboards. Studies show cloud systems help SMEs overcome financial and technical hurdles associated with ESG reporting. Robust adoption in China, Singapore, and North America underpins the ESG software market’s long-term growth trajectory among enterprises with fewer than 250 employees.
Restraints Impact Analysis*
| Restraint | (≈) % Impact on CAGR Forecast | Geographic Relevance | Impact Timeline |
|---|---|---|---|
| High implementation & integration costs for legacy-heavy industries | -2.8% | Global; acute in manufacturing and utilities | Medium term (2–4 years) |
| Data quality & fragmentation across global supply chains | -2.1% | Global; amplified in complex supply chains | Short term (≤ 2 years) |
| Source: Mordor Intelligence | |||
High Implementation & Integration Costs for Legacy-Heavy Industries
Industrial enterprises with proprietary control systems face steep expenses retrofitting ESG data feeds. Manufacturers expect to add staff and adopt AI to meet CSRD and SEC requirements, yet early pilots expose budget overruns tied to outdated data architectures.[1]Manufacturers Alliance, “Manufacturers Contend with Increasing ESG Regulations,” manufacturersalliance.org Hospitals must connect patient management systems with emissions calculators to comply with EU taxonomy, further inflating IT project scopes envoria.com. Utilities upgrading data centers confront similar costs because 89% of technology leaders now prioritize sustainability metrics in procurement. Long integration timelines and custom connectors slow adoption, dampening overall CAGR.
Data Quality & Fragmentation Across Global Supply Chains
Supply chains stretch across jurisdictions with varied disclosure laws, resulting in inconsistent data formats and gaps. New rules such as the Forced Labor Regulation in the European Union require companies to evidence ethical sourcing, a task complicated by multilevel supplier networks. The University of Tennessee’s Climate Change Index reveals how country-level climate risks intensify sourcing volatility. Firms now deploy AI-driven validation layers to reconcile disparate datasets, but adoption remains uneven among tier-2 and tier-3 suppliers, limiting near-term market acceleration.
*Our forecasts treat driver/restraint impacts as directional, not additive. The impact forecasts reflect baseline growth, mix effects, and variable interactions.
Segment Analysis
By Offering: Services Accelerate Despite Solutions Dominance
Solutions generated the majority of revenue in 2025, yet service engagements such as integration, advisory, and managed reporting are expanding at 18.06% CAGR through 2031. Implementation projects often pair core ESG platforms with carbon accounting, product stewardship, and audit modules, spurring demand for multi-year consulting contracts. Vendors with standardized delivery frameworks shorten deployment cycles, appealing to manufacturers retrofitting enterprise resource planning suites. Meanwhile, the ESG software market size for integration services is projected to climb steadily as firms outsource complex supplier data onboarding to domain specialists. Managed services remain an emerging niche, but rising governance obligations suggest an uptick as organizations pivot to “compliance-as-a-service” to control costs.
Second-order impacts include heightened consolidation activity: platform providers increasingly acquire boutique consultancies to bundle software licenses with delivery capacity. Clients value single-provider accountability, pushing vendors to broaden domain knowledge across regulations, industry benchmarks, and assurance standards. Over the forecast period, the ESG software market will likely blur the line between product and professional service as holistic transformation partnerships become standard.


By Deployment: Hybrid Cloud Emerges as Growth Leader
Although multitenant cloud remains the primary deployment model, government procurement policies and data-residency requirements lift demand for hybrid architecture. The ESG software market size for hybrid deployments is set to record the fastest CAGR, driven by energy utilities and public firms that must retain sensitive data on-premise while leveraging cloud analytics for scenario planning. Organizations balancing sovereignty with scalability adopt containerized micro-services that orchestrate workloads across private data centers and sovereign cloud zones. Software vendors have responded by adding policy-based data routing, encryption, and zero-trust frameworks.
Cloud supremacy continues because subscription models align with CSRD phase-in schedules. Software upgrades integrate new disclosure templates without customer downtime, critical when Europe refines European Sustainability Reporting Standards. For high-volume data ingest—such as IoT sensors monitoring Scope 1 emissions—elastic cloud storage avoids capital outlay. ESG software market share will remain concentrated around cloud first movers; however, firms with multilayer hybrid roadmaps are capturing fast-growth, regulation-sensitive verticals.
By Organization Size: SME Adoption Accelerates Market Expansion
Large enterprises still account for over half of total revenue, but the small-enterprise segment shows the steepest climb, posting 22.05% CAGR. Automated materiality workflows, pay-as-you-go licensing, and pre-configured compliance templates let SMEs sidestep technical complexity. The U.S. Chamber of Commerce points out that small businesses form more than 90% of domestic firms yet lack structured ESG reporting processes. SaaS newcomers court this audience with bite-sized dashboards and guided checklists, opening an addressable market that was previously untapped because of cost and skill hurdles.
Meanwhile, mid-market firms bridge enterprise-grade functionality and SME agility, becoming early adopters of advanced analytics such as supplier risk heatmaps. Platform providers are introducing tiered product editions to cater to each size segment without code forks, protecting profit margins and widening reach.
By Functionality: Advanced Analytics Drive Innovation
Reporting modules remain the entry point for most buyers, covering ESRS, GRI, and TCFD mappings. Yet competitive differentiation now centers on scenario analysis engines capable of simulating climate pathways, policy shocks, and price-on-carbon models. This shift is visible in the ESG software market size allocations, where predictive analytics is set to outpace all other functionalities, reflecting a 24.3% CAGR. Data aggregation, materiality assessment, and benchmarking provide essential groundwork, but forward-looking tools unlock higher return on investment by linking sustainability to strategic decisions such as site expansion or supplier shifts.
Vendors embed machine learning algorithms that detect anomalies in self-reported supplier data, raising data integrity. Stakeholder engagement portals integrate chatbots and sentiment analysis to gauge consumer perception, illustrating how ESG software has evolved beyond disclosure toward holistic performance management.
By End-User Industry: Energy Sector Leads Growth Transformation
Financial institutions top revenue due to early regulatory exposure and the need to align credit portfolios with net-zero trajectories. Yet the energy and utilities sector—facing decarbonization deadlines and grid innovation—exhibits the highest CAGR, spurred by carbon-intensity targets and renewable integration mandates. Utilities pilot greenhouse-gas (GHG) management suites that ingest real-time SCADA data to compute emissions factors per megawatt hour, a leap from quarterly spreadsheets. Manufacturing, healthcare, and retail follow closely, each contending with sector-specific regulations and Scope 3 reporting expectations.
Crossover adoption is rising: banks fund decarbonization projects contingent on auditable ESG data, incentivizing borrowers to adopt the same platforms the lenders use for loan-book tracking. Industry specialization therefore becomes a key differentiation lever for software vendors.
Geography Analysis
Europe retains leadership owing to unified policy frameworks and strong investor activism. The CSRD, effective from January 2024, triggered a wave of platform renewals and expansions. Multinational corporations headquartered in France, Germany, and the Nordics scale up integrated suites that map double materiality outcomes. The ESG software market size attached to Europe thus shows stable yet mature expansion.
Asia-Pacific exhibits the steepest growth trajectory. China mandates sustainability reports for more than 300 listed entities by 2026, prompting local and foreign suppliers to adopt standardized toolsets. Singapore will require climate disclosures from all listed companies in 2025, and Japan promotes AI-driven ESG scoring agents, as demonstrated by HEROZ and NZAM’s joint launch in 2025. Governments also establish green-finance taxonomies, so cross-border investors insist on common data definitions, driving regional convergence.
North America advances at a steady clip. SEC rules spur public companies to automate Scope 1 and Scope 2 tracking, while state-level initiatives—such as California’s Climate Accountability Package—extend disclosure to suppliers. A thriving venture ecosystem funds AI-first ESG startups, and utilities like Xcel Energy pilot carbon-monitoring software to meet net-zero commitments.
The Middle East and Africa remain nascent but display early interest, especially among sovereign wealth funds and national oil companies pursuing diversification and low-carbon strategies. Pilot projects concentrate in Gulf Cooperation Council nations where compliance with global capital-market expectations becomes essential.

Competitive Landscape
The ESG software market features moderate fragmentation, with specialists coexisting alongside consolidated platforms. Carbon-accounting providers, supply-chain auditors, and stakeholder-engagement tools still address discrete pain points, yet buyer preference is pivoting to unified platforms that avoid multiple integrations. Platform vendors answer by snapping up niche innovators—Asuene’s purchase of SMBC’s “Sustana” carbon solution and aiESG’s investment round with Fukuoka Financial Group illustrate the trend toward ecosystem building prtimes.jp.
Technological differentiation focuses on AI knowledge graphs that cross-link emission factors, policy libraries, and real-time sensor feeds. Patents on blockchain-backed carbon tracking grant early-mover advantage in supply-chain verification. Large enterprise software firms embed ESG modules within core finance and HR suites, leveraging existing client bases to capture wallet share. Meanwhile, managed-service providers partner with software vendors to bundle assurance and attestation, reinforcing stickiness.
Market forces suggest continued consolidation as regulatory complexity grows. Vendors with end-to-end coverage—spanning data collection, analytics, scenario modeling, and audit readiness—will likely secure premium valuations, while pure play point solutions face acquisition or niche specialization.
ESG Software Industry Leaders
Datamaran, Ltd.
Ecovadis SAS
NAVEX Global, Inc.
SAS Institute Inc.
OneTrust, LLC
- *Disclaimer: Major Players sorted in no particular order

Recent Industry Developments
- June 2025: HEROZ and NZAM deployed an AI-powered ESG evaluation system automating data retrieval across 57 criteria, easing analyst workloads and improving score consistency
- May 2025: Asuene bought SMBC Group’s “Sustana” GHG visualization cloud and raised Series C2 funding to accelerate European expansion
- April 2025: aiESG secured investment from Fukuoka Financial Group to scale its “aiESG Flow” service for supply-chain impact mapping
- April 2025: Sherpa & Company launched SmartESG for Japan Airport Building and Nikon, integrating centralized non-financial data collection
- January 2024: CSRD entered into force, applying European Sustainability Reporting Standards to more than 50,000 companies


Research Methodology Framework and Report Scope
Market Definitions and Key Coverage
Our study defines the ESG software market as all off-the-shelf or cloud-delivered applications that collect, manage, analyze, and disclose environmental, social, and governance metrics across an organization's operations as well as its supply chain.
Scope Exclusion. We deliberately leave out stand-alone ESG rating services and traditional EHS incident-management tools because their revenue pools are triggered by different buying criteria.
Segmentation Overview
- By Offering
- Solutions
- Sustainability Reporting and Disclosure Platforms
- Carbon Accounting Software
- Supply-Chain ESG Management
- Risk and Compliance Management
- Audit and Assurance Tools
- Services
- Implementation and Integration
- Consulting and Advisory
- Training and Support
- Managed Services
- Solutions
- By Deployment
- Cloud (SaaS)
- On-Premise
- Hybrid
- By Organization Size
- Large Enterprises (more than 1,000 employees)
- Mid-Sized Enterprises (250 to 999)
- Small Enterprises (less than 250)
- By Functionality
- Data Collection and Aggregation
- Materiality Assessment
- Analytics and Benchmarking
- Reporting and Disclosure Automation
- Scenario Analysis and Forecasting
- Stakeholder Engagement
- By End-User Industry
- BFSI
- IT and Telecom
- Manufacturing
- Automotive
- Chemicals and Materials
- Heavy Industry and Engineering
- Retail and E-commerce
- Healthcare and Life Sciences
- Energy and Utilities
- Government and Public Sector
- Others (Education, Hospitality, etc.)
- By Geography
- North America
- United States
- Canada
- Mexico
- South America
- Brazil
- Argentina
- Rest of South America
- Europe
- United Kingdom
- Germany
- France
- Italy
- Spain
- Netherlands
- Russia
- Rest of Europe
- Asia-Pacific
- China
- Japan
- India
- South Korea
- Australia and New Zealand
- ASEAN-5
- Rest of Asia-Pacific
- Middle East and Africa
- Israel
- Saudi Arabia
- United Arab Emirates
- Turkey
- Rest of Middle East
- Africa
- South Africa
- Nigeria
- Kenya
- Rest of Africa
- North America
Detailed Research Methodology and Data Validation
Primary Research
We interviewed software product managers, ESG leads at banks, heavy-industry sustainability officers, and regional implementation partners across North America, Europe, and Asia-Pacific. Their insights refined assumptions on cloud-migration speed, support-service attach rates, and mid-market price sensitivity that were ambiguous in secondary sources.
Desk Research
Mordor analysts mined open-access regulations such as the EU Corporate Sustainability Reporting Directive and the US SEC climate-disclosure draft, trade association papers from SASB and IFRS, and procurement notices logged in Tenders Info to size compliance-driven demand. Financial cues flowed from sustainability sections of Form 10-Ks, CDP responses, and vendor investor decks; enterprise counts and payroll bands were compiled with D&B Hoovers and Dow Jones Factiva to anchor potential license volumes. This list is illustrative; many other public and paid feeds supported data collection, validation, and clarification.
Market-Sizing & Forecasting
Our model begins with a top-down reconstruction of potential spend. Eligible enterprises by size tier are matched with reporting thresholds to gauge likely buyers, and then multiplied by median annual license values drawn from contract disclosures. Bottom-up checks, vendor revenue snippets, and sampled deal analytics temper the totals before final calibration. Key variables include entities under CSRD scope, average audit hours saved, carbon-pricing trajectories, cloud penetration in GRC stacks, and venture funding flowing to ESG tech. A multivariate regression feeds these inputs into an ARIMA forecast covering 2025-2030.
Data Validation & Update Cycle
Outputs face variance scans against patent-filing trends and enterprise software-spend indices, followed by a two-step analyst peer review. We refresh each dataset annually and issue interim updates for material regulatory shifts or mega deals; an analyst reruns checks just before publication so clients always receive the latest view.
Why Mordor's ESG Software Baseline Commands Reliability
Published estimates often diverge because firms vary in revenue scope, currency treatment, and refresh cadence.
Major gap drivers include whether services revenue is blended, if carbon-accounting tools inside broader EHS suites are double counted, and the inflation factors applied to multi-year contracts.
Benchmark comparison
| Market Size | Anonymized source | Primary gap driver |
|---|---|---|
| USD 4.10 B (2025) | Mordor Intelligence | None |
| USD 1.24 B (2025) | Regional Consultancy A | Excludes SME cloud subscriptions and bases growth on 2024 actuals |
| USD 0.98 B (2024) | Industry Association B | Counts only environmental modules, omitting governance analytics |
| USD 1.18 B (2025) | Global Consultancy C | Combines on-prem licences yet ignores SaaS renewals |
The comparison shows that Mordor's disciplined scoping, mixed-method modeling, and annual refresh cadence create a transparent baseline that decision-makers can trace, replicate, and stress-test with confidence.


Key Questions Answered in the Report
What is the current size of the ESG software market?
The ESG software market reached USD 4.78 billion in 2026 and is projected to expand to USD 10.31 billion by 2031 at a 16.62% CAGR.
Which region leads the ESG software market?
Europe leads with 34.90% revenue share in 2025 thanks to early adoption of mandatory disclosure frameworks such as the CSRD.
Which segment is growing fastest within the ESG software market?
Scenario analysis and forecasting functionality will rise at 24.3% CAGR through 2031 as firms move from compliance to forward-looking risk management.
Why are SMEs adopting ESG software at a rapid rate?
Cloud subscription models, pre-configured compliance templates, and lower upfront costs help SMEs overcome financial and technical barriers, resulting in a 22.05% CAGR for small-enterprise adoption.
How is AI influencing ESG software?
AI automates data extraction, anomaly detection, and predictive modeling, cutting report preparation costs by over 90% in some pilot projects and enabling proactive sustainability strategies.
What challenges may slow ESG software deployment?
High integration costs in legacy-heavy industries and fragmented supplier data remain the main obstacles, reducing global CAGR potential by 2-3 percentage points despite strong regulatory tailwinds.
Page last updated on:


