Corporate Performance Management Market Size and Share
Market Overview
| Study Period | 2020 - 2031 |
|---|---|
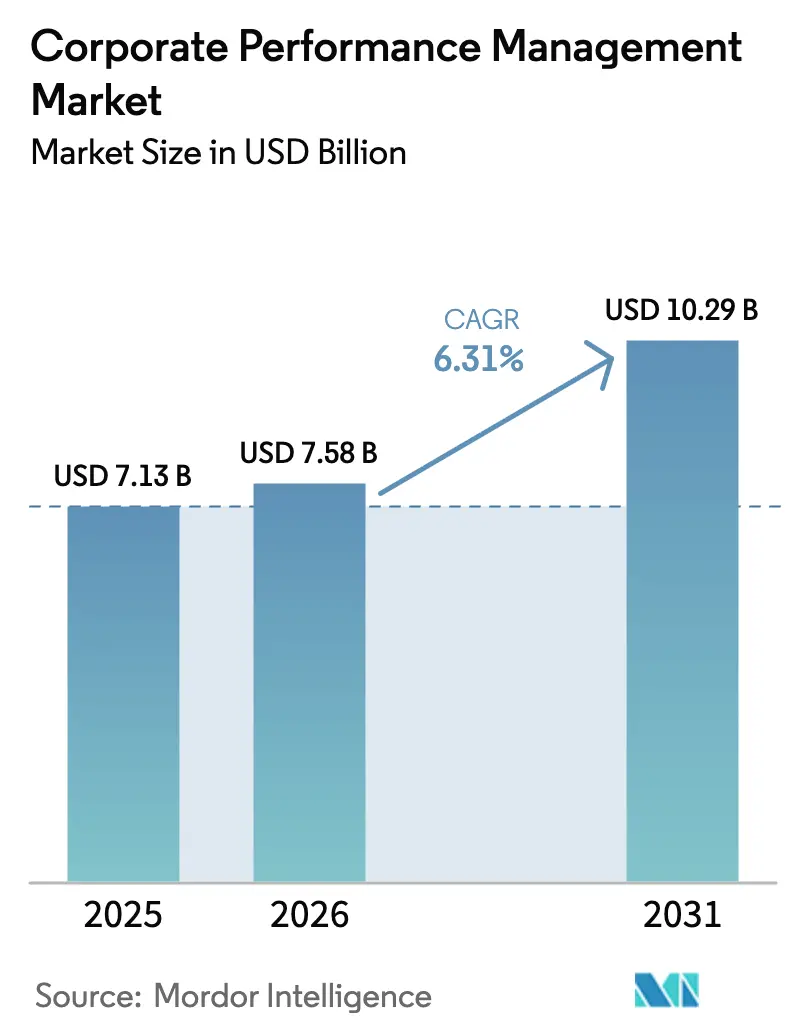
| Market Size (2026) | USD 7.58 Billion |
| Market Size (2031) | USD 10.29 Billion |
| Growth Rate (2026 - 2031) | 6.31% CAGR |
| Fastest Growing Market | Asia Pacific |
| Largest Market | North America |
| Market Concentration | Medium |
Major Players *Disclaimer: Major Players sorted in no particular order Image © Mordor Intelligence. Reuse requires attribution under CC BY 4.0. | |
Corporate Performance Management Market Analysis by Mordor Intelligence
The Corporate Performance Management market size is expected to grow from USD 7.13 billion in 2025 to USD 7.58 billion in 2026 and is forecast to reach USD 10.29 billion by 2031 at 6.31% CAGR over 2026-2031. The upswing stems from mounting regulatory complexity, especially around ESG and SOX mandates, and the pivot from spreadsheet‐based processes to integrated, AI-enabled platforms that unify strategic, operational, and financial planning. Cloud deployment remains the dominant paradigm, propelled by lower infrastructure overhead, real-time collaboration, and seamless AI adoption. Demand is further buoyed by rapid SME digitalization in emerging economies, the rise of extended planning and analytics (xPandA), and expanding use cases in supply-chain resilience and workforce planning. Competitive dynamics reflect intensified vendor consolidation and private-equity confidence in platforms viewed as mission-critical for compliance and data-driven decision-making.
Key Report Takeaways
- By deployment mode, cloud-based platforms led with a 68.05% revenue share in 2025 in the Corporate Performance Management market and are advancing at an 8.07% CAGR through 2031.
- By organization size, large enterprises held 62.98% of the Corporate Performance Management market share in 2025, while SMEs post the highest projected CAGR at 7.74% to 2031.
- By function, finance accounted for 42.15% of the Corporate Performance Management market size in 2025, whereas supply-chain planning is expanding at a 7.44% CAGR.
- By end-user vertical, BFSI captured 29.11% of the Corporate Performance Management market in 2025; healthcare and life sciences are forecast to grow at a 6.86% CAGR.
- By geography, North America commanded 38.10% of 2025 revenue in the Corporate Performance Management market , yet Asia-Pacific is projected to lead growth at a 7.12% CAGR through 2031.
Note: Market size and forecast figures in this report are generated using Mordor Intelligence’s proprietary estimation framework, updated with the latest available data and insights as of 2026.
Global Corporate Performance Management Market Trends and Insights
Drivers Impact Analysis*
| Driver | (~) % Impact on CAGR Forecast | Geographic Relevance | Impact Timeline |
|---|---|---|---|
| Rising adoption of cloud-based CPM platforms | +1.8% | Global, with Europe lagging at 42% adoption vs North America 62% | Medium term (2-4 years) |
| Tightening regulatory and audit requirements | +1.5% | Global, concentrated in EU/UK for ESG, North America for SOX | Long term (≥ 4 years) |
| AI/ML-driven predictive and prescriptive analytics | +1.2% | North America and EU leading, APAC emerging | Medium term (2-4 years) |
| Expansion of xPandA for cross-functional planning | +1.0% | Global, enterprise-focused initially | Long term (≥ 4 years) |
| Continuous scenario planning for supply-chain shocks | +0.8% | Global, manufacturing-heavy regions prioritized | Short term (≤ 2 years) |
| ESG data integration into CPM dashboards | +0.7% | EU primary, expanding to North America and APAC | Medium term (2-4 years) |
| Source: Mordor Intelligence | |||
Rising adoption of cloud-based CPM platforms
Cloud migration reshapes deployment economics by eliminating on-premises infrastructure and enabling real-time collaboration across finance teams. In 2025, 79% of new CPM implementations are cloud-native, with adoption highest in North America, followed closely by Asia-Pacific, while Europe trails. Self-service planning now involves 68% of users, reducing IT dependence and compressing decision cycles. Vendors demonstrate value by consolidating ERP and CPM workloads on unified clouds, cutting both latency and operating costs. The widening adoption gap opens geographic whitespace for providers specializing in data-sovereignty and low-latency cloud zones.[1]Unit4 Communications, “Exploring the Future of Corporate Performance Management in 2025,” Unit4, unit4.com
Tightening regulatory and audit requirements
Converging financial and non-financial disclosure mandates, from EU CSRD to enhanced SEC XBRL tagging, require automated data lineage and auditable reporting. Asset managers must now substantiate sustainability claims and align 10-K filings with granular ledger detail. Integrated CPM suites that support double-materiality assessments and secure evidence repositories gain favor, while ISO-certified data centers become table stakes. Organizations unable to automate reconciliations incur higher compliance cost and slower report cycles, reinforcing platform demand.
AI/ML-driven predictive and prescriptive analytics
Predictive planning is used by 53% of enterprises, reflecting the need for timely, data-rich forecasts under economic volatility. Advanced models ingest macroeconomic and operational signals, boosting accuracy and flagging outliers before period close. Embedded AI workflows cut manual interventions, speed scenario creation, and surface anomalies within minutes, not days. Vendors differentiate on model transparency and governance features, ensuring auditability alongside speed. Early adopters report up to 10× faster planning cycles while maintaining data granularity.[2]IBM, “Financial Planning and Analysis with IBM Planning Analytics,” IBM, ibm.com
Expansion of xPandA for cross-functional planning
xPandA extends CPM beyond finance into supply chain, HR, and commercial functions, breaking silos and enabling single-source plans. Forty-one percent of organizations rank cross-functional integration as a top priority, seeking synchronized operational and financial views. Pre-configured content packages accelerate rollout by providing vertical-specific templates and live ERP connectivity. Implementations show cycle-time reductions from weeks to days, elevating agility and strategic alignment.
Restraints Impact Analysis*
| Restraint | (~) % Impact on CAGR Forecast | Geographic Relevance | Impact Timeline |
|---|---|---|---|
| High implementation and integration costs | -1.2% | Global, particularly SME segment | Short term (≤ 2 years) |
| Data-security and privacy concerns | -0.8% | EU/UK primary due to GDPR, expanding globally | Medium term (2-4 years) |
| Shortage of CPM/FPandA analytics talent | -0.6% | North America and EU concentrated | Long term (≥ 4 years) |
| Cultural resistance from non-finance functions | -0.4% | Global, enterprise-focused | Medium term (2-4 years) |
| Source: Mordor Intelligence | |||
High implementation and integration costs
Complex rollouts demand sizeable investments in software, integration, and change management. Multi-entity projects often span 12 weeks to 2 years, with cross-functional teams dedicating hundreds of hours. Connecting 150-plus legacy ERP systems magnifies scope and budget. Cloud subscription models partially offset capital outlay, yet full ROI depends on disciplined scope, robust data migration, and ongoing user enablement.
Data-security and privacy concerns
Centralized data stores heighten cyber-risk and regulatory scrutiny, especially under GDPR and emerging AI governance rules. Multinationals juggle data residency mandates, encryption standards, and role-based access to safeguard sensitive ledgers. ISO 27017/27018/27701 certifications and end-to-end encryption influence vendor selection. Added complexity arises when AI models require historical data, necessitating clear governance and explainability to meet audit requirements.
*Our forecasts treat driver/restraint impacts as directional, not additive. The impact forecasts reflect baseline growth, mix effects, and variable interactions.
Segment Analysis
By Deployment Mode: Cloud Dominance Accelerates Migration
Cloud platforms accounted for 68.05% of 2025 revenue, confirming their position as the primary delivery model for the Corporate Performance Management market. This segment is projected to post an 8.07% CAGR through 2031. Hybrid models persist in heavily regulated sectors that retain sensitive workloads on-premises yet tap cloud analytics for collaboration. The Corporate Performance Management market size attributed to cloud is widening fastest in Asia-Pacific, where adoption outpaces Europe by more than 25 percentage points. Continuous updates, embedded AI, and lower total cost propel conversions, while data-sovereignty features ease European concerns. Providers emphasize zero-downtime releases and single-tenant security to win risk-averse clients. On-premises deployments still serve air-gapped environments but face shrinking budgets and lengthier upgrade cycles. Competitive differentiation now pivots on cloud service level, scalability, and integrated AI pipelines, prompting legacy vendors to accelerate SaaS roadmaps.
In Europe, slower cloud uptake stems from data-localization directives and conservative IT governance, leaving room for lift-and-shift initiatives and vendor partnerships with sovereign-cloud providers. North American and Asia-Pacific enterprises, by contrast, expedite migration of consolidation, budgeting, and scenario planning workloads to unified cloud stacks, enabling cohesive governance and faster innovation. This regional divergence shapes product localization, pricing, and partner enablement strategies among market participants.


By Organization Size: SME Acceleration Drives Market Expansion
Large enterprises retained 62.98% of 2025 revenue, primarily due to multi-currency consolidation and stringent compliance needs. However, SMEs, the fastest-growing cohort at 7.74% CAGR, propel incremental gains in the Corporate Performance Management market. Cloud affordability, subscription pricing, and prebuilt templates decrease barriers, helping SMEs satisfy formal reporting and lending requirements. Asia-Pacific MSME digitalization programs and simplified capital-market listings further stimulate demand.
SMEs prioritize rapid deployment, Office-based interfaces, and minimal IT overhead, contrasting with enterprise preferences for extensibility and governance. Vendors respond with tiered editions, guided implementations, and in-product tutorials that compress time-to-value to weeks. At the upper end, conglomerates seek unified platforms to replace point solutions, enhancing data consistency and audit readiness. This bifurcation drives differentiated roadmaps: intuitive UX and AI-guided configuration for SMEs, versus open APIs, sandbox environments, and fine-grained security for large enterprises.
By Function: Supply Chain Planning Emerges as Growth Engine
Finance functions commanded 42.15% of 2025 revenue, yet supply-chain planning is set to record a 7.44% CAGR, the fastest in the Corporate Performance Management market. Continuous disruptions and ESG traceability pressures elevate operational data within CPM workflows. Integrated planning marries production schedules with cash-flow forecasts, enabling single connected plans that compress re-forecast cycles. Organizations leveraging xPandA report double-digit improvements in forecast accuracy and days-inventory outstanding.
Sales and HR increasingly embed CPM modules for quota setting, workforce capacity, and compensation modeling. AI-infused demand sensing enhances revenue forecasts, while driver-based HR models align hiring plans with strategic targets. Cross-functional data lakes feed predictive engines that flag supply bottlenecks and margin erosion early, tightening the finance–operations feedback loop.

By End-user Vertical: Healthcare Accelerates Amid Regulatory Complexity
BFSI retained the dominant 29.11% stake thanks to SOX, IFRS, and capital-adequacy rules that mandate granular data lineage. Healthcare and life sciences, expanding at 6.86% CAGR, now represent the most dynamic vertical in the Corporate Performance Management market. Rising R&D spend, clinical-trial cost pressures, and stringent FDA/EMA reporting spur adoption of unified planning that tracks milestones, budgets, and compliance metrics. Manufacturers turn to CPM for emissions accounting, asset utilization, and operational resilience, while retailers integrate omnichannel sales data to optimize inventory and promotions.
Telecommunications firms deploy CPM for infrastructure ROI modeling and subscription revenue planning, and energy companies use it for rate-case modeling and asset retirement obligations. Public-sector entities adopt performance-based budgeting and citizen-experience metrics, reflecting a broadening scope of CPM usage across service delivery.
Geography Analysis
North America led with a 38.10% share in 2025, underpinned by mature enterprise-software ecosystems, deep implementation talent, and early AI adoption across finance and operations. Enterprises prioritize integrated AI scenarios and compliance automation, reinforcing vendor investment in regional data centers and partner certification. Europe follows, driven by multi-layered ESG mandates that demand unified non-financial and financial disclosures within trusted platforms. Data-privacy obligations and sovereignty concerns slow cloud conversion but favor providers offering in-region hosting and robust encryption.
Asia-Pacific is the fastest-growing geography at 7.12% CAGR, fueled by government-backed MSME digitization grants, fintech expansion, and capital-market reforms. The Corporate Performance Management market size across Asia-Pacific mid-market firms is projected to double by 2030 as local integrators bundle CPM with ERP rollouts. Australian and Japanese enterprises emphasize ESG assurance, while Southeast Asian companies focus on cash-flow forecasting amid currency volatility. South America exhibits a steady uptake as public company reforms and foreign investment inflows demand modern planning tools. In the Middle East and Africa, economic diversification and national vision programs trigger initial deployments, often starting with budgeting and gradually layering analytics.


Competitive Landscape
The Corporate Performance Management market remains moderately fragmented. ERP giants, Oracle, SAP, and Microsoft, leverage installed bases to cross-sell tightly integrated CPM modules. Pure-play vendors such as OneStream, Anaplan, and Workday Adaptive Planning compete through domain focus, rapid innovation, and partner ecosystems. OneStream surpassed USD 450 million ARR in 2023, scaling to 1,400 customers by unifying consolidation, planning, and reporting on a single code base. Private-equity activity accelerates consolidation: Thoma Bravo’s USD 10.7 billion Anaplan take-private and Vista Equity-Blackstone’s USD 8.4 billion Smartsheet buyout underscore investor confidence in mission-critical planning platforms.
Strategic differentiation centers on embedded AI, open architectures, and vertical packages. IBM Planning Analytics integrates watsonx AI for transparent forecasting, while SAP pairs business-technology platform services with live ERP data to shorten model-build time. Vendors augment offerings through marketplaces and low-code extensions, allowing customers to tailor industry workflows. Regional challengers focus on sovereign clouds and regulatory localization. As top players capture larger wallet share, late-stage startups either specialize or seek strategic exits, foreshadowing continued merger activity.
Corporate Performance Management Industry Leaders
Oracle Corporation
SAP SE
IBM Corporation
Host Analytics Inc.
Adaptive Insights LLC (Workday Adaptive Planning)
- *Disclaimer: Major Players sorted in no particular order

Recent Industry Developments
- September 2024: Vista Equity Partners and Blackstone acquired Smartsheet for USD 8.4 billion, providing shareholders a 41% premium and signaling sustained private-equity interest in allied work-management tools that dovetail with CPM workflows.
- August 2024: Bridgepoint Group initiated takeover discussions for Esker SA, a Paris-listed finance-automation vendor whose offerings complement core CPM processes.
- June 2024: Wolters Kluwer released an APAC manufacturing white paper highlighting AI-powered CPM deployments at Ricoh and AGFA to meet supply-chain and ESG pressures.
- May 2024: OneStream introduced its Sensible AI suite featuring generative AI, automated anomaly detection, and ML-driven scenario modeling for enterprise clients.


Global Corporate Performance Management Market Report Scope
Corporate performance management (CPM) is software used by corporations and organizations to manage organizational strategies and goals via predefined standard methodologies, budgeting, forecasting, data analysis, processing, and reporting to monitor and control the performance of an organization. The CPM procedure is essential for businesses to save costs, improve operating methods, and improve financial planning. CPM enables enterprises to use proven and well-tested methods and processes to enhance and expand their firm's management. CPM is a collection of intellectual business tools to measure the performance of an organization.
The corporate performance management market is segmented by mode of deployment (on-premise and cloud), by the size of the organization (small and medium enterprises and large enterprises), by end-user industry (retail, BFSI, manufacturing, energy, and power, and other end-user industries) and by geography (North America, Europe, Asia Pacific, Latin America, Middle East, and Africa). The market sizes and forecasts are provided in terms of value in USD for all the above segments.
| On-Premises |
| Cloud-Based |
| Hybrid |
| Small and Medium Enterprises (SMEs) |
| Large Enterprises |
| Finance |
| Human Resources |
| Supply Chain |
| Sales and Marketing |
| Banking, Financial Services and Insurance (BFSI) |
| Retail and E-commerce |
| Manufacturing |
| Healthcare and Life Sciences |
| IT and Telecommunications |
| Energy and Utilities |
| Government and Public Sector |
| Other End-user Verticals |
| North America | United States |
| Canada | |
| South America | Brazil |
| Argentina | |
| Rest of South America | |
| Europe | Germany |
| United Kingdom | |
| France | |
| Italy | |
| Spain | |
| Rest of Europe | |
| Asia-Pacific | China |
| Japan | |
| India | |
| South Korea | |
| Rest of Asia-Pacific | |
| Middle East | United Arab Emirates |
| Saudi Arabia | |
| Rest of Middle East | |
| Africa | South Africa |
| Rest of Africa |
| By Deployment Mode | On-Premises | |
| Cloud-Based | ||
| Hybrid | ||
| By Organization Size | Small and Medium Enterprises (SMEs) | |
| Large Enterprises | ||
| By Function | Finance | |
| Human Resources | ||
| Supply Chain | ||
| Sales and Marketing | ||
| By End-user Vertical | Banking, Financial Services and Insurance (BFSI) | |
| Retail and E-commerce | ||
| Manufacturing | ||
| Healthcare and Life Sciences | ||
| IT and Telecommunications | ||
| Energy and Utilities | ||
| Government and Public Sector | ||
| Other End-user Verticals | ||
| By Geography | North America | United States |
| Canada | ||
| South America | Brazil | |
| Argentina | ||
| Rest of South America | ||
| Europe | Germany | |
| United Kingdom | ||
| France | ||
| Italy | ||
| Spain | ||
| Rest of Europe | ||
| Asia-Pacific | China | |
| Japan | ||
| India | ||
| South Korea | ||
| Rest of Asia-Pacific | ||
| Middle East | United Arab Emirates | |
| Saudi Arabia | ||
| Rest of Middle East | ||
| Africa | South Africa | |
| Rest of Africa | ||


Key Questions Answered in the Report
What is the projected value of the Corporate Performance Management market by 2031?
The market is forecast to reach USD 10.29 billion by 2031.
Which deployment model shows the fastest growth?
Cloud platforms are expanding at an 8.07% CAGR through 2031, outpacing on-premises and hybrid models.
Why are SMEs accelerating adoption of Corporate Performance Management solutions?
Subscription pricing, prebuilt templates, and regulatory formalization across emerging economies lower barriers and drive an 7.74% CAGR among SMEs.
Which function is witnessing the highest growth within CPM applications?
Supply-chain planning leads with a 7.44% CAGR as firms pursue xPandA for resilience and synchronized financial-operational planning.
Which region will register the quickest growth?
Asia-Pacific is projected to grow at a 7.12% CAGR, propelled by MSME digitization and capital-market reforms.
Page last updated on:


