Structural Health Monitoring Market Size and Share
Market Overview
| Study Period | 2019 - 2030 |
|---|---|
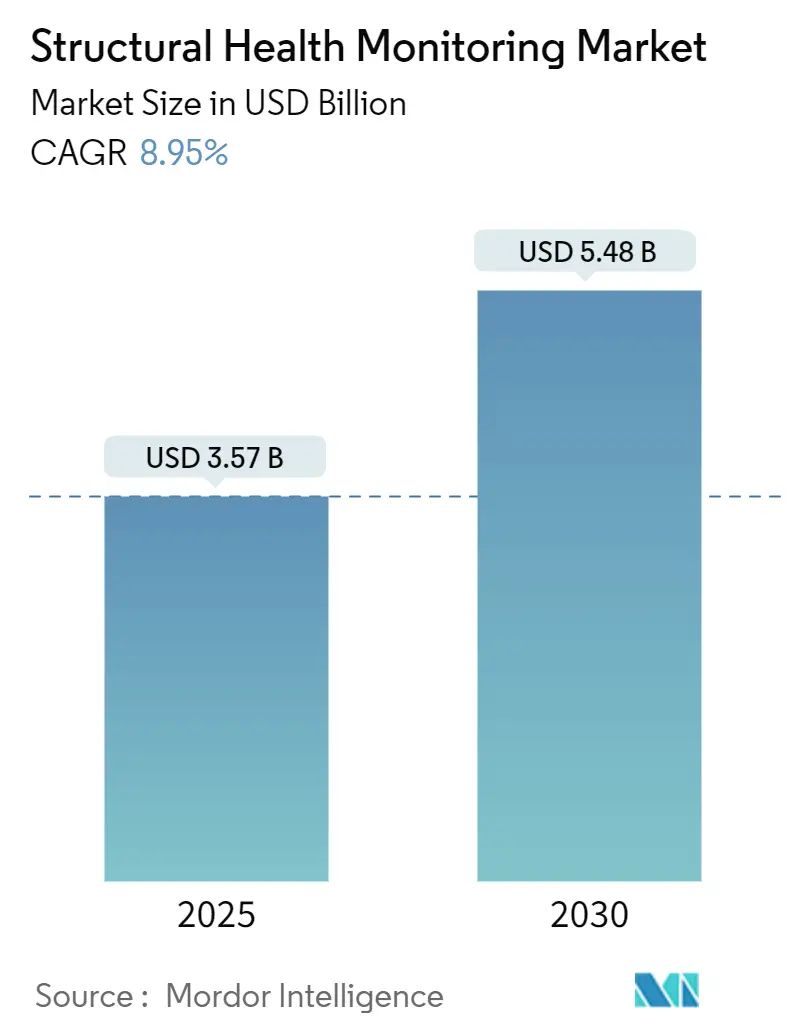
| Market Size (2025) | USD 3.57 Billion |
| Market Size (2030) | USD 5.48 Billion |
| Growth Rate (2025 - 2030) | 8.95% CAGR |
| Fastest Growing Market | Asia Pacific |
| Largest Market | North America |
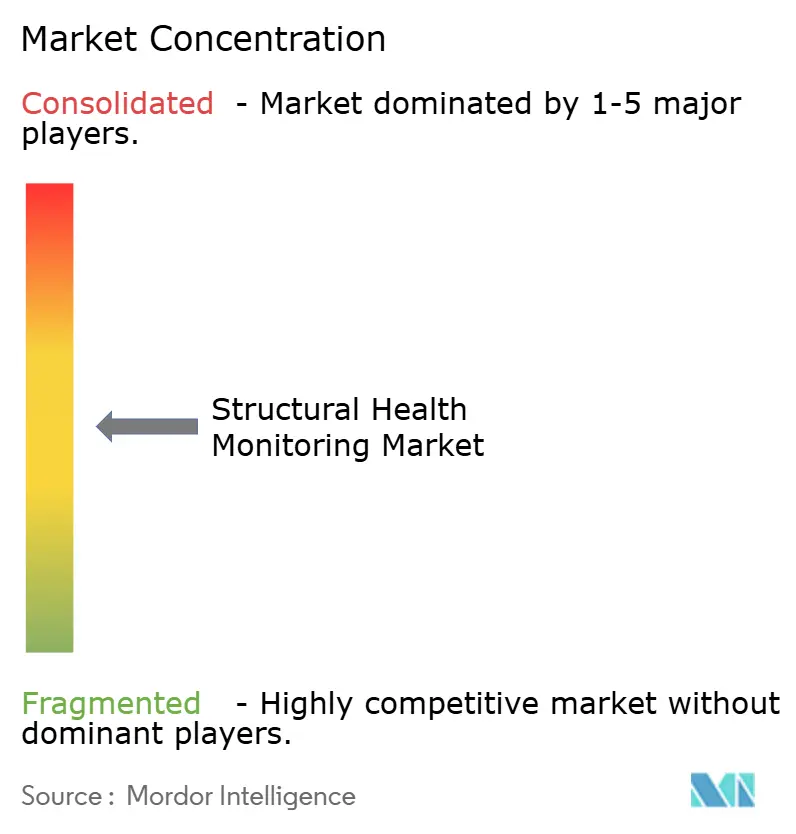
| Market Concentration | Medium |
Major Players *Disclaimer: Major Players sorted in no particular order Image © Mordor Intelligence. Reuse requires attribution under CC BY 4.0. | |
Structural Health Monitoring Market Analysis by Mordor Intelligence
The structural health monitoring market size reached USD 3.57 billion in 2025 and is forecast to climb to USD 5.48 billion by 2030, reflecting an 8.95% CAGR over the period. Continued transition from reactive inspection to predictive, sensor-rich asset management is the prime catalyst, supported by lower sensor prices, dense IoT connectivity, and analytics that convert high-frequency readings into actionable maintenance schedules. Civil agencies view continuous sensing as a cost-effective hedge against public-safety failures, insurers reward instrumented assets with premium reductions, and technology vendors increasingly bundle analytics with hardware to lock in recurring revenue. North America dominates today, yet Asia-Pacific shows the fastest expansion as megaproject spending and smart-city blueprints demand embedded monitoring from day one.[1]Asian Development Bank, “Asia $43 Trillion Infrastructure Gap,” adb.org Sector consolidation is expected because asset owners prefer integrated ecosystems over single-purpose sensors.
Key Report Takeaways
- By component, hardware commanded 60.57% of structural health monitoring market share in 2024, while software is projected to register a 10.36% CAGR through 2030.
- By technology, wired systems held 67.24% structural health monitoring market share in 2024; wireless solutions are poised for an 11.23% CAGR to 2030.
- By installation type, retrofit projects accounted for 57.18% market share in 2024; new-build deployments are expected to post a 12.04% CAGR through 2030.
- By monitoring frequency, continuous systems held 63.72% of structural health monitoring market size in 2024 and are advancing at a 9.07% CAGR to 2030.
- By end-use, civil infrastructure captured 55.68% market share in 2024, whereas energy and power applications will expand at a 9.83% CAGR between 2025 and 2030.
- By geography, North America led with 32.13% revenue share in 2024; Asia-Pacific is forecast to grow at an 11.34% CAGR through 2030.
Global Structural Health Monitoring Market Trends and Insights
Drivers Impact Analysis*
| Driver | (~) % Impact on CAGR Forecast | Geographic Relevance | Impact Timeline |
|---|---|---|---|
| Aging infrastructure requiring maintenance | +2.1% | North America, Europe | Long term (≥ 4 years) |
| Increased demand for resilient smart cities | +1.8% | Asia-Pacific, MEA, Latin America | Medium term (2-4 years) |
| Regulatory mandates on structural safety | +1.5% | North America, EU, extending to Asia-Pacific | Short term (≤ 2 years) |
| Falling sensor costs and IoT integration | +1.3% | Global | Medium term (2-4 years) |
| Insurance premium discounts for instrumented assets | +0.9% | North America, EU | Medium term (2-4 years) |
| Digital-twin convergence enabling predictive analytics | +1.1% | Global | Long term (≥ 4 years) |
| Source: Mordor Intelligence | |||
Aging Infrastructure Requiring Maintenance
Bridge, tunnel, and building stock built in the 1960s and 1970s now operates beyond its intended design life. The United States alone listed more than 67,000 structurally deficient bridges in 2024, prompting federal and state authorities to earmark monitoring funds in capital budgets. Dollar-for-dollar analysis shows every proactive maintenance dollar can avert USD 4 to 5 in reconstruction outlays, thus shifting investment logic toward permanent sensing arrays. Europe faces a parallel challenge as post-war concrete buildings degrade under harsher climate loads, while Japan, South Korea, and China add earthquake resilience as an additional driver. Vendors able to retrofit without disrupting traffic or tenant occupancy gain a competitive edge, and bundled analytics subscriptions guarantee asset owners receive prioritized repair schedules rather than raw data streams.
Increased Demand for Resilient Smart Cities
Smart-city planners embed structural health monitoring market solutions into digital command centers that already manage lighting, security, and transit. South Korea’s generative-AI tunnel inspections generate 10,000 synthetic damage images in 24 hours, supplying training data for autonomous drones that scan confined spaces without human risk. Edge servers on 5G backhaul crunch strain-gauge feeds in millisecond windows, allowing road authorities to throttle heavy-duty truck access when fatigue indicators breach set thresholds. Latin American municipalities piggyback on this template to address congestion-induced degradation, while Gulf states integrate monitoring dashboards into climate-adaptation programs that track temperature-accelerated concrete creep.
Regulatory Mandates on Structural Safety
Following the 2021 Surfside condominium collapse, Florida upgraded inspection cycles and New Jersey enacted a Structural Integrity Act mandating initial inspections within 15 years of occupancy. The 2024 International Building Code raises design-load checks and pushes owners toward real-time condition verification. These statutes extend to balcony, façade, and parking-deck elements, effectively accelerating adoption across residential portfolios. Compliance spending is now treated as a non-discretionary line item, sheltering the structural health monitoring market from cyclical construction downturns.
Falling Sensor Costs and IoT Integration
MEMS accelerometer prices fell over 40% between 2018 and 2024, while ultra-low-power chipsets enable battery-free smart skins that transmit at distances beyond 35 m using harvested energy. Ambient IoT standards from 3GPP permit multi-band connectivity that bypasses private gateways, trimming installation labor and simplifying retrofits.[2]3GPP, “Ambient IoT for Industry 4.0,” 3gpp.org By 2030, quantum strain sensors could detect micro-crack propagation at the nanoscale, helping operators trigger sectional repairs before macro-fracture occurs. The net effect is a structural health monitoring market where capital cost per instrumented square foot keeps declining even as functional performance rises.
Restraints Impact Analysis*
| Restraint | (~) % Impact on CAGR Forecast | Geographic Relevance | Impact Timeline |
|---|---|---|---|
| High initial installation costs | -1.8% | Global, acute in developing economies | Short term (≤ 2 years) |
| Lack of standardized data protocols | -1.2% | Global | Medium term (2-4 years) |
| Cyber-security concerns over wireless SHM networks | -0.9% | Global | Medium term (2-4 years) |
| Skilled labor shortage for data interpretation | -1.1% | Global, specialized markets | Long term (≥ 4 years) |
| Source: Mordor Intelligence | |||
High Initial Installation Costs
A full-fledged bridge monitoring package can exceed USD 1 million, placing it beyond reach for smaller county agencies until grant funding becomes available. Retrofitting heritage buildings drives costs higher because surface routing of cables or sensors must minimize aesthetic disruption. Although lifecycle studies show savings outweigh the investment for wind turbine foundations and offshore platforms, skepticism persists among budget-constrained municipalities. Vendors have responded with phased deployment plans starting on the highest-risk girders and expanding as ROI is proven, yet total addressable demand remains gated by capital outlay hurdles.
Lack of Standardized Data Protocols
Bridges in a single highway corridor may rely on vendor-proprietary formats that impede cloud aggregation. Insurance carriers require verifiable, tamper-proof logs before adjusting risk premiums, but heterogeneous data models slow adoption. IEEE and ISO workstreams target harmonized metadata and API layers, although ratification lags behind commercial releases. In the interim, asset owners incur extra integration charges, dampening near-term structural health monitoring market growth.
*Our forecasts treat driver/restraint impacts as directional, not additive. The impact forecasts reflect baseline growth, mix effects, and variable interactions.
Segment Analysis
By Component: Hardware Dominance Amid Software Acceleration
Hardware generated the bulk of 2024 revenue, translating to 60.57% of structural health monitoring market share as civil engineers prioritized rugged fiber-optic cables, strain gauges, and data-loggers to secure baseline condition intelligence. Yet software revenue is expanding quicker, with a 10.36% CAGR driven by AI-assisted diagnostics and digital-twin overlays that extrapolate fatigue life from vibration signatures. Operators purchasing sensors in previous cycles now license dashboards that rank repair urgency and simulate load redistribution after hypothetical failures.
A second momentum tailwind stems from edge-analytics modules that preprocess data onsite, trimming cloud egress fees while keeping detection latency in the sub-second range. As SaaS fees converge toward enterprise-resource-planning price points, advisory firms predict software may surpass services receipts by 2029, even if it never overtakes hardware on absolute dollars over the medium term.


By Technology: Wired Reliability versus Wireless Flexibility
Stringent data-loss tolerances keep wired systems ahead with 67.24% revenue share in 2024. Nuclear plants, long-span suspension bridges, and high-speed rail viaducts value shielded fiber that resists RF interference. Nevertheless, wireless nodes racing at an 11.23% CAGR appear in stadium roofs and retrofitted office towers where cabling chores are prohibitive. Battery-less smart skins using 5G NR-RedCap push maintenance intervals from months to years, eroding the traditional reliability gap.
Hybrid topologies now dominate requests for proposals: wired backbones route mission-critical channels while wireless clusters patch blind spots in torsion-sensitive sections. Vendors able to orchestrate both tiers through a single supervisory control and data acquisition layer seize differentiation.
By Installation Type: Retrofit Applications Drive Growth
Retrofit programs controlled 57.18% of 2024 billings as public-works owners scrambled to evaluate structures built before code updates introduced seismic detailing or corrosion-resistant rebar. Sensor mounting brackets must mold around irregular surfaces, and local shutdowns are staged at night to minimize traffic delays, inflating labor budgets. Even so, retrofit demand remains inelastic because rehabilitation grants often stipulate continuous monitoring as a disbursement condition.
New-build adoption, expanding at a 12.04% CAGR, benefits from architects embedding sensor channels into concrete pours, resulting in lower marginal cost and lifelong data continuity. Smart-city ordinances in Singapore and Dubai now require instrumentation for critical public assets at the design stage, ensuring further momentum beyond 2030.
By Monitoring Frequency: Continuous Systems Dominate
Stakeholders chose continuous data streams for 63.72% of 2024 projects, attracted by real-time alarms that override prescriptive inspection calendars. Continuous deployments enjoy a 9.07% CAGR because falling cloud-storage prices reduce operating expense pain points and because predictive maintenance algorithms work best with high-resolution timelines.
Periodic monitoring endures for lower-risk assets such as low-rise warehouses where quarterly drone scans suffice. Yet once owners experience averted closures from early crack alerts, many upgrade from periodic to continuous tiers, enlarging churn opportunities for vendors.

By End-use Industry: Civil Infrastructure Leadership
Bridges, dams, and municipal buildings together delivered 55.68% of 2024 revenue, anchoring the structural health monitoring market. Public-safety optics compel mayors to pre-empt failures, and federal grants increasingly tie cash to proof of monitoring. Early adopters include Norway’s bridge authority, which fuses IoT strain data into live digital twins, cutting on-site inspections by 33%.
Energy and power assets headline growth at a 9.83% CAGR, particularly offshore wind towers where monopile fatigue warrants 24/7 observation. Utility regulators in Texas and Germany now assign depreciation relief for substations fitted with vibration alerts, creating fresh pull-through demand for vendors that certify to power-sector cybersecurity standards.
Geography Analysis
North America retained leadership with 32.13% 2024 revenue buoyed by record federal infrastructure allocations and rigorous inspection mandates emerging after high-profile bridge and condo collapses. Insurers in Alabama grant 35%-60% wind-mitigation discounts for properties built to third-party fortified standards, reinforcing ROI narratives for permanent instrumentation. California’s 2025 Balcony Code further expands addressable volume by compelling multi-family landlords to document load path integrity every six years.
Asia-Pacific posts the fastest cadence at 11.34% CAGR, anchored by a USD 43 trillion infrastructure backlog through 2035. Governments mix greenfield megaprojects with urban retrofits, translating to demand peaks across both new-build and retrofit sub-segments.[3]Asian Development Bank, “Asia $43 Trillion Infrastructure Gap,” adb.orgChina standardizes fiber-optic grid monitoring in expressway PPP contracts, India links smart-city grants to live structural dashboards, and South Korea fields AI-powered tunnel inspection drones for mountainous highways.
Europe represents a technologically mature yet steadily expanding market. The United Kingdom’s USD 10.41 million ROSEHIPS program applies machine-learning predictive analytics to wind-turbine towers, establishing best-practice templates that German and Nordic grid operators are adopting. Stringent data-privacy frameworks prolong procurement cycles, but once contracts close they often stretch over 15 years, ensuring dependable revenue for platform vendors.


Competitive Landscape
Competitive intensity remains moderate as scores of regional sensor houses compete with multinational automation firms offering turnkey platforms. Hardware differentiation tilts on sensor sensitivity, temperature drift resilience, and electromagnetic immunity, while software leaders stress fault-classification accuracy and open APIs. A clear pivot shows hardware-only firms acquiring analytics startups to secure value-added recurring revenue, evidenced by 2024’s uptick in M&A deal flow exceeding USD 600 million.
Strategic alliances between telecom operators and monitoring vendors accelerate adoption of 5G RedCap modules baked into edge devices. This collaboration lowers data backhaul fees and positions carriers to cross-sell private networks to highway agencies. Meanwhile, academic-industry consortia such as Korea’s KICT consortium jointly patent AI image-augmentation workflows, translating research breakthroughs directly into commercial offerings.
White-space opportunities persist in mid-tier municipal markets lacking in-house analytics capability. Vendors that package diagnostic reports as managed services win outsized share, especially when bundled with insurance-compliant reporting formats. As owners grow weary of managing point solutions, integrated ecosystems combining sensors, edge analytics, cloud dashboards, and maintenance work-order modules will dictate the next wave of consolidation within the structural health monitoring market.
Structural Health Monitoring Industry Leaders
National Instruments Corporation
SGS SA
COWI A/S
Sixense Group
Hottinger Brüel & Kjaer GmbH
- *Disclaimer: Major Players sorted in no particular order

Recent Industry Developments
- April 2025: California implemented a Balcony Code mandating six-year inspection cycles for apartments and nine-year cycles for condominiums.
- March 2025: Korea Institute of Civil Engineering and Building Technology unveiled a generative-AI inspection suite producing 10,000 tunnel damage images within 24 hours to automate drone-based surveys.
- January 2025: Alabama Department of Insurance introduced 35%-60% premium discounts on hurricane policies for IBHS-compliant retrofits, boosting sensor adoption in coastal housing.
- October 2024: New Jersey enacted the Structural Integrity Act requiring early-life structural inspections for condominium buildings.


Global Structural Health Monitoring Market Report Scope
| Hardware |
| Software |
| Services |
| Wired |
| Wireless |
| Retrofit |
| New Construction |
| Continuous Monitoring |
| Periodic Monitoring |
| Civil Infrastructure | Bridges and Tunnels |
| Buildings and Facilities | |
| Dams and Waterways | |
| Energy and Power | |
| Aerospace and Defense | |
| Mining and Heavy Industry |
| North America | United States |
| Canada | |
| Mexico | |
| Europe | Germany |
| United Kingdom | |
| France | |
| Italy | |
| Spain | |
| Russia | |
| Rest of Europe | |
| Asia-Pacific | China |
| Japan | |
| India | |
| South Korea | |
| Australia | |
| Rest of Asia-Pacific | |
| South America | Brazil |
| Argentina | |
| Rest of South America | |
| Middle East | Saudi Arabia |
| United Arab Emirates | |
| Turkey | |
| Rest of Middle East | |
| Africa | South Africa |
| Nigeria | |
| Egypt | |
| Rest of Africa |
| By Component | Hardware | |
| Software | ||
| Services | ||
| By Technology | Wired | |
| Wireless | ||
| By Installation Type | Retrofit | |
| New Construction | ||
| By Monitoring Frequency | Continuous Monitoring | |
| Periodic Monitoring | ||
| By End-use Industry | Civil Infrastructure | Bridges and Tunnels |
| Buildings and Facilities | ||
| Dams and Waterways | ||
| Energy and Power | ||
| Aerospace and Defense | ||
| Mining and Heavy Industry | ||
| By Geography | North America | United States |
| Canada | ||
| Mexico | ||
| Europe | Germany | |
| United Kingdom | ||
| France | ||
| Italy | ||
| Spain | ||
| Russia | ||
| Rest of Europe | ||
| Asia-Pacific | China | |
| Japan | ||
| India | ||
| South Korea | ||
| Australia | ||
| Rest of Asia-Pacific | ||
| South America | Brazil | |
| Argentina | ||
| Rest of South America | ||
| Middle East | Saudi Arabia | |
| United Arab Emirates | ||
| Turkey | ||
| Rest of Middle East | ||
| Africa | South Africa | |
| Nigeria | ||
| Egypt | ||
| Rest of Africa | ||


Key Questions Answered in the Report
What is the current structural health monitoring market size?
The structural health monitoring market size reached USD 3.57 billion in 2025 and is forecast to hit USD 5.48 billion by 2030 at an 8.95% CAGR.
Which region leads the structural health monitoring market?
North America held 32.13% revenue share in 2024, driven by aging infrastructure, strict regulations, and insurer incentives.
Which segment is growing fastest within the structural health monitoring market?
Software platforms are expanding at a 10.36% CAGR as asset owners leverage AI analytics over existing sensor grids.
Why is Asia-Pacific the fastest-growing market?
Massive infrastructure investments and smart-city projects push Asia-Pacific toward an 11.34% CAGR through 2030.
How do regulatory changes influence adoption?
Mandates such as Florida’s strengthened condo rules and New Jersey’s Structural Integrity Act require real-time or more frequent inspections, prompting owners to adopt continuous monitoring.
What technologies are shaping future deployments?
5G-enabled, battery-less smart skins, quantum strain sensors, and digital-twin analytics are set to improve accuracy and cut maintenance overhead in next-generation deployments.
Page last updated on:


