
Vibration Monitoring Market Size and Share
Market Overview
| Study Period | 2020 - 2031 |
|---|---|
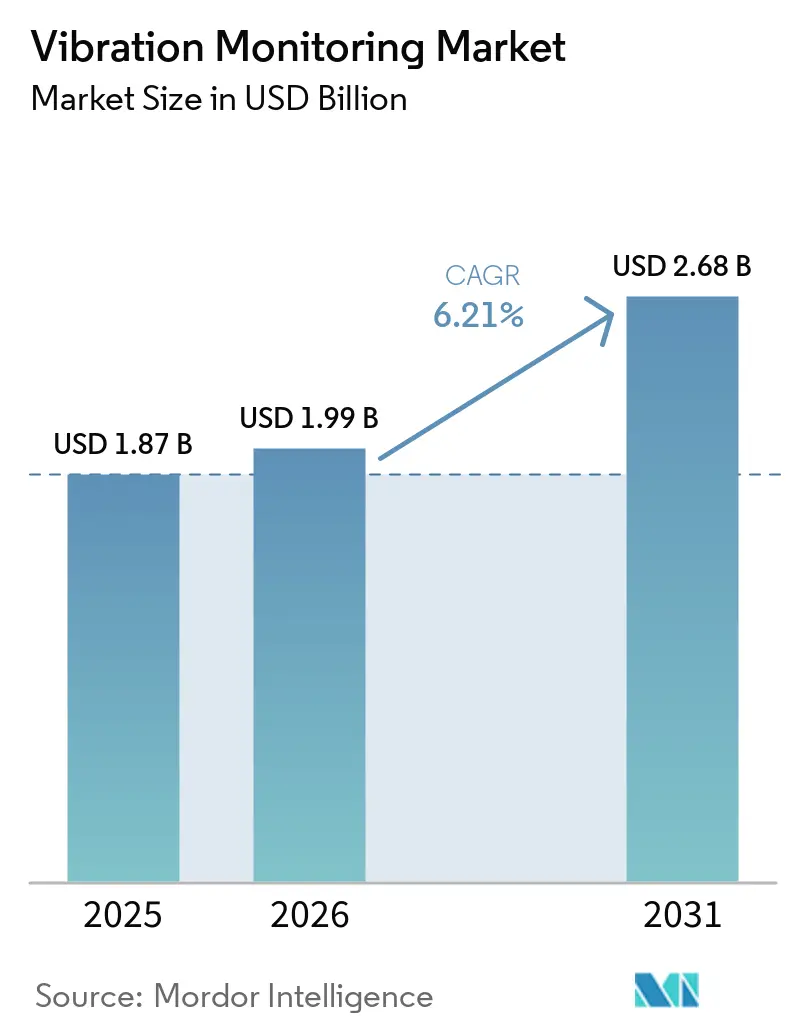
| Market Size (2026) | USD 1.99 Billion |
| Market Size (2031) | USD 2.68 Billion |
| Growth Rate (2026 - 2031) | 6.21 % |
| Fastest Growing Market | Asia Pacific |
| Largest Market | North America |
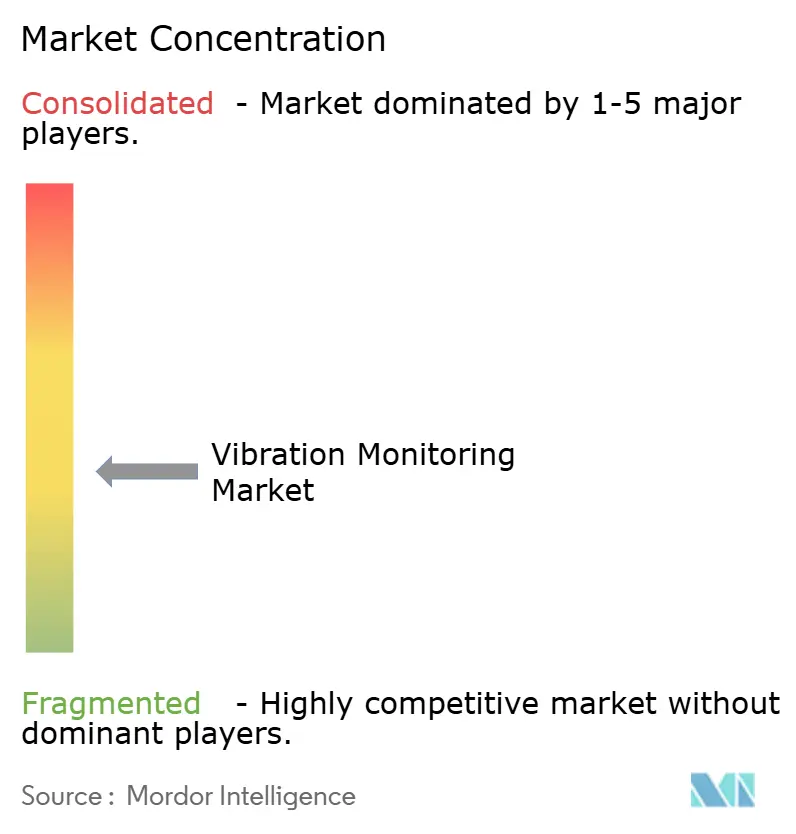
| Market Concentration | Medium |
Major Players *Disclaimer: Major Players sorted in no particular order Image © Mordor Intelligence. Reuse requires attribution under CC BY 4.0. | |
Vibration Monitoring Market Analysis by Mordor Intelligence
vibration monitoring market size in 2026 is estimated at USD 1.99 billion, growing from 2025 value of USD 1.87 billion with 2031 projections showing USD 2.68 billion, growing at 6.21% CAGR over 2026-2031. Increasing recognition of the high cost of unplanned machinery failures is shifting maintenance strategies from reactive to predictive approaches, driving steady investment in condition-based monitoring across oil and gas, power generation, and discrete manufacturing. Wireless IIoT sensors, edge analytics, and cloud platforms are converging to reduce data-collection costs, extend coverage to hard-to-reach assets, and enable prescriptive insights that lengthen asset life. Heightened regulatory pressure in hazardous industries, the retirement deferment of aging coal-fired plants, and government-backed smart-manufacturing schemes in Asia further accelerate demand. Competitive intensity is rising as established automation majors fold vibration analytics into broader digital-twin ecosystems, raising entry barriers for stand-alone sensor suppliers and strengthening the long-term growth outlook for the vibration monitoring market.
Key Report Takeaways
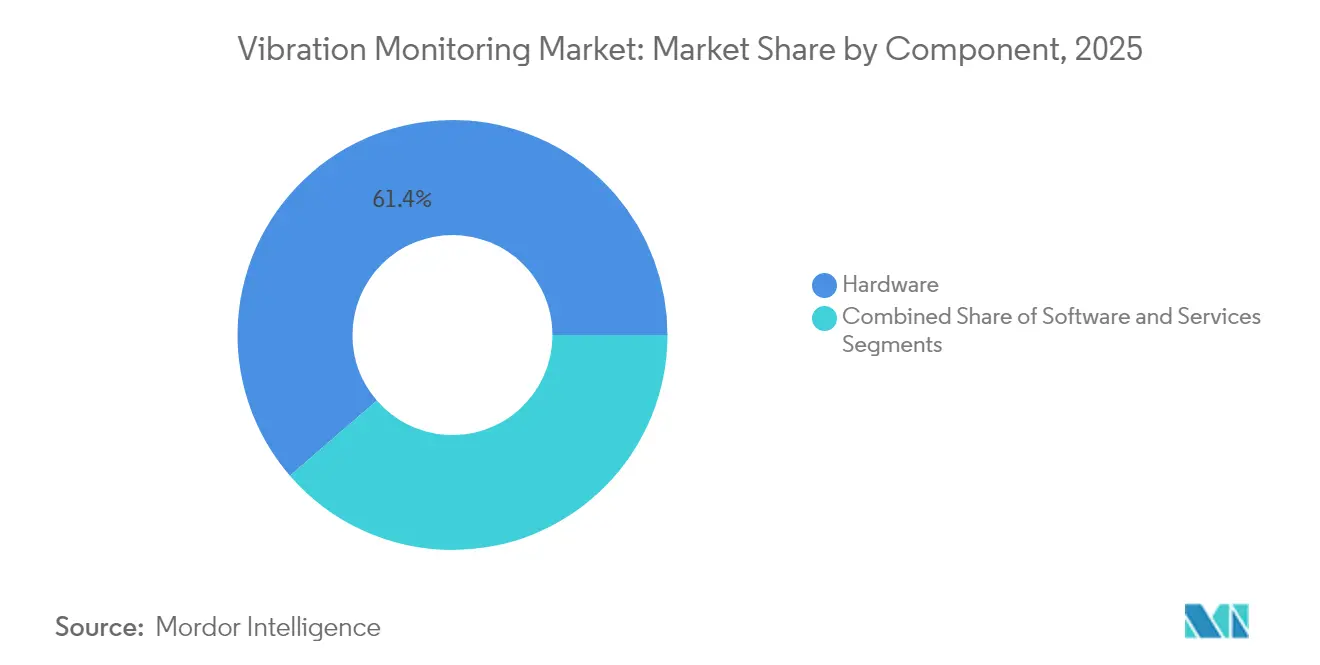
- By component, hardware retained 61.35% of the vibration monitoring market share in 2025, while services posted the fastest 7.55% CAGR outlook to 2031.
- By monitoring process, online/continuous systems are expected to lead with a 54.40% revenue share of the vibration monitoring market in 2025; wireless remote monitoring is forecast to expand at a 8.93% CAGR through 2031.
- By network technology, wired installations accounted for 69.10% of the vibration monitoring market size in 2025; however, wireless networks are projected to grow at a 10.18% CAGR between 2026 and 2031.
- By end-user, the oil and gas sector commanded a 29.65% share of the vibration monitoring market size in 2025, while the food and beverage sector is projected to advance at an 8.22% CAGR from 2026 to 2031.
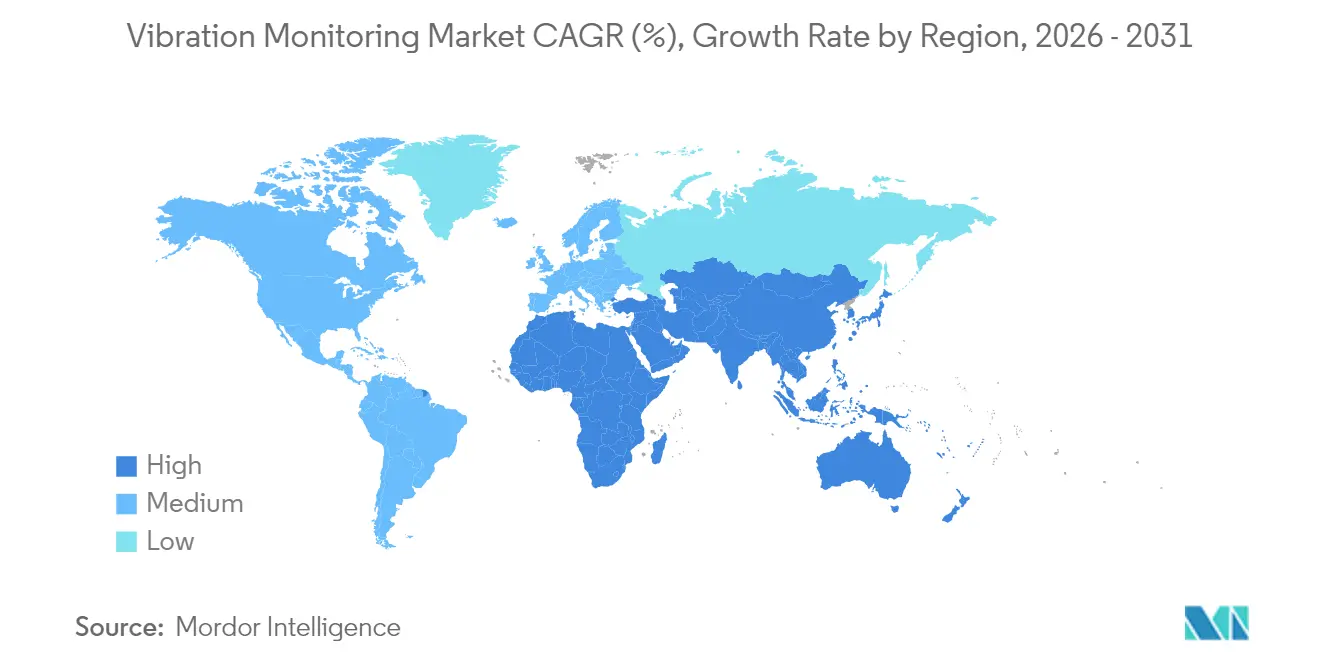
- By geography, North America dominated the vibration monitoring market, accounting for a 36.55% revenue share in 2025. Asia is expected to register the fastest CAGR of 8.34% from 2026 to 2031.
Note: Market size and forecast figures in this report are generated using Mordor Intelligence’s proprietary estimation framework, updated with the latest available data and insights as of 2026.
Global Vibration Monitoring Market Trends and Insights
Drivers Impact Analysis*
| DRIVER | (~) % IMPACT ON CAGR FORECAST | GEOGRAPHIC RELEVANCE | IMPACT TIMELINE |
|---|---|---|---|
| Rising Adoption of Wireless IIoT-Enabled Sensors in Hazardous Zones | +1.8% | Global, with concentration in Middle East and North America offshore operations | Medium term (2-4 years) |
| Shift from Periodic to Online Continuous Monitoring in Power Generation Turbines | +1.5% | North America and Europe, expanding to Asia-Pacific | Long term (≥ 4 years) |
| Asset-criticality-based Predictive Maintenance Mandates by Offshore Oil and Gas Operators | +1.2% | Middle East core, spill-over to North Sea and Gulf of Mexico | Short term (≤ 2 years) |
| Government-funded Smart Manufacturing Programs Boosting MEMS Accelerometer Demand | +1.0% | Asia-Pacific core, with secondary impact in Europe | Medium term (2-4 years) |
| Aging Coal-Fired Plants Retrofitting Vibration Monitoring for Life-Extension | +0.8% | South America, Eastern Europe, and select Asia markets | Long term (≥ 4 years) |
| Integration of AI and Machine Learning in Predictive Analytics Platforms | +0.7% | Global, with early adoption in North America and Europe | Medium term (2-4 years) |
| Source: Mordor Intelligence | |||
Rising Adoption of Wireless IIoT-Enabled Sensors in Hazardous Zones
Wireless, intrinsically safe vibration sensors are replacing cabled solutions in refineries, chemical plants, and offshore rigs as operators seek to minimize human exposure and maintenance overheads. Emerson’s AMS Wireless Vibration Monitor, which operates on WirelessHART and provides a three-to-five-year battery life, illustrates how modern devices now combine triaxial accelerometry with embedded prescriptive analytics, enabling remote coverage of pumps, compressors, and steam traps. Aramco’s roll-out of 454 wireless vibration nodes at the Fadhili Gas Plant shows the scalability of these solutions in large-scale hazardous. Improved protocol security and edge processing continue to lower total cost of ownership, underpinning broader acceptance across the vibration monitoring market.[1]Emerson, “AMS Wireless Vibration Monitor,” emerson.com
Shift from Periodic to Online Continuous Monitoring in Power-Generation Turbines
Power utilities are abandoning route-based checks in favor of permanent sensors that stream high-resolution data to remote centers staffed by specialists in rotating equipment. GE Vernova’s Remote Monitoring and Diagnostics service connects thousands of steam- and gas-turbine data points to cloud analytics that spot anomalies one to two months before failure, allowing optimized shutdown scheduling. Combined-cycle plants benefit most because rapid load changes introduce vibration patterns that legacy quarterly checks overlook. With original-equipment manufacturers now bundling performance guarantees with continuous monitoring adherence, demand for always-on systems in the vibration monitoring market is poised to climb steadily.
Asset-Criticality-Based Predictive-Maintenance Mandates by Offshore Oil and Gas Operators
Producers in the Arabian Gulf, North Sea, and Gulf of Mexico classify rotating assets by failure consequence; compressors and water-injection pumps at the top tiers must now carry continuous vibration surveillance. Studies at UAE and Saudi fields show that integrating vibration, process, and lifetime-stress data cuts unplanned downtime on critical machines by double-digit percentages. Regulatory bodies are recognizing online condition monitoring as a formal risk-mitigation measure, reinforcing uptake across the vibration monitoring market.
Government-Funded Smart-Manufacturing Programs Boosting MEMS Accelerometer Demand
Asia’s smart-factory grants subsidize sensor retrofits, data platforms, and workforce training. China’s 2024 policy blueprint and Japan’s 2025 semiconductor roadmap both call for broad adoption of MEMS-based measurement devices in assembly lines. MEMS accelerometers offer lower power draw and tighter integration with industrial Ethernet, making them ideal for high-density installations. Subsidized roll-outs are creating a fast-growing demand pocket within the vibration monitoring market.
Restraints Impact Analysis*
| RESTRAINTS | (~) % IMPACT ON CAGR FORECAST | GEOGRAPHIC RELEVANCE | IMPACT TIMELINE |
|---|---|---|---|
| Scarcity of Vibration Analysts with ISO 18436-2 Certification | -1.1% | Global, particularly acute in emerging markets | Long term (≥ 4 years) |
| Cyber-hardening Costs for Cloud-connected Monitoring Gateways | -0.9% | North America and Europe, expanding globally | Medium term (2-4 years) |
| Low ROI Perception in Low-runtime Batch Food Processing Lines | -0.6% | Global, with concentration in emerging food processing markets | Medium term (2-4 years) |
| Fragmented Wireless Standards Causing Interoperability Issues | -0.4% | Global, with particular impact on multi-vendor installations | Short term (≤ 2 years) |
| Source: Mordor Intelligence | |||
Scarcity of Vibration Analysts with ISO 18436-2 Certification
Modern systems generate large, complex data sets that still need expert interpretation to confirm machine faults. Training an analyst to ISO 18436-2 level takes two to three years, and supply lags industrial demand, especially in fast-growing economies. Many firms respond by outsourcing diagnostics or deploying automated analytics, yet intricate turbomachinery failures often require human judgement, tempering expansion in parts of the vibration monitoring market.[2]Analog Devices, “MEMS Accelerometers for Condition Monitoring,” analog.com
Cyber-Hardening Costs for Cloud-Connected Monitoring Gateways
Encrypting data streams, segmenting OT/IT networks, and complying with IEC 62443 or ISO 27001 add 20–30% to project budgets. Operators with thin margins delay upgrades until security templates mature or hybrid architectures prove affordable. The cost burden is most acute for small and medium enterprises, slowing cloud-based adoption in sections of the vibration monitoring market.
*Our forecasts treat driver/restraint impacts as directional, not additive. The impact forecasts reflect baseline growth, mix effects, and variable interactions.
Segment Analysis
By Component: Services Drive Value Creation
Hardware led the vibration monitoring market with 61.35% revenue in 2025, underscoring the central role of accelerometers, velocity pickups, and proximity probes in every installation. Accelerometers dominate because they span wide frequency ranges and mount easily on pumps, motors, and gearboxes, while displacement transducers remain mandatory on high-speed turbines. The hardware share is expected to moderate as MEMS and optical sensors widen application scope and reduce node cost. Advancements in sensor and control technologies are also supporting the adoption of active noise and vibration control systems, which use real-time sensing and corrective mechanisms to reduce unwanted vibration and noise in machinery and equipment. Services, however, post the strongest 7.55% CAGR through 2031 as users shift toward outcome-based contracts that bundle data analytics, diagnostics, and maintenance recommendations. Software evolves in parallel, migrating from on-premise spectrum viewers to cloud platforms that apply machine learning and digital-twin correlation, enabling vendors to lock in recurring revenue. TDK’s Tronics AXO 315, a digital, force-rebalance MEMS accelerometer, exemplifies how firmware-rich sensors blur the line between hardware and software services.
The growing emphasis on predictive insights positions service providers as strategic partners rather than transactional suppliers. Managed-service contracts that charge per monitored asset or per avoided downtime align incentives and amplify demand for analytics subscriptions. Large automation houses leverage global service networks to capture this value, while niche diagnostic firms specialize in complex failure modes. As labor shortages tighten, automated diagnostics gain favor, reinforcing service-led growth across the vibration monitoring market.



By Monitoring Process: Wireless Remote Gains Momentum
Online continuous monitoring captured 54.40% of 2025 revenue, a position it will hold as long as critical equipment such as turbines, compressors, and extruders require around-the-clock oversight. Continuous data streams allow trending of spectral signatures and early identification of transient events that route-based measurements miss. Portable systems still serve lower-criticality assets, yet cost reductions in wireless sensing are tilting budgets toward permanent nodes that combine vibration and temperature channels on a single device.
Wireless remote monitoring is forecast to rise at a 8.93% CAGR. Battery-powered nodes now sustain three-plus years of life, and industrial-grade mesh protocols provide deterministic latency suitable for protection logic. Emerson reports deployments of thousands of wireless vibration points per site, proving viable scale for large complexes. Edge-resident analytics further lower bandwidth needs by transmitting only pre-filtered indicators. As these advantages compound, the vibration monitoring market increasingly favors wireless architectures for both greenfield and retrofit projects.
By Deployment Mode: Cloud Adoption Accelerates
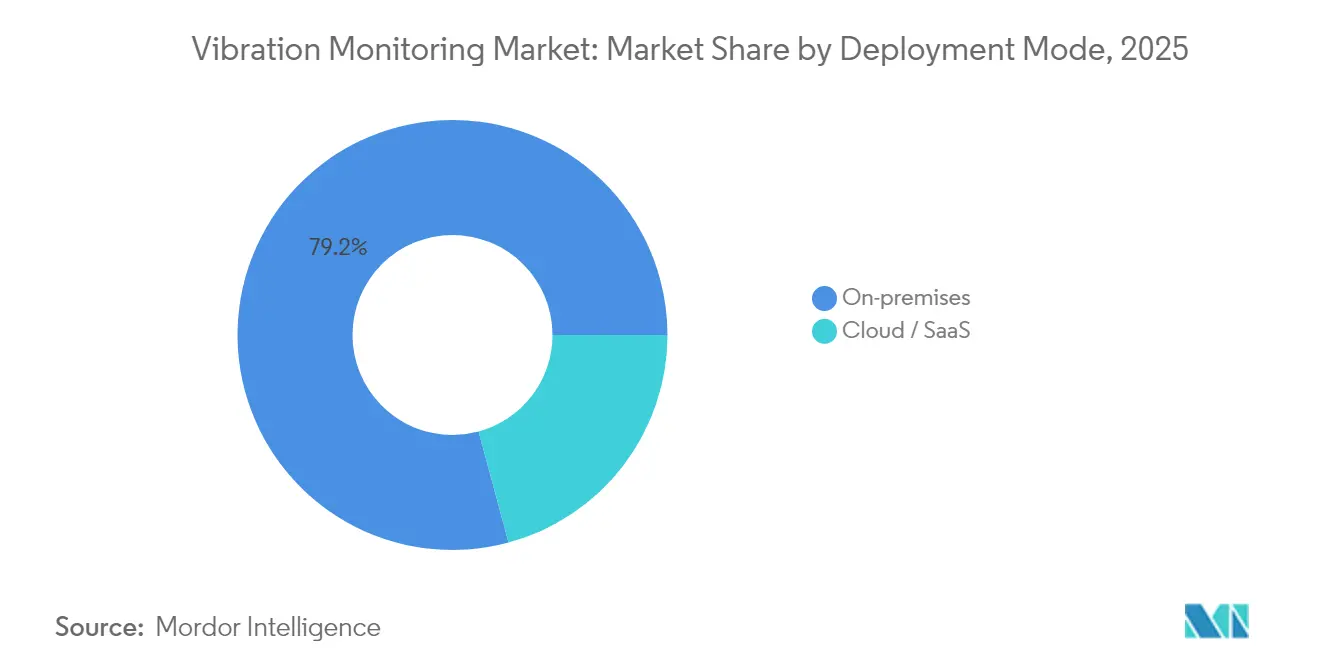
On-premises installations held 79.20% share in 2025, reflecting operator preference for local control and real-time integration with safety systems. Legacy SCADA and distributed-control frameworks rely on deterministic networks that are difficult to replicate over public clouds. Cyber-security concerns, data-sovereignty rules, and intermittent connectivity at remote sites further sustain on-prem footprints.
Cloud and SaaS deployments, however, are projected to scale at 11.58% CAGR. Centralized analytics pool multi-plant data sets, enabling comparative benchmarking and algorithm training impossible within siloed servers. Large enterprises cut IT overhead by shifting to vendor-hosted platforms that deliver continuous updates and AI models. Hybrid architectures, where gateways perform first-level processing and push exceptions to the cloud, balance latency and security, encouraging adoption. As a result, broader cloud penetration will expand total addressable revenue in the vibration monitoring market.
By Network Technology: Wireless Standards Mature
Wired links 4-20 mA, HART, or Ethernet retained 69.10% market share in 2025, prized for reliability and embedded power supply. Critical turbomachinery monitoring still favors shielded cables to guarantee data integrity. Existing conduit infrastructure also lowers incremental costs during retrofits, thereby reinforcing the prevalence of wired solutions.
Wireless systems, however, are expected to grow at a 10.18% CAGR. The ISA100.11a and 6LoWPAN stacks now incorporate robust encryption and QoS layers, while device certification programs help alleviate concerns about multivendor interoperability. Aramco’s ISA100 deployment for both steam-trap and vibration sensing validates field-proven performance at the petrochemical scale. Concurrent 5G roll-outs add high-bandwidth options for mobile assets. These advances facilitate wider adoption of wireless technology across the vibration monitoring market.
Geography Analysis
North America led with 36.55% of 2025 revenue, propelled by offshore oil and gas regulations that mandate online condition monitoring, plus large-scale retrofits in the United States power sector. Utilities extending the life of coal-fired units and combined-cycle plants underpin continual sensor demand, while Canada’s oil sands operations require robust devices that withstand extreme cold and dust. Government emphasis on workplace safety also promotes investment, cementing the region’s dominance in the vibration monitoring market.
Europe maintains a sizeable share on the strength of its manufacturing base and energy-efficiency legislation. Germany champions Industry 4.0 roll-outs that couple vibration data with MES and ERP systems for holistic asset views. The United Kingdom’s North Sea operators invest heavily in wireless mesh sensing to overcome hazardous-area cabling costs, while the EU’s stringent machinery directives embed condition monitoring within risk-assessment frameworks. These factors create stable, compliance-driven demand that supports the vibration monitoring market across the continent.
Asia-Pacific posts the fastest 8.34% CAGR, buoyed by Chinese, Japanese, and Indian smart-manufacturing incentives that subsidize sensor adoption. Semiconductor strategies emphasizing local MEMS production further reduce device cost. Rapid industrialization across Southeast Asia and government efforts to digitalize SMEs expand the addressable base. Adoption of wireless protocols and cloud analytics is swift in new plants unencumbered by legacy systems, positioning the region as a key growth engine for the vibration monitoring market.

Regulatory Landscape
Regulatory requirements affecting vibration monitoring span machinery safety, hazardous-area operations, and OT cybersecurity, with a growing role for formal standards in acceptance testing and maintenance programs. In the EU, Regulation (EU) 2023/1230 on machinery (adopted in 2023) sets updated safety expectations for connected machinery and becomes applicable from January 2027, reinforcing demand for verifiable condition monitoring, documentation, and safe integration of connected sensors and analytics into machine risk assessments.
Standards activity is also tightening specification baselines for measurements, diagnostics, and acceptance criteria. ISO published ISO 13373-10:2024 for vibration-based condition monitoring diagnostics for electrical generators with fluid-film bearings, and ISO 20816-21:2025 for vibration measurement and evaluation of horizontal-axis wind turbines, both shaping how OEMs and operators structure monitoring programs and service contracts. On the product and compliance side, IEC/CENELEC work on prEN IEC 60034-14:2026 updates vibration limits for rotating electrical machines, while Germany's BMWK issued a revised machinery safety directive in June 2026 that references AI-driven abnormal-vibration recognition and shutdown functions for certain CNC equipment (from January 1, 2027). This raises the compliance premium for integrated sensing, analytics, and secure-by-design connectivity aligned with industrial cybersecurity requirements.
Value Chain Analysis
The value chain begins with sensor and electronics inputs (MEMS and piezoelectric elements, ASICs/MCUs/DSPs, and industrial enclosures), followed by device manufacturing for accelerometers, velocity sensors, and proximity/displacement probes, plus gateways and industrial wireless modules. Upstream suppliers such as STMicroelectronics support industrial-grade MEMS vibration sensing, while vibration-instrumentation specialists and automation majors package sensors with intrinsically safe housings, battery systems, and calibrated mounting accessories to preserve measurement fidelity. Middleware and platform layers then convert raw time-waveform and spectral data into asset health indicators using edge analytics and cloud software, before integrating outcomes into CMMS/EAM and plant historian stacks via industrial protocols.
Downstream, distribution and delivery commonly flow through OEM channels (turbines, compressors, motors, and drives), automation-system integrators, and reliability service providers that design architectures, install nodes, configure connectivity, and run diagnostics programs. As end users move from periodic route-based checks to online monitoring, more of the captured value shifts to software subscriptions and managed services, including remote monitoring centers and outcome-based contracts. Cybersecurity and interoperability requirements are increasingly shaping the chain, pushing vendors toward certified wireless stacks (for example WirelessHART or ISA100.11a), secure gateways, and standardized data models for predictive maintenance. Skills constraints around certified vibration analysts also raise demand for vendor-provided diagnostics, training, and automation-assisted interpretation.
Competitive Landscape
The vibration monitoring industry exhibits moderate fragmentation, yet consolidation is accelerating as automation majors acquire sensor specialists to offer end-to-end predictive maintenance suites. In a strategic move, SKF has bolstered its portfolio by acquiring the lubrication arm of John Sample Group (JSG). This acquisition not only integrates JSG's advanced lubrication and flow management systems but also enhances SKF's established lineup of bearings, seals, and mechatronics. With this expansion, SKF is poised to deliver more holistic reliability solutions, especially targeting growth and enhanced capabilities in the Asia-Pacific market. Honeywell’s planned acquisition of Sundyne adds high-speed pumps and compressors that naturally complement its Forge analytics platform, underscoring a strategy to secure aftermarket parts and monitoring contracts.
Technology differentiation centers on edge AI and integrated digital twins. Vendors embed DSP chips inside sensors that run anomaly-detection models locally, cutting bandwidth and latency while addressing data-sovereignty concerns. Cloud dashboards amalgamate vibration, process, and lubrication data, generating prescriptive work orders that feed enterprise asset-management systems. Regal Rexnord’s next-generation Perceptiv platform typifies this shift, offering a universal gateway for multi-sensor fusion and AI-driven maintenance scheduling.
Barriers for smaller firms rise as customers demand cyber-secure, fully integrated solutions. However, niches remain for innovators focused on batteryless energy-harvesting nodes or specialized fault libraries for wind turbines and rail bogies. White-label partnerships with automation giants provide go-to-market channels, ensuring continued diversity within the vibration monitoring market.
Vibration Monitoring Industry Leaders
Emerson Electric Co.
Honeywell International Inc.
General Electric (Baker Hughes)
Rockwell Automation Inc.
SKF Ltd.
- *Disclaimer: Major Players sorted in no particular order

Market Opportunities and Future Outlook
Opportunities are expanding around edge-intelligent and wireless architectures that reduce installation friction and broaden monitoring from critical rotating equipment to wider fleets of pumps, motors, and auxiliary assets. Product roadmaps are increasingly moving analytics closer to the sensor; in June 2026, STMicroelectronics introduced the IIS3DWB10IS industrial MEMS vibration sensor with on-device AI inference and a 10 kHz bandwidth. This supports battery-powered nodes and edge diagnostics where bandwidth, latency, or data-sovereignty constraints limit always-on streaming.
A second whitespace area is standards-aligned, multi-vendor deployments that simplify scaling across sites and geographies. IEC 63270-1:2025 (published April 2025) defines functional structure and data requirements for predictive maintenance in industrial automation equipment, and Chinas GB/T 47230-2026 (issued February 27, 2026; implemented September 1, 2026) specifies predictive-maintenance data definitions and interfaces, supporting enterprise rollouts that avoid hard lock-in to a single platform. Market evidence for wireless scale-up is visible in energy and process industries: in July 2026, IMI secured a contract to supply a wireless vibration monitoring solution in an Omani refinery. The package included more than 500 battery-powered wireless vibration sensors and associated condition monitoring software, indicating the deployment density and retrofit suitability that continuous wireless monitoring can deliver in hazardous and hard-to-cable environments.
Recent Industry Developments
- July 2026: IMI secured a contract to supply a wireless vibration monitoring solution for a refinery operator in Oman, including more than 500 TWTG NEON battery-powered triaxial vibration sensors and SolidRed condition monitoring software. The award highlights how LoRaWAN-class wireless deployments are being used to extend continuous monitoring to large populations of rotating assets where cabling is costly or impractical.
- May 2026: Emerson announced the Synchros IIoT platform and new WirelessHART monitoring building blocks, including the Rosemount Synchros Temperature Monitor and Wireless Repeater, aimed at faster sitewide deployment. The release reinforces the shift toward scalable, mesh-based architectures that lower the installation barrier for continuous condition monitoring across distributed assets.
- March 2026: SKF signed an agreement to acquire G-Tech Instruments Inc., a Taiwan-based specialist in vibration analyzers and diagnostic tools, to strengthen its condition monitoring portfolio. The move expands SKF's instrumentation and diagnostics capabilities and adds regional depth in Asia-Pacific, supporting broader end-to-end reliability offerings.


Research Methodology Framework and Report Scope
Market Definition and Coverage
For this study, the vibration monitoring market covers the revenue generated from solutions that measure and analyze machine vibration to detect faults and support condition-based maintenance. It includes monitoring hardware, related software, and associated services sold across industrial end users and regions.
Scope exclusions: We exclude general-purpose industrial IoT platforms and maintenance services that are not tied to vibration measurement and diagnosis.
Segmentation Overview
- By Component
- Hardware
- Accelerometers
- Velocity Sensors
- Displacement/Proximity Probes
- Other Hardware (MEMS, Piezo, Optical)
- Software
- Services
- Hardware
- By Monitoring Process
- Online/Continuous
- Portable/Route-based
- Wireless Remote (Edge and Cloud)
- By Deployment Mode
- On-premises
- Cloud / SaaS
- By Network Technology
- Wired (4-20 mA, Modbus, Ethernet)
- Wireless (BLE, ISA100, 6LoWPAN)
- By Application
- Motors and Pumps
- Turbines and Compressors
- Gearboxes and Bearings
- Fans and Blowers
- By End-user Industry
- Oil and Gas
- Energy and Power
- Automotive and Transportation
- Chemicals and Petrochemicals
- Mining and Metals
- Food and Beverage
- Aerospace and Defense
- Pulp and Paper
- Marine
- Other Industries
- By Geography
- North America
- United States
- Canada
- Mexico
- Europe
- United Kingdom
- Germany
- France
- Italy
- Spain
- Rest of Europe
- Asia-Pacific
- China
- Japan
- India
- South Korea
- Australia
- Rest of Asia-Pacific
- Middle East
- Israel
- Saudi Arabia
- United Arab Emirates
- Turkey
- Rest of Middle East
- Africa
- South Africa
- Egypt
- Rest of Africa
- South America
- Brazil
- Argentina
- Rest of South America
- North America
Data Sources, Market Sizing, and Validation
Desk Research
Desk research was used to set the fact base for where vibration monitoring demand shows up and how it is typically purchased. We leaned on public and official sources such as US Energy Information Administration releases, International Energy Agency statistics, US Bureau of Labor Statistics industry data, and Eurostat manufacturing indicators, along with safety and reliability guidance from bodies such as ISO and NIST, because these help explain asset intensity and how maintenance is organized.
In parallel, we reviewed company filings, investor presentations, association websites, and reputable press to map solution positioning and typical buyer groups in vibration monitoring projects. Where needed, paid subscriptions were used in a limited way for company financials and intelligence, news and financials tracking, and patent databases to validate product activity and adoption themes. These examples are indicative only, and many other sources were also used to collect, cross-check, and clarify inputs.
Primary Interviews and Surveys
Primary work focused on interviews and structured surveys with a mix of solution providers, system integrators, plant maintenance teams, and reliability engineers, so assumptions could be checked against real buying and deployment patterns. Because this is a global market, inputs were validated across major manufacturing and energy hubs, followed by re-contacts when a key metric (like installed base growth or service mix) looked inconsistent with desk signals.
Distribution of primary research fieldwork respondents
| Company type | Respondent position | Region |
|---|---|---|
| Top tier: 29% | CXOs: 17% | APAC: 45% |
| Mid tier: 51% | Functional/Unit leaders: 41% | EMEA: 32% |
| Smaller Players: 20% | Managers: 42% | Americas: 23% |
Market-Sizing & Forecasting
Sizing starts with a top-down build where industrial output and asset intensity indicators are used to reconstruct the addressable demand pool for vibration monitoring across key end-user industries and regions, and then the spend is allocated by component mix. The totals are then corroborated with selective bottom-up approximations, such as sampled price-per-channel and sensor volumes, typical software attach rates, and service revenue shares gathered through channel checks and expert calls.
A few inputs that materially shape the model include the installed base and replacement cycle of rotating equipment (motors, pumps, fans, turbines), the share of plants running predictive maintenance programs, the split between online versus portable route-based monitoring, wireless adoption for hard-to-reach assets, and average selling price progression for sensors and monitoring systems. When a country or industry has thin public signals, gaps are handled using peer-market ratios and then adjusted after primary feedback confirms whether the adoption curve is ahead or behind.
For forecasting, we mainly apply scenario analysis, supported by time series smoothing on stable indicators, because adoption tends to move with maintenance budgets and new capacity additions rather than one single driver. Assumptions for growth in equipment additions, digitization pace, and service penetration are stress-tested with interview feedback before the final forecast is locked.
Data Validation & Update Cycle
Outputs are validated through triangulation across independent checks, including whether the implied spend per site and per critical asset is reasonable for each end-user group. Variance checks are run at region and industry level, and any step-change is reviewed to confirm it is tied to a real driver, such as a shift toward continuous monitoring or a change in pricing.
Before sign-off, the model and assumptions go through multi-step analyst review so arithmetic, units, and scope boundaries stay consistent year to year. Reports are refreshed annually, and interim updates are triggered when material events occur that can move demand or pricing. Right before delivery, a fresh pass is done to ensure the latest public signals and interview learnings are reflected in the final numbers.
Mordor Intelligence's Vibration Monitoring Market Sizing Compared With Other Published Estimates
It is common to see different market size numbers for vibration monitoring because studies pick different boundaries and timing choices, even when they use similar words for the same market. Differences in what gets counted as monitoring software, services, and connected condition monitoring bundles usually create most of the spread.
By tracking component mix by industry, checking online versus portable deployment shares, and refreshing key pricing assumptions through callbacks, Mordor Intelligence keeps the vibration monitoring total tied to a clear scope (hardware, software, and services) and a defined base year, which reduces over-counting from adjacent reliability and general maintenance activities.
Benchmark comparison
| Source | Market Size | Gaps in Research Methodology |
|---|---|---|
| Mordor Intelligence | USD 1.99 B (2026) | |
| Global Consultancy A | USD 1.70 B (2024) | Uses an earlier base year and can differ on what is treated as vibration monitoring versus broader predictive maintenance tooling, which shifts the included revenue pool and pricing level. |
| Industry Publisher B | USD 1.74 B (2023) | Anchors the estimate to 2023 and emphasizes offering and system-type cuts, which can understate later-cycle price changes and may apply a different split for services and software attach. |
The table shows that the gap is largely explained by base-year timing and scope boundary choices, followed by how pricing and software and service attach are updated. In our work, the steps are kept traceable to a small set of repeatable drivers, so buyers can see what moved the number and what did not.


Key Questions Answered in the Report
What is the current size of the vibration monitoring market?
The vibration monitoring market size stands at USD 1.99 billion in 2026 and is projected to reach USD 2.68 billion by 2031.
Which region dominates the vibration monitoring market?
North America leads with 36.55% of global revenue in 2025, driven by stringent safety regulations and extensive retrofit activity.
Why are wireless vibration sensors gaining popularity?
Wireless IIoT sensors cut installation costs, improve worker safety in hazardous zones, and now offer multi-year battery life with embedded analytics, supporting a 8.93% CAGR for wireless remote monitoring.
Which end-user industry is growing fastest?
Food and beverage is expanding at an 8.22% CAGR as continuous processing lines demand higher uptime and contamination avoidance.
What is hindering faster adoption of cloud-based monitoring?
Cyber-hardening requirements add 20–30% to project costs and raise data-sovereignty concerns, especially for small and mid-sized firms.
Are skilled analysts still needed with AI diagnostics?
Yes; while automated models handle routine faults, complex turbomachinery events often require ISO 18436-2-certified specialists, and a global shortage of such talent persists.
Page last updated on:





