Wireless Infrastructure Monitoring Market Size and Share
Market Overview
| Study Period | 2021 - 2031 |
|---|---|
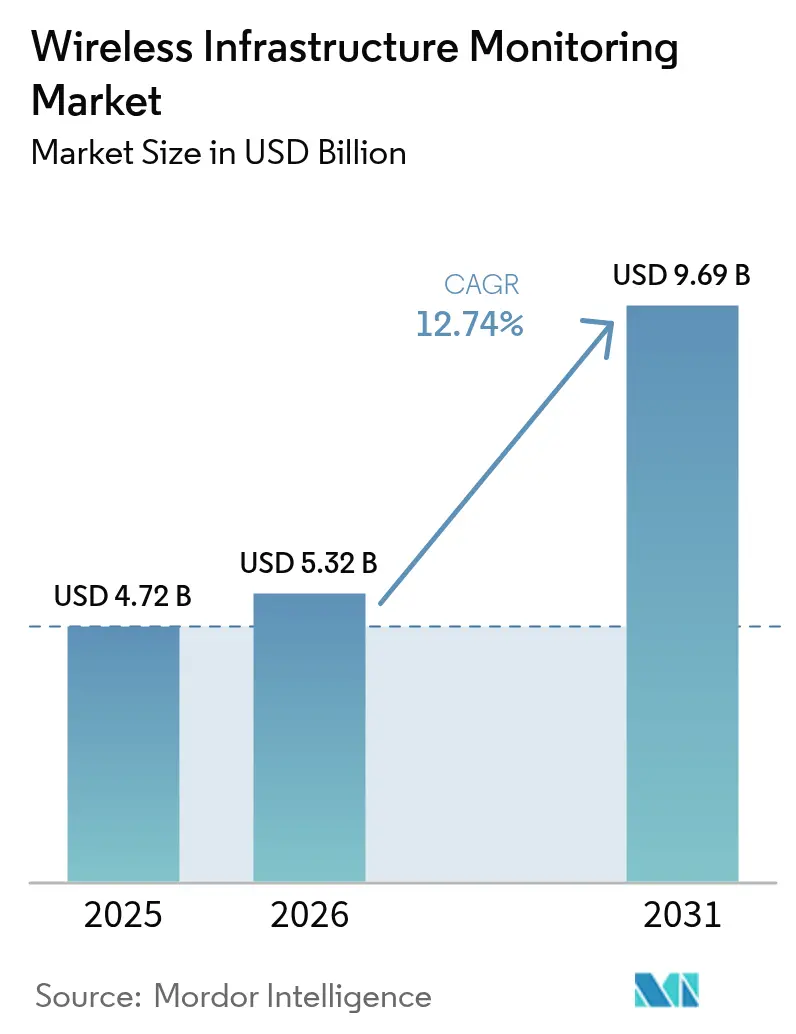
| Market Size (2026) | USD 5.32 Billion |
| Market Size (2031) | USD 9.69 Billion |
| Growth Rate (2026 - 2031) | 12.74% CAGR |
| Fastest Growing Market | Middle East and Africa |
| Largest Market | Asia Pacific |
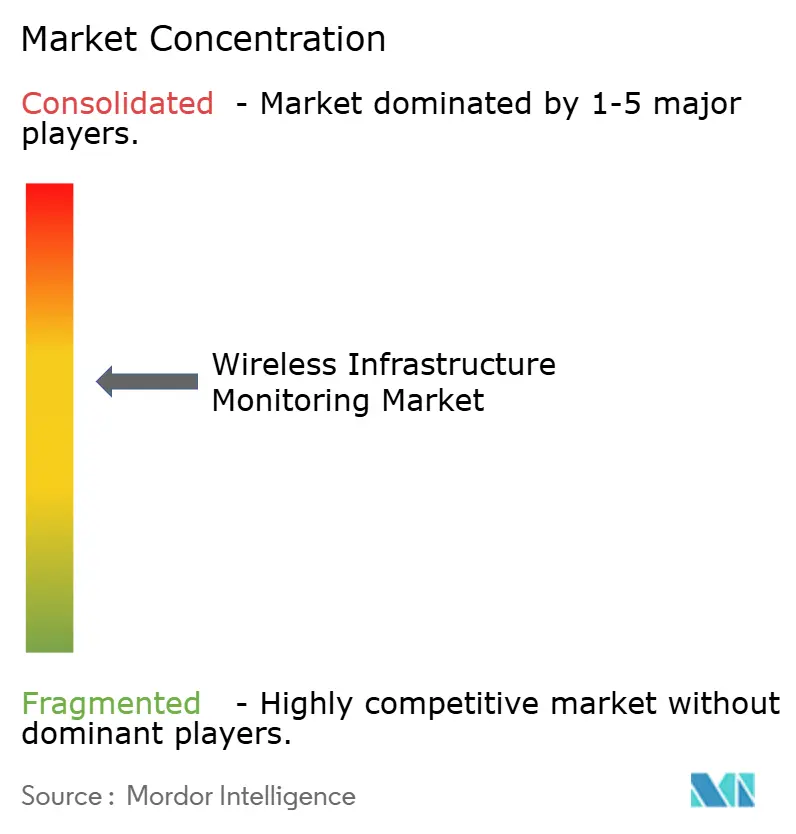
| Market Concentration | Medium |
Major Players *Disclaimer: Major Players sorted in no particular order Image © Mordor Intelligence. Reuse requires attribution under CC BY 4.0. | |
Wireless Infrastructure Monitoring Market Analysis by Mordor Intelligence
The wireless infrastructure monitoring market size is expected to grow from USD 4.72 billion in 2025 to USD 5.32 billion in 2026 and is forecast to reach USD 9.69 billion by 2031 at 12.74% CAGR over 2026-2031. Uptake is accelerating as infrastructure owners migrate from reactive to predictive maintenance, deploying dense, low-power sensor grids that cut downtime and extend asset life. Asia Pacific holds the largest regional position, buoyed by rapid urbanization and smart-city programs, while the Middle East delivers the fastest compound growth on the back of megaprojects and harsh-environment compliance requirements. Hardware remains the revenue backbone, but managed services and analytics now capture the greatest incremental value as end users seek actionable insights rather than devices. Convergence of LPWAN and 5G is expanding the addressable use-cases spectrum, particularly for high-bandwidth video analytics and AI-based anomaly detection.
Key Report Takeaways
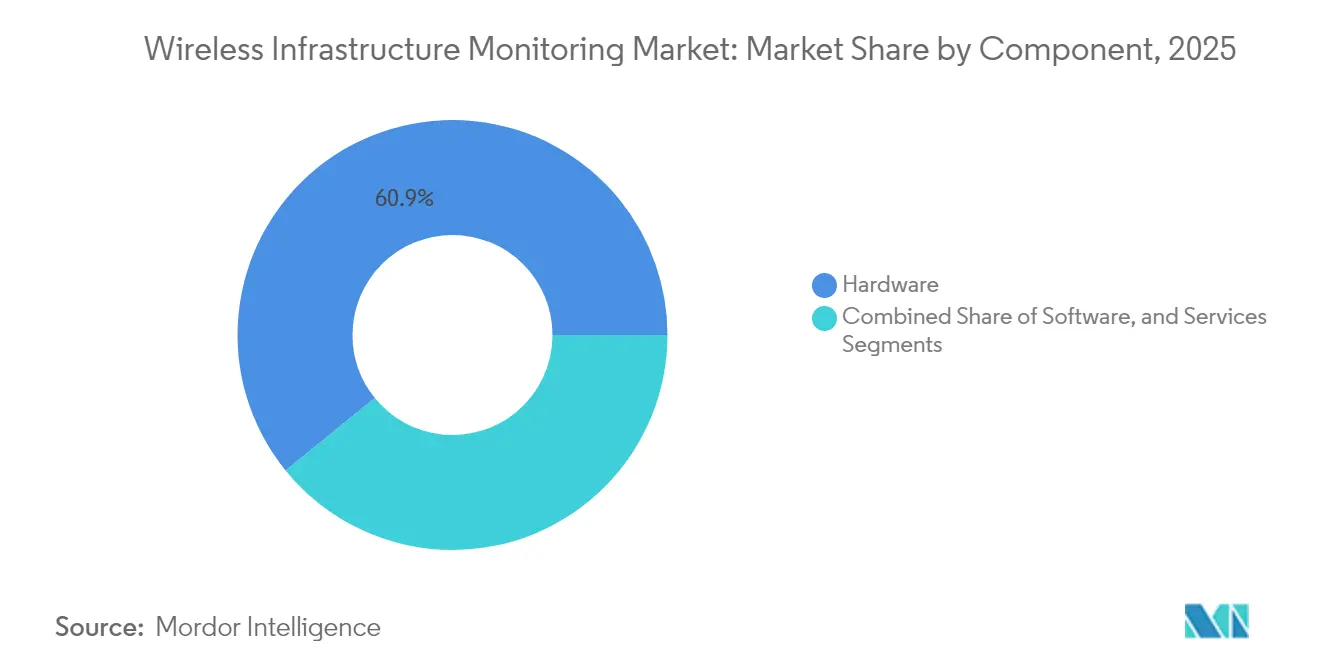
- By component, hardware commanded 60.85% of the wireless infrastructure monitoring market share in 2025; services are projected to expand at a 13.92% CAGR through 2031.
- By connectivity, LPWAN held 37.22% revenue share in 2025; 5G/cellular is the fastest-growing segment at a 13.54% CAGR to 2031.
- By application, structural monitoring accounted for a 45.62% share of the wireless infrastructure monitoring market size in 2025, while corrosion monitoring grew at a 13.98% CAGR to 2031.
- By infrastructure type, bridges and tunnels led with a 29.18% share in 2025; renewable energy assets exhibit the highest forecast CAGR at 13.32% through 2031.
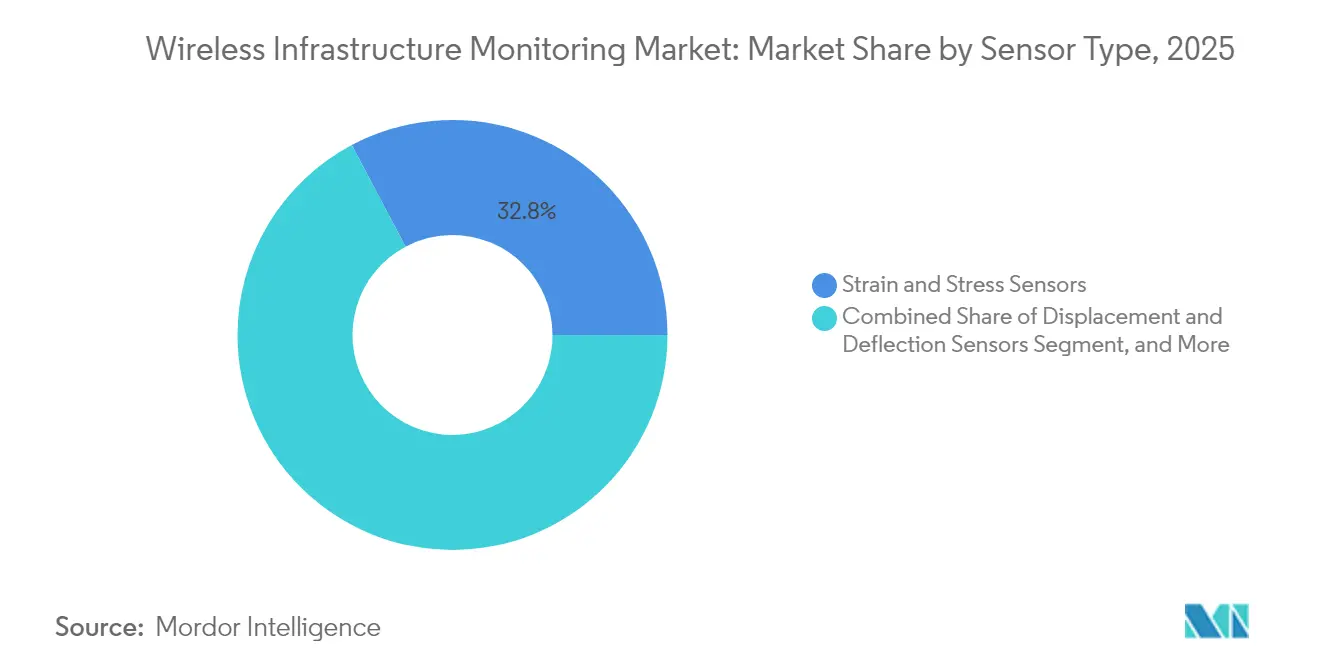
- By sensor, strain/stress gauges occupied 32.76% share in 2025; accelerometers/vibration sensors rise at a 15.26% CAGR to 2031.
- By end-user, civil infrastructure owners held 34.62% share in 2025; utilities and energy companies post the fastest 14.41% CAGR between 2026-2031.
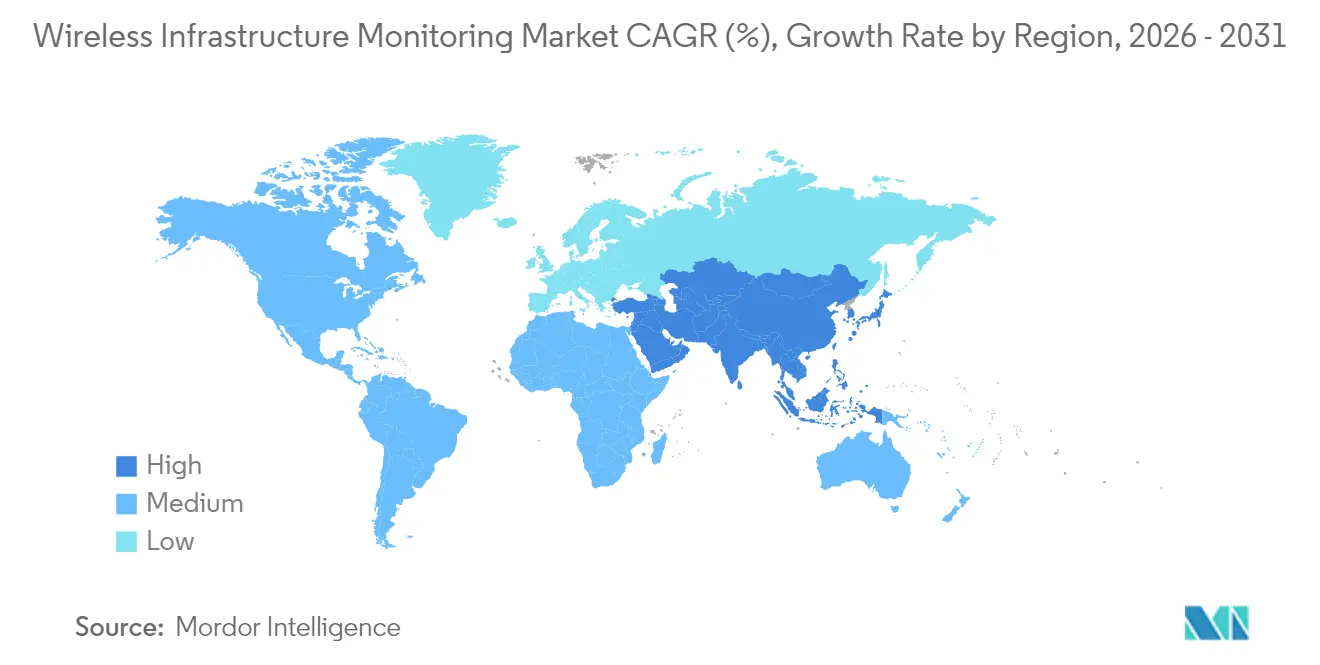
- By region, Asia Pacific captured 28.34% regional share in 2025; the Middle East is projected to grow at 14.06% CAGR to 2031.
Note: Market size and forecast figures in this report are generated using Mordor Intelligence’s proprietary estimation framework, updated with the latest available data and insights as of 2026.
Global Wireless Infrastructure Monitoring Market Trends and Insights
Drivers Impact Analysis*
| Driver | (~) % Impact on CAGR Forecast | Geographic Relevance | Impact Timeline |
|---|---|---|---|
| 5G roll-outs demanding tower integrity verification | +3.5% | Global; early uptake in North America, Europe, East Asia | Medium term (2-4 years) |
| Digital-twin mandates for aging bridges | +2.6% | North America and EU | Medium term (2-4 years) |
| LPWAN sensor cost decline enabling dense grids | +2.3% | Global; pronounced in developing regions | Short term (≤ 2 years) |
| Insurance-linked monitoring for tailings dams | +2.2% | Latin America; spillover to other mining hubs | Medium term (2-4 years) |
| Offshore-wind corrosion monitoring | +2.1% | Europe, East Asia, emerging North America | Long term (≥ 4 years) |
| Source: Mordor Intelligence | |||
5G roll-outs demanding tower integrity verification
The densification of 5G networks places heavier wind and vibrational loads on existing towers. Operators now embed continuous structural health monitoring to detect early fatigue, optimize maintenance scheduling, and ensure regulatory compliance. Real-time analytics have trimmed tower energy consumption by 20% through dynamic power adjustment.[1]Na Xu, “Design and Implementation of a Cloud-Based Energy Monitoring System for 5G Base Stations,” digital-library.theiet.org
Digital-twin mandates for aging bridges in the US & EU
Regulators increasingly require digital replicas supported by live sensor data, extending bridge lifespans by up to 20% while reallocating maintenance budgets toward assets exhibiting real structural stress. Sixty-six Horizon 2020 projects now target wireless inspection technologies.
LPWAN sensor cost decline enabling dense monitoring grids
Sensor price erosion of more than 35% since 2023 allows municipalities to deploy hundreds of nodes per structure, improving detection accuracy. A Bulgarian water-utility pilot confirmed LoRaWAN’s long-range and low-power benefits while meeting regulatory mandates.
Insurance-linked monitoring for tailings dams in LatAm
Insurers now demand real-time seepage and deformation data before underwriting high-risk mining assets. Compliance needs elevate reliability over price, favoring certified solution providers.
Restraints Impact Analysis*
| Restraint | (~) % Impact on CAGR Forecast | Geographic Relevance | Impact Timeline |
|---|---|---|---|
| Signal Attenuation inside Reinforced Concrete | -1.6% | Global, with higher impact in dense urban environments | Short term (≤ 2 years) |
| Data-Sovereignty Barriers for Cloud Analytics in ME | -0.8% | Middle East, with spillover to parts of Asia and Africa | Medium term (2-4 years) |
| Funding Gaps for Small Municipal Infrastructure Owners | -0.7% | Global, with higher impact in developing economies and rural areas | Long term (≥ 4 years) |
| Source: Mordor Intelligence | |||
Signal attenuation inside reinforced concrete
Steel rebar forms a Faraday cage, forcing integrators to add gateways or higher-power transmitters, raising capex and maintenance. New sub-GHz protocols such as VaiNet improve penetration, reducing repeater count.
Data-sovereignty barriers for cloud analytics in the Middle East
National mandates to localize data escalate deployment costs and fragment architectures. Multinationals must build in-country clouds or adopt on-premise analytics, delaying roll-outs. [2]International Monetary Fund, “Regional Economic Outlook: Middle East and Central Asia,” imf.org
*Our forecasts treat driver/restraint impacts as directional, not additive. The impact forecasts reflect baseline growth, mix effects, and variable interactions.
Segment Analysis
By Component: Services Gain Momentum Over Hardware Dominance
Hardware captured 60.85% of the wireless infrastructure monitoring market in 2025, owing to large-scale sensor roll-outs across bridges, dams, and energy assets. Yet, services are scaling at a 13.92% CAGR as owners prioritize insight extraction over device procurement. Managed analytics contracts now bundle hardware, gateways, and predictive dashboards, generating higher margins than product sales. Gateways that translate multiple protocols into unified data streams are the fastest-growing hardware sub-segment, enabling fleet-wide visibility. Packet Power notes that predictive maintenance can halve downtime and cut maintenance costs by 30%.
The software layer, though smaller, anchors long-term value. Vendors embed AI algorithms that transform raw time-series data into actionable alerts and automated work orders. As systems mature, differentiation shifts from sensor specs to outcome-based service level agreements, with vendors staking revenue on uptime guarantees. This service-centric model locks in recurring cash flows and raises switching costs, underpinning consolidation moves across the wireless infrastructure monitoring market.


By Connectivity Technology: LPWAN Holds Lead while 5G Unlocks High-Bandwidth Use-cases
LPWAN delivered 37.22% revenue in 2025, balancing multi-year battery life with kilometer-scale range. It underpins the majority of long-cycle civil-infrastructure deployments where data packets are small but frequent. Conversely, 5G/cellular revenues advance at 13.54% CAGR, powering real-time video feeds and edge-AI analytics for mission-critical assets. A hybrid deployment model leveraging LPWAN for baseline telemetry and 5G overlays for peak-data events is emerging as the reference architecture for nationwide wireless infrastructure monitoring systems. This integrated approach optimizes operating costs while maximizing bandwidth availability for advanced analytics and event-driven applications.
Bluetooth and Wi-Fi retain relevance for short-range building and industrial plants leveraging existing LAN coverage, while satellite links unlock remote, off-grid deployments. IEEE studies confirm the LPWAN-5G integration path as central to scaling billions of IoT nodes.
By Application: Structural Monitoring Dominates, Corrosion Detection Accelerates
Structural monitoring accounted for 45.62% of 2025 revenue, driven by aging bridges and seismic-prone geographies demanding continuous integrity checks. The wireless infrastructure monitoring market share for corrosion detection is expanding fastest at 13.98% CAGR to 2031, propelled by offshore wind farms and coastal infrastructure where saltwater accelerates degradation.
Integrated deployments correlate vibration, strain, and environmental data, yielding richer diagnostics than siloed installations. The iWindCr project validates miniature corrosion sensor arrays for turbine foundations.
By Infrastructure Type: Bridges Lead; Renewables Surge
Bridges and tunnels contributed 29.18% of 2025 spending as governments tackle deferred maintenance backlogs. Renewable energy assets, chiefly offshore wind, deliver the highest 13.32% CAGR, reflecting rapid capacity additions and harsh-condition monitoring needs.
Buildings adopt wireless sensors within smart-building strategies, while dams leverage long-range telemetry for early leak detection. Mining and oil-and-gas operators deploy resilience programs to satisfy insurer and regulator mandates, reinforcing the addressable scope for the wireless infrastructure monitoring market.
By Sensor Type: Strain Gauges Remain Cornerstone while Accelerometers Outpace
Strain/stress gauges held 32.76% revenue share in 2025, forming the backbone of structural health systems. Accelerometers and vibration sensors, however, register a 15.26% CAGR as multivariate analytics connect dynamic response data to fatigue modeling.
Temperature, humidity, and inclination sensors supply contextual parameters, enhancing model accuracy. Rising research output on smart sensor integration between 2019-2024 underscores technology maturation.
By End-user: Civil Infrastructure Owners Dominate; Utilities Scale Fast
Civil owners control 34.62% of the 2025 demand, funding sensor retrofits to prolong design lifespans. Utilities and energy firms are the fastest risers at 14.41% CAGR as grid modernization and renewable integration intensify monitoring needs.
Smaller municipalities embrace turnkey SCADA plus wireless monitoring to satisfy regulatory standards, illustrated by Seguin, Texas, upgrading its electrical utility network.
Geography Analysis
Asia Pacific retained 28.34% of global revenue in 2025, led by China, Japan, and South Korea, where IoT adoption supports national smart-city agendas. India’s smart-city mission and ASEAN infrastructure upgrades further widen the regional base. The Middle East is forecast to clock the fastest 14.06% CAGR through 2031, propelled by GCC megaprojects and mandatory monitoring standards for arid-climate resilience. Regional data-sovereignty rules, however, steer deployments toward localized clouds, shaping vendor go-to-market models across the wireless infrastructure monitoring market.
North America remains a mature but significant arena, channeling federal funds into bridge and roadway integrity programs. Insurance mandates expedite adoption for high-risk assets such as tailings dams. Europe leverages stringent safety directives and Horizon 2020 funding to extend the lifespans of mid-20th-century infrastructure, with digital twin pilots multiplying. South America focuses on mining and hydroelectric monitoring amid challenging topographies, whereas Africa, though nascent, offers greenfield opportunities aligning with new infrastructure investment waves.

Competitive Landscape
The wireless infrastructure monitoring market is moderately fragmented. Niche specialists supply rigorously certified sensors for targeted applications, while diversified technology firms integrate sensing, connectivity, and AI analytics into unified platforms. Strategic alliances between sensor makers, telecom operators, and engineering consultancies create one-stop solutions that span deployment, data analytics, and lifecycle services. Vendors increasingly pursue outcome-based contracts with predictive uptime guarantees, anchoring annuity revenues.
Disruptors exploit energy harvesting, MEMS miniaturization, and edge ML to overcome legacy hurdles such as battery life and signal attenuation. Certification from bodies like the American Bureau of Shipping provides market differentiation, particularly for offshore and maritime applications. Data-sovereignty trends encourage region-specific champions proficient in local compliance. M&A activity targets portfolio breadth and cross-selling into adjacent IoT verticals, signaling a gradual path toward consolidation.
Wireless Infrastructure Monitoring Industry Leaders
Acellent Technologies, Inc.
Monnit Corporation
Sisgeo S.r.l.
Campbell Scientific, Inc.
Geokon, Inc.
- *Disclaimer: Major Players sorted in no particular order

Recent Industry Developments
- April 2025: Hewlett-Packard Enterprise expanded its Aruba Networking Central platform to manage third-party devices, pursuing a heterogeneous-network observability strategy aimed at enterprise standardization.
- March 2025: UK’s DCC issued its 2025/26 plan prioritizing enhanced data access, connectivity resilience, and cybersecurity, reinforcing long-term smart-meter network stewardship.
- February 2025: NXP Semiconductors outlined seven wireless trends for 2025, spotlighting AI-enabled edge intelligence and Thread protocol advances that underpin future smart-building infrastructure.
- February 2025: Monnit won the IoT Breakthrough “Sensor Company of the Year” award, validating its long-range ALTA XL gateways and 10-year-life sensors for extended monitoring contracts.


Global Wireless Infrastructure Monitoring Market Report Scope
The wireless infrastructure monitoring equipment is the wireless internet-connected instrument or device that is used to anticipate the deterioration of infrastructure such as buildings, bridges, refineries, etc. to avoid any accidents in the future. They provide real-time data needed to understand the infrastructure status and the competence to further enumerate progress and enable optimal infrastructure management.
| Hardware | Sensors |
| Data Acquisition Systems | |
| Gateways and Comms Devices | |
| Software | |
| Services |
| Wi-Fi |
| Bluetooth |
| Zigbee |
| Cellular (3G/4G/5G) |
| LPWAN (LoRa, Sigfox, NB-IoT) |
| Satellite and Other Connectivity Technologies |
| Structural Monitoring |
| Geotechnical Monitoring |
| Environmental Monitoring |
| Seismic and Vibration Monitoring |
| Corrosion Monitoring |
| Other Specialized Applications |
| Bridges and Tunnels |
| Buildings and Commercial Structures |
| Dams and Water Infrastructure |
| Oil and Gas Pipelines and Refineries |
| Power Plants and Energy Facilities |
| Transportation Infrastructure (Rail, Roads, Airports) |
| Mining Sites |
| Renewable Energy Assets (Wind, Solar) |
| Strain and Stress Sensors |
| Displacement and Deflection Sensors |
| Accelerometers and Vibration Sensors |
| Temperature and Humidity Sensors |
| Inclination and Tilt Sensors |
| Other Sensor Types |
| Civil Infrastructure Owners and Operators |
| Oil and Gas Companies |
| Utilities and Energy Companies |
| Transportation Authorities |
| Mining Companies |
| Government and Defense |
| Other End-users |
| North America | United States |
| Canada | |
| Mexico | |
| South America | Brazil |
| Argentina | |
| Rest of South America | |
| Europe | United Kingdom |
| Germany | |
| France | |
| Italy | |
| Spain | |
| Nordics | |
| Rest of Europe | |
| Asia-Pacific | China |
| India | |
| Japan | |
| South Korea | |
| ASEAN | |
| Australia | |
| New Zealand | |
| Rest of Asia-Pacific | |
| Middle East and Africa | GCC |
| Turkey | |
| Israel | |
| South Africa | |
| Nigeria | |
| Rest of Middle East and Africa |
| By Component | Hardware | Sensors |
| Data Acquisition Systems | ||
| Gateways and Comms Devices | ||
| Software | ||
| Services | ||
| By Connectivity Technology | Wi-Fi | |
| Bluetooth | ||
| Zigbee | ||
| Cellular (3G/4G/5G) | ||
| LPWAN (LoRa, Sigfox, NB-IoT) | ||
| Satellite and Other Connectivity Technologies | ||
| By Application | Structural Monitoring | |
| Geotechnical Monitoring | ||
| Environmental Monitoring | ||
| Seismic and Vibration Monitoring | ||
| Corrosion Monitoring | ||
| Other Specialized Applications | ||
| By Infrastructure Type | Bridges and Tunnels | |
| Buildings and Commercial Structures | ||
| Dams and Water Infrastructure | ||
| Oil and Gas Pipelines and Refineries | ||
| Power Plants and Energy Facilities | ||
| Transportation Infrastructure (Rail, Roads, Airports) | ||
| Mining Sites | ||
| Renewable Energy Assets (Wind, Solar) | ||
| By Sensor Type | Strain and Stress Sensors | |
| Displacement and Deflection Sensors | ||
| Accelerometers and Vibration Sensors | ||
| Temperature and Humidity Sensors | ||
| Inclination and Tilt Sensors | ||
| Other Sensor Types | ||
| By End-user | Civil Infrastructure Owners and Operators | |
| Oil and Gas Companies | ||
| Utilities and Energy Companies | ||
| Transportation Authorities | ||
| Mining Companies | ||
| Government and Defense | ||
| Other End-users | ||
| By Geography | North America | United States |
| Canada | ||
| Mexico | ||
| South America | Brazil | |
| Argentina | ||
| Rest of South America | ||
| Europe | United Kingdom | |
| Germany | ||
| France | ||
| Italy | ||
| Spain | ||
| Nordics | ||
| Rest of Europe | ||
| Asia-Pacific | China | |
| India | ||
| Japan | ||
| South Korea | ||
| ASEAN | ||
| Australia | ||
| New Zealand | ||
| Rest of Asia-Pacific | ||
| Middle East and Africa | GCC | |
| Turkey | ||
| Israel | ||
| South Africa | ||
| Nigeria | ||
| Rest of Middle East and Africa | ||


Key Questions Answered in the Report
What is the current value of the wireless infrastructure monitoring market?
The market stands at USD 5.32 billion in 2026 and is projected to reach USD 9.69 billion by 2031 at a 12.74% CAGR.
Which region leads the wireless infrastructure monitoring market?
Asia Pacific holds the leading 28.34% revenue share due to extensive infrastructure expansion and smart-city initiatives.
Why are services growing faster than hardware in this market?
Asset owners seek predictive insights and uptime guarantees, making managed analytics and optimization services more valuable than standalone sensors.
What connectivity technology is most widely used?
LPWAN accounts for 37.22% of connectivity revenues, although 5G solutions are growing rapidly for high-bandwidth use-cases.
Which application segment is expanding the quickest?
Corrosion monitoring posts the highest 13.98% CAGR as offshore wind and marine assets require early detection of material degradation
How do data-sovereignty rules affect deployments in the Middle East?
In 2024, the Wireless Infrastructure Monitoring Market size was estimated at USD 4.11 billion. The report covers the Wireless Infrastructure Monitoring Market historical market size for years: 2019, 2020, 2021, 2022, 2023 and 2024. The report also forecasts the Wireless Infrastructure Monitoring Market size for years: 2026, 2027, 2028, 2029, 2030 and 2031.
Page last updated on:


