Offshore Structural Analysis Software Market Size and Share
Market Overview
| Study Period | 2019 - 2030 |
|---|---|
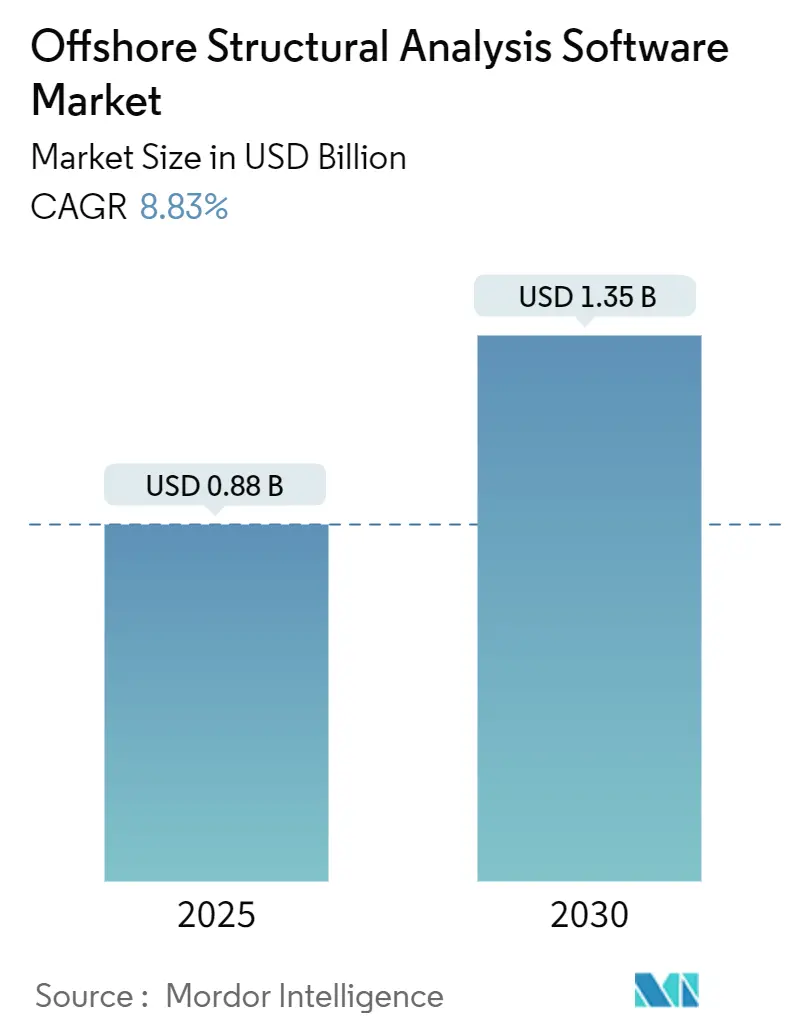
| Market Size (2025) | USD 0.88 Billion |
| Market Size (2030) | USD 1.35 Billion |
| Growth Rate (2025 - 2030) | 8.83% CAGR |
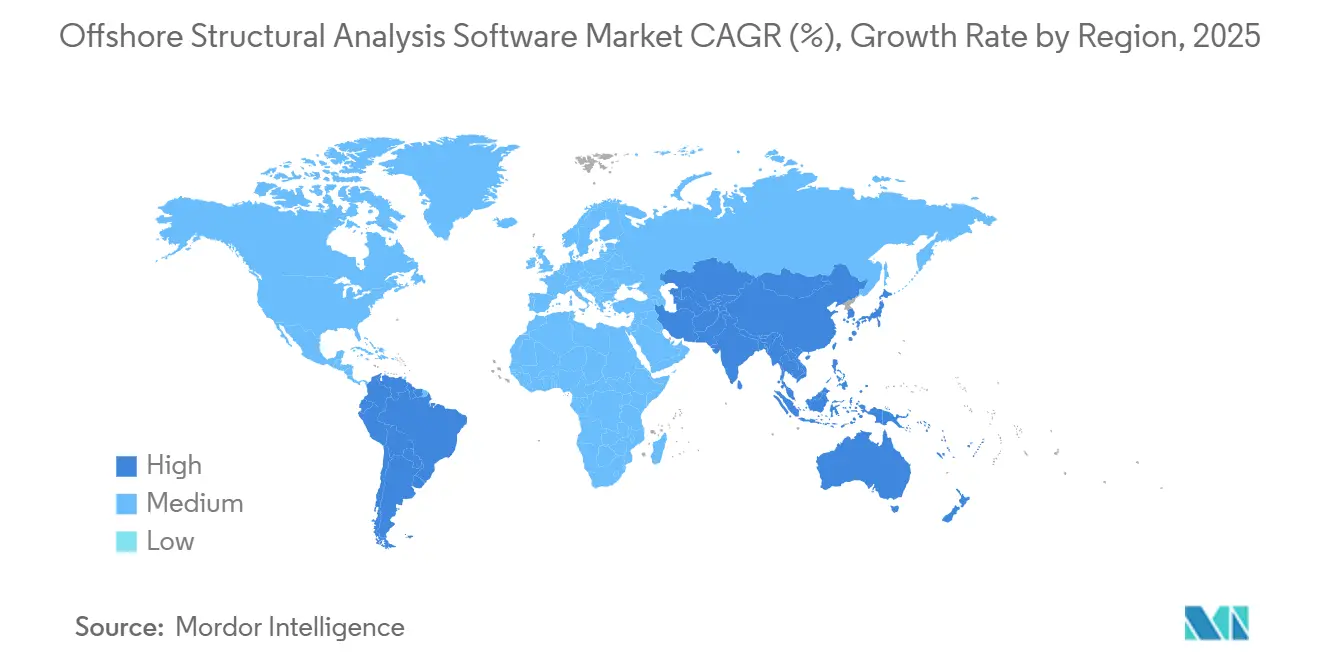
| Fastest Growing Market | Asia Pacific |
| Largest Market | Europe |
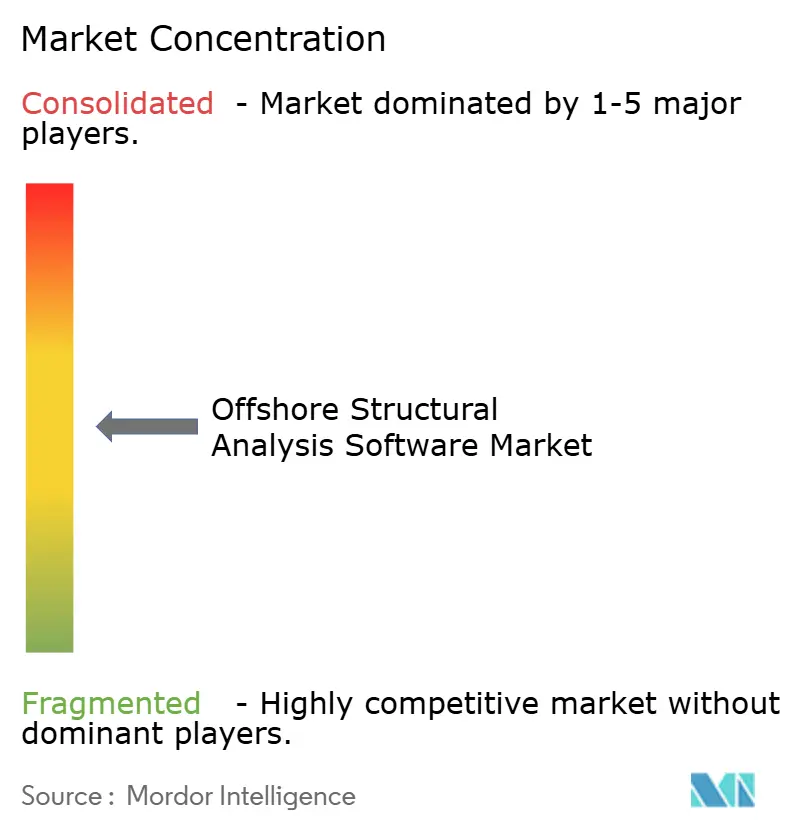
| Market Concentration | Medium |
Major Players *Disclaimer: Major Players sorted in no particular order Image © Mordor Intelligence. Reuse requires attribution under CC BY 4.0. | |
Offshore Structural Analysis Software Market Analysis by Mordor Intelligence
The offshore structural analysis software market size reached USD 880 million in 2025 and is forecast to reach USD 1.35 billion by 2030, reflecting an 8.83% CAGR over the period. This upward trajectory mirrors three converging forces: record offshore wind capacity awards, sustained deep-water oil and gas backlogs, and new digital-twin compliance mandates that accelerate software replacement cycles. Vendors secure higher margins by embedding cloud-native solvers and AI assistance, which shorten design iterations and trim inspection budgets. Operators increasingly prefer integrated suites that consolidate finite-element, hydrodynamic, and coupled aero-hydro-servo solvers inside one workspace, allowing real-time collaboration during complex installations. Competitive strategies center on subscription conversions, platform acquisitions, and patents that extend multi-physics modeling into emerging applications such as offshore hydrogen production and wave energy. Europe retains first-mover advantage through North Sea brownfield activity and aggressive offshore wind targets, yet Asia-Pacific delivers the steepest growth curve as China, Japan, and South Korea add floating wind capacity at scale.
Key Report Takeaways
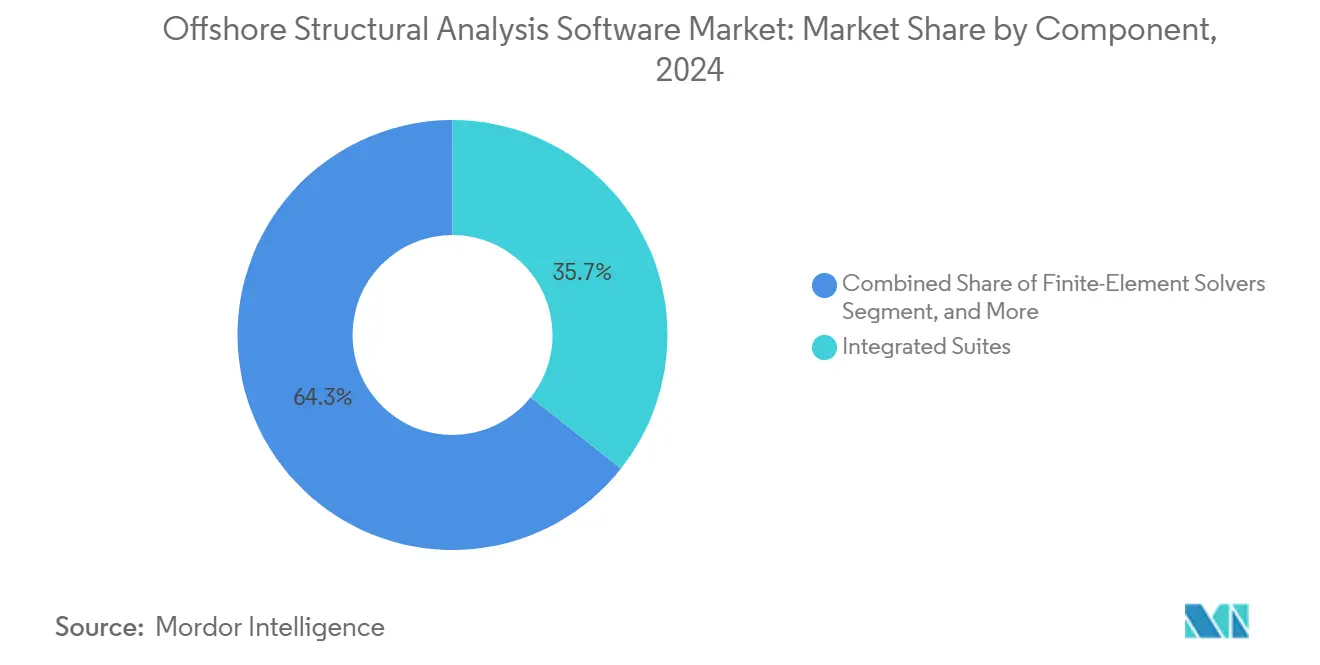
- By component, integrated suites led with 35.67% of offshore structural analysis software market share in 2024, while coupled aero-hydro-servo solvers are expanding at a 9.13% CAGR through 2030.
- By deployment model, on-premise licensing held 56.73% revenue share of the offshore structural analysis software market size in 2024, whereas cloud/SaaS is advancing at a 10.42% CAGR to 2030.
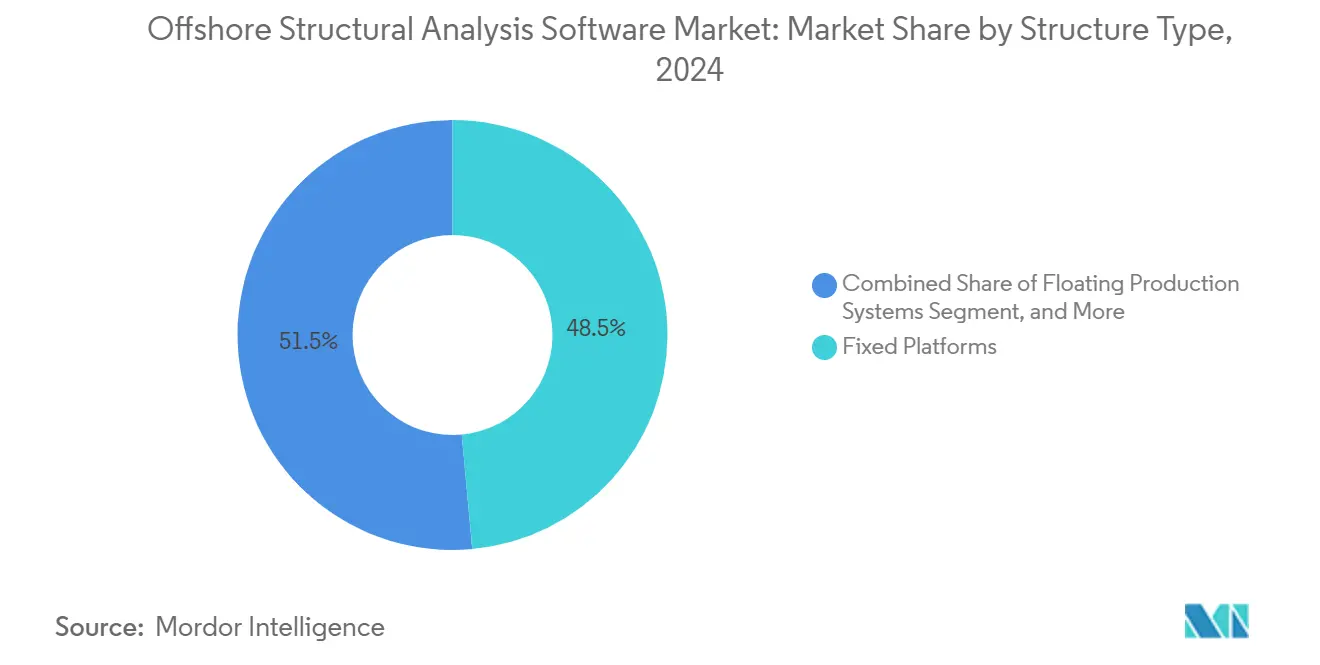
- By structure type, fixed platforms accounted for 48.53% share of the offshore structural analysis software market size in 2024 and offshore wind foundations are progressing at a 9.86% CAGR through 2030.
- By end-use industry, oil and gas captured 51.98% of offshore structural analysis software market share in 2024, yet wave and tidal energy is forecast to grow at a 9.34% CAGR to 2030.
- By geography, Europe commanded 33.38% revenue share in 2024, while Asia-Pacific is poised for the fastest expansion at an 8.98% CAGR to 2030.
Global Offshore Structural Analysis Software Market Trends and Insights
Drivers Impact Analysis*
| Driver | (~) % Impact on CAGR Forecast | Geographic Relevance | Impact Timeline |
|---|---|---|---|
| Rapid scale-up of fixed and floating offshore wind capacity awards | +2.1% | Europe and Asia-Pacific | Medium term (2-4 years) |
| Deep-water FPSO backlog driving Brownfield life-extension analysis | +1.8% | Brazil, West Africa, North Sea | Short term (≤ 2 years) |
| Mandatory digital-twin class rules for structural reassessment | +1.3% | Global | Medium term (2-4 years) |
| AI-assisted fatigue analytics reducing inspection budgets | +1.1% | North America and Europe | Long term (≥ 4 years) |
| Tier-1 EPCs outsourcing FEED to software-embedded services | +0.8% | Global EPC hubs | Short term (≤ 2 years) |
| Cloud-native high-performance computing bundles | +0.7% | Digitally mature markets | Medium term (2-4 years) |
| Source: Mordor Intelligence | |||
Rapid scale-up of fixed and floating offshore wind capacity awards (2025-2030)
Global offshore wind auctions accelerated during 2024, and new awards feature 15 MW to 30 MW turbines that demand coupled aero-hydro-servo analysis rather than simple finite-element checks. DNV’s 2024 load-and-site standard compels more granular modeling, prompting many asset owners to upgrade to premium solvers.[1]DNV, “New Standard for Wind Turbine Loads and Site Conditions,” dnv.com Lloyd’s Register issued companion guidelines for floating supports, which push vendors to certify modules against multiple class rules. The growing share of deep-water projects in Japan and California also stokes demand for frequency-domain models that capture complex platform dynamics. Because floating foundations must minimize mass while ensuring global stability, operators gravitate toward integrated suites that optimize hull geometry across thousands of load cases. The driver, therefore, adds direct licensing revenue and lifts consulting services tied to calibration and validation.
Deep-water FPSO backlog driving Brownfield life-extension analysis
Saipem’s USD 34 billion order book confirms sustained FPSO construction, much of it tied to Brazil’s pre-salt and West Africa’s ultra-deep fields.[2]Saipem, “Annual Report 2024,” saipem.com Operators require software that fuses finite-element analysis with real-time sensor feeds, allowing continuous structural health checks as hulls remain on station for 25 years. Petrobras and Shell programs already log petabytes of strain-gauge data, driving adoption of AI-enhanced analytics that pinpoint fatigue hot-spots. Classification societies now demand digital-twin reassessments every five years, shortening software refresh cycles. As a result, the offshore structural analysis software market captures incremental revenue from brownfield audits as well as newbuilds.
Mandatory digital twin class-rules (ABS, DNV) for structural reassessment
ABS SafeHull and DNV’s digital-twin guide obligate asset owners to prove model fidelity against live sensor inputs, replacing purely schedule-based surveys. Compliance demands cloud-ready architectures that integrate operational data, environmental loads, and inspection records in near real time. Vendors who secure early certification gain access to premium pricing tiers because operators prioritize class-approved toolchains. The rule change spans oil, gas, wind, and wave structures, creating a unified upgrade cycle that lifts overall software demand through 2030. Integrated suites with open APIs outperform niche solvers because they simplify data interchange across hull, mooring, and topside systems.
AI-assisted fatigue analytics slashing inspection budgets by >20%
Machine-learning models analyze multiyear response histories to forecast crack initiation and growth, letting owners postpone diver or drone campaigns without compromising safety. North Sea operators report inspection budgets dropping by 22% within one season after deploying AI modules embedded in mainstream suites.[3]Ansys, “Ansys Announces Q4 and FY 2024 Financial Results,” investors.ansys.com The value proposition is clear for floating wind farms where access costs dominate OPEX. Vendors embed neural networks that auto-classify stress cycles and suggest optimal monitoring frequencies. As more case studies validate savings, AI becomes a must-have feature, and subscription renewals trend upward.
Restraints Impact Analysis*
| Restraint | (~) % Impact on CAGR Forecast | Geographic Relevance | Impact Timeline |
|---|---|---|---|
| Scarcity of validated met-ocean data for frontier basins | -1.2% | Emerging offshore regions | Long term (≥ 4 years) |
| Slow code-update cycles for floating wind design standards | -0.9% | Floating wind markets | Medium term (2-4 years) |
| Cyber-security certification gaps for SaaS solvers | -0.6% | Regulated industries | Short term (≤ 2 years) |
| Inertia of legacy in-house codes among NOCs | -0.4% | NOC-dominated regions | Long term (≥ 4 years) |
| Source: Mordor Intelligence | |||
Scarcity of validated met-ocean data for frontier basins
Offshore developers targeting South American or African coastlines often face limited wave, wind, and current datasets, forcing overly conservative load factors that inflate steel tonnage. The gap slows project final investment decisions and, by extension, software licensing. Brazil’s nascent wind market illustrates the challenge, where incomplete hind-cast records undermine bankability despite 16 GW ambitions. Vendors respond by partnering with satellite data firms but must still fund field-measurement campaigns, raising entry costs.
Slow code-update cycles for floating wind design standards
Floating wind prototypes outpace formal rule writing by IEC and class societies, causing regional variations in safety factors and analysis workflows. Developers hesitate to lock into a solver until standardization is clarified, delaying purchases. Vendors that bet on one interpretation risk costly rewrites if future codes diverge. The uncertainty drags on software sales despite clear technology needs, especially in the Asia-Pacific, where governments await harmonized guidelines.
*Our forecasts treat driver/restraint impacts as directional, not additive. The impact forecasts reflect baseline growth, mix effects, and variable interactions.
Segment Analysis
By Component: Integrated suites anchor complex multi-physics workflows
Integrated suites held 35.67% revenue in 2024, underscoring operator preference for single-vendor ecosystems that reduce data-transfer errors. This dominance translates into recurring subscription streams that lift the offshore structural analysis software market size when renewals add advanced AI or cloud modules. Coupled aero-hydro-servo solvers post the swiftest 9.13% CAGR due to floating wind projects that expose platform-turbine interaction limits not solved by legacy finite-element tools. Vendors differentiate through GPU acceleration and automated frequency-domain tuning that optimizes hull mass within design-load envelopes. Academic validation of 10-MW to 30-MW floating platforms confirms measurable weight savings, converting directly to lower capex. Finite-element and hydrodynamic modules remain necessary but increasingly bundle into larger platform offerings.
Second-generation suites integrate design space exploration, sensor fusion, and class-rule templates inside collaborative dashboards. This convergence lets project teams simulate construction lifts, towing routes, and in-situ operations inside one environment. The approach trims interface training, accelerates approvals, and locks customers into multi-year contracts. Meanwhile, specialist component vendors struggle to reach scale, driving acquisition interest from larger players who seek to close capability gaps.


By Deployment Model: Cloud migration gains pace amid guarded security postures
On-premise solutions retained 56.73% share in 2024 because national oil companies and defense agencies remain wary of remote data storage. Even so, cloud and SaaS subscriptions post a 10.42% CAGR, making them the growth engine inside the offshore structural analysis software market. Operators pivot after proof-points such as HCLTech’s Windchill move to AWS, which cut compute costs 20% and raised collaboration speed. Cloud-native solvers enable “design-during-installation,” supporting live recalculations when vessel weather windows change. Vendors counter cyber-security concerns by adopting zero-trust frameworks and pursuing ISO 27001 along with class society cyber endorsements.
Hybrid deployment options-local solver with cloud burst-offer a compromise, letting sensitive cases stay behind firewalls while large Monte-Carlo runs leverage rented GPUs. Pricing shifts toward usage-based models, aligning expense with project milestones. As corporate digital-transformation roadmaps mature, cloud adoption spreads from tier-one EPC hubs to mid-tier fabricators, widening the addressable base.
By Structure Type: Fixed assets dominate, floating foundations surge
Fixed jackets and monopiles still account for 48.53% of 2024 revenue, reflecting decades-long North Sea and Gulf of Mexico production. However, the fastest 9.86% CAGR stems from offshore wind foundations, now the main incremental driver inside the offshore structural analysis software market size. Europe’s Celtic Sea and Asia-Pacific’s Ulsan basin spearhead floating designs that require coupled dynamics across moorings, turbines, and hulls. Deep-water FPSOs sustain steady demand; their life-extension assessments call for nonlinear time-domain fatigue checks that reward high-performance solvers.
The expanding turbine scale magnifies platform-structure interaction, forcing designers to iterate mooring layouts within tight cost envelopes. Vendors that automate parametric optimization see rising license counts per project. Meanwhile, wave-induced resonance on floating hydrogen plants introduces new load cases, nudging product roadmaps toward broader multi-energy coverage.
By End-use Industry: Oil and gas holds sway yet marine renewables accelerate
Oil and gas operators still delivered 51.98% of 2024 spending, buoyed by brownfield upgrades and ongoing deep-water exploration. Yet wave and tidal developers deliver the sharpest 9.34% CAGR as pilot arrays in Scotland, Canada, and Australia secure feed-in tariffs. Offshore wind contributes the largest absolute growth, with gigawatt-class lease awards underpinning multi-year simulation contracts. The offshore structural analysis software industry adapts by offering renewable-specific libraries that model articulated energy converters and power-take-off dampers.
Defense and research vessels present niche demand for extreme-sea-state checks, often specifying military-grade encryption inside solver binaries. Vendors that navigate export controls and secure government clearances unlock premium margins. Combined, these cross-sector needs support diversified revenue streams that offset commodity pricing in mainstream oil and gas.
Geography Analysis
Europe’s 33.38% revenue share reflects the continent’s mature oil and gas base layered with aggressive wind targets. North Sea brownfield programs drive repeat licenses for fatigue reassessments, while the United Kingdom’s Contracts-for-Difference auctions underpin multi-gigawatt wind farm pipelines. Norway channels sovereign wealth into floating prototypes, reinforcing demand for coupled solvers. France and Ireland accelerate floating pilot parks, further solidifying Europe’s lead. Classification bodies headquartered in the region, including DNV and Lloyd’s Register, hasten digital-twin certification cycles, which in turn boost software upgrades.
Asia-Pacific grows the quickest at 8.98% CAGR as China commissions monopile fleets in shallow Bohai waters and prepares semi-submersible demonstrators for deeper Yellow Sea sites. Japan allocates acreage off Akita and Goto for floating foundations, prompting domestic shipyards to adopt integrated suites. South Korea’s Green New Deal funds gigawatt-scale projects near Ulsan, pushing local EPCs toward AI-enabled solvers for mooring optimization. Australia opens its first offshore wind zones, and Taiwan extends grid capacity, both adding license opportunities.
North America maintains steady growth via Gulf of Mexico FPSO redeployments and U.S. Atlantic wind leases. The Inflation Reduction Act’s tax credits lift economic cases for 1.5 GW projects, compelling developers to procure American Bureau of Shipping-compliant solvers. Brazil’s promise of 16 GW by 2050 remains conditional on validated met-ocean data, but early environmental studies already trigger feasibility analyses. Middle East shallow-water platforms need seismic retrofit checks, offering moderate but stable demand. Africa’s nascent hydrocarbon plays in Namibia and Senegal open exploratory modeling contracts, though uptake hinges on foreign investment.

Competitive Landscape
Market concentration sits in the mid-range as a cluster of global vendors—ANSYS, Siemens, Bentley Systems, Dassault Systèmes, and DNV—control core technologies. ANSYS posted USD 2.54 billion 2024 revenue before agreeing to a USD 35 billion takeover by Synopsys, signaling large-cap appetite for simulation breadth. Siemens closed a USD 10.6 billion Altair deal in March 2025, adding marine solvers such as MAESTRO that extend its digital-twin stack. Bentley advances iTwin integrations that merge structural analysis with asset-performance analytics, while Dassault’s 3DEXPERIENCE logs 14% subscription growth through 2025.
Emerging challengers pursue cloud-only offerings with consumption billing and embedded machine learning. They exploit gaps in AI fatigue diagnostics and wave energy converter dynamics where incumbents still rely on add-on modules. Patent filings for floating hydrogen platform stability and deep-water mooring optimization rose 18% in 2024, indicating technology flux. Vendors differentiate by acquiring domain-specific libraries or forming data partnerships that resolve frontier basin met-ocean scarcity.
Pricing shifts from perpetual to annual value licenses, bundled with engineering consultancy to smooth learning curves. Consolidation continues as private-equity-backed firms absorb niche solver houses to bolster renewable credentials. Clients favor suppliers who secure both ISO and class-society cyber certifications, raising barriers for smaller entrants. The resulting landscape combines scale advantages with open API ecosystems that invite third-party plug-ins, balancing innovation with reliability.
Offshore Structural Analysis Software Industry Leaders
Bentley Systems, Incorporated
DNV AS
Orcina Ltd.
Altair Engineering Inc.
Dlubal Software GmbH
- *Disclaimer: Major Players sorted in no particular order

Recent Industry Developments
- July 2023: Dassault Systèmes reported EUR 1.52 billion (USD 1.67 billion) Q2 revenue, up 6%, with 20% growth in 3DEXPERIENCE software tied to offshore projects.
- March 2025: Siemens closed the USD 10.6 billion Altair acquisition, enhancing simulation depth for marine structures.
- February 2025: ANSYS posted record Q4 2024 sales of USD 882.2 million amid rising offshore demand.
- February 2025: Synopsys confirmed regulatory progress on its USD 35 billion ANSYS merger, slated to finalize in H1 2025.


Global Offshore Structural Analysis Software Market Report Scope
| Finite-Element Solvers |
| Hydrodynamic Modules |
| Coupled Aero-Hydro-Servo Solvers |
| Integrated Suites |
| On-premise Licensing |
| Cloud / SaaS |
| Fixed Platforms |
| Floating Production Systems (FPSO, Semi-submersible, TLP, Spar) |
| Offshore Wind Foundations (Monopile, Jacket, Floating) |
| Oil and Gas |
| Offshore Wind |
| Wave and Tidal Energy |
| Marine and Naval |
| North America | |
| Europe | |
| Asia-Pacific | |
| South America | |
| Middle East and Africa | Middle East |
| Africa |
| By Component | Finite-Element Solvers | |
| Hydrodynamic Modules | ||
| Coupled Aero-Hydro-Servo Solvers | ||
| Integrated Suites | ||
| By Deployment Model | On-premise Licensing | |
| Cloud / SaaS | ||
| By Structure Type | Fixed Platforms | |
| Floating Production Systems (FPSO, Semi-submersible, TLP, Spar) | ||
| Offshore Wind Foundations (Monopile, Jacket, Floating) | ||
| By End-use Industry | Oil and Gas | |
| Offshore Wind | ||
| Wave and Tidal Energy | ||
| Marine and Naval | ||
| By Geography | North America | |
| Europe | ||
| Asia-Pacific | ||
| South America | ||
| Middle East and Africa | Middle East | |
| Africa | ||


Key Questions Answered in the Report
What is the projected value of the offshore structural analysis software market in 2030?
The offshore structural analysis software market size is forecast to reach USD 1.35 billion by 2030.
Which region is growing the fastest through 2030?
Asia-Pacific is expanding at an 8.98% CAGR, supported by China’s wind build-out and Japan’s floating projects.
Which component segment is experiencing the highest growth?
Coupled aero-hydro-servo solvers are advancing at a 9.13% CAGR because floating wind requires multi-physics models.
How quickly is cloud deployment expanding?
Cloud and SaaS solutions are recording a 10.42% CAGR as firms adopt real-time collaborative analysis.
What impact do AI fatigue analytics have on inspection costs?
Early deployments report more than 20% reductions in offshore inspection budgets when AI modules predict fatigue hotspots.
Why are digital-twin class rules important?
New ABS and DNV rules require continuous structural monitoring, driving operators to upgrade to certified digital-twin software.
Page last updated on:


