Market Overview
| Study Period | 2020 - 2031 |
|---|---|
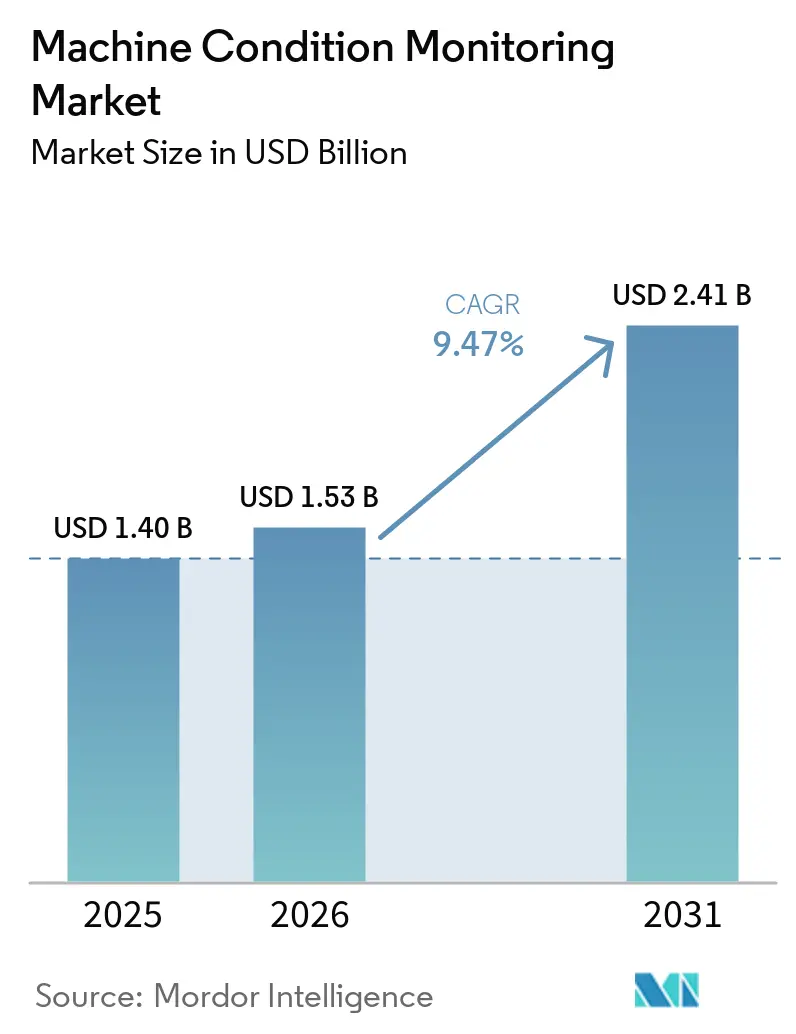
| Market Size (2026) | USD 1.53 Billion |
| Market Size (2031) | USD 2.41 Billion |
| Growth Rate (2026 - 2031) | 9.47% CAGR |
| Fastest Growing Market | Asia Pacific |
| Largest Market | North America |
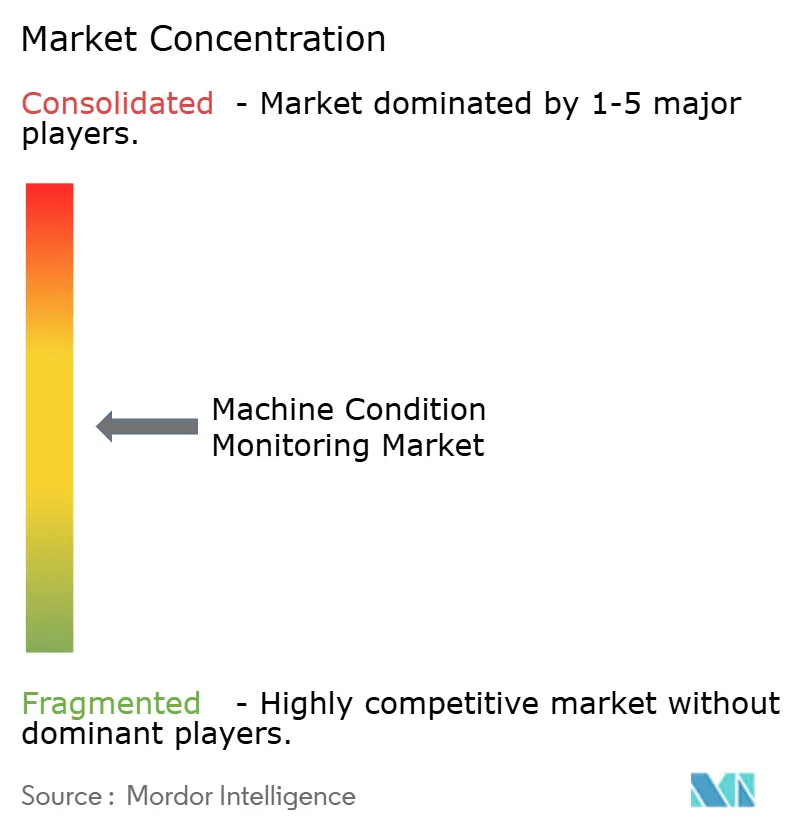
| Market Concentration | Medium |
Major Players
*Disclaimer: Major Players sorted in no particular order Image © Mordor Intelligence. Reuse requires attribution under CC BY 4.0. |
|
Machine Condition Monitoring Market Analysis by Mordor Intelligence
The machine condition monitoring market size was valued at USD 1.4 billion in 2025 and estimated to grow from USD 1.53 billion in 2026 to reach USD 2.41 billion by 2031, at a CAGR of 9.47% during the forecast period (2026-2031). The shift from reactive repair to data-driven predictive maintenance underpins this momentum, supported by rising wireless IIoT sensor deployments and AI-enabled diagnostics platforms that shorten decision cycles. Industrial producers face constrained workforces and escalating uptime targets, which heighten demand for automated fault-detection systems. Wireless sensor nodes paired with edge analytics reduce total cost of ownership and unlock coverage for smaller, previously unmonitored assets. Sustainability mandates further elevate adoption because continuous insight into energy performance helps manufacturers meet emissions disclosure rules. Competitive intensity remains moderate as incumbents rely on installed-base scale while AI-centric entrants contest value through advanced analytics and SaaS delivery.
Key Report Takeaways
- By offering, hardware commanded 44.40% revenue share in 2025; wireless IIoT sensors are projected to advance at a 12.22% CAGR through 2031.
- By monitoring technique, vibration analysis led with 33.75% of the machine condition monitoring market share in 2025, whereas ultrasound emission is set to expand at an 11.62% CAGR to 2031.
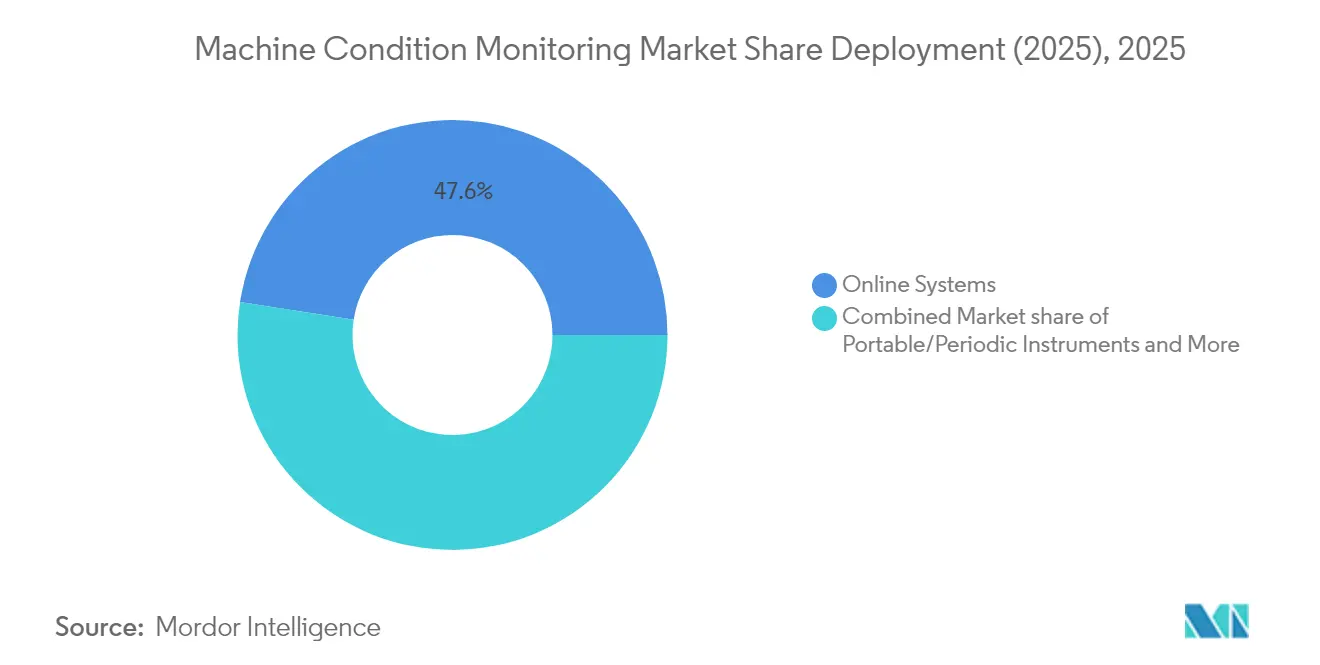
- By deployment, online and continuous systems accounted for 47.55% of the machine condition monitoring market size in 2025; wireless IIoT sensor networks exhibit the strongest 12.22% CAGR outlook.
- By end-user industry, oil and gas operations generated 27.05% of 2025 revenue, while food and beverage manufacturing shows the fastest 10.39% CAGR through 2031.
- By geography, North America captured 32.10% revenue in 2025; the Asia-Pacific region is projected to grow at a 9.78% CAGR to 2031.
Note: Market size and forecast figures in this report are generated using Mordor Intelligence’s proprietary estimation framework, updated with the latest available data and insights as of 2026.
Global Machine Condition Monitoring Market Trends and Insights
Drivers Impact Analysis*
| Driver | (~) % Impact on CAGR Forecast | Geographic Relevance | Impact Timeline |
|---|---|---|---|
| Predictive-maintenance focus to cut unplanned downtime | +2.1% | Global | Medium term (2-4 years) |
| Adoption of Industry 4.0 edge-analytics platforms | +1.8% | North America, EU, APAC core | Medium term (2-4 years) |
| Surging asset-intensive sectors in emerging Asia | +1.4% | APAC core, spill-over to MEA | Long term (≥ 4 years) |
| Wireless IIoT sensors slashing total cost of ownership | +1.6% | Global | Short term (≤ 2 years) |
| ESG-driven push for energy-efficient plant operations | +1.3% | Europe and North America | Medium term (2-4 years) |
| Military & space programs requiring zero-fault tolerance (under-the-radar) | +1.1% | North America and select defense economies | Long term (≥ 4 years) |
| Source: Mordor Intelligence | |||
Predictive-maintenance focus to cut unplanned downtime
Manufacturing operations lose USD 50 billion each year to surprise stoppages, so firms are replacing calendar-based servicing with predictive approaches that trim downtime by 20–50% and maintenance spend by 5–10% [1]IEN, "Realizing the Fulfillment of Industry 4.0 with Predictive and Prescriptive Maintenance", IEN, ien.com . Machine-learning algorithms draw on multi-sensor data streams to pinpoint failures weeks ahead, letting teams intervene during scheduled pauses. Automotive plants show success as BMW and Tesla extend equipment life cycles using real-time analytics . Digital twin models refine schedules by simulating wear scenarios and optimizing parts procurement.
Adoption of industry 4.0 edge-analytics platforms
Edge processing moves analytics to the sensor node, eliminating latency while maintaining insight during network outages. STMicroelectronics positions its microcontrollers for condition monitoring use cases that require sub-second detection [3]STMicroelectronics, "Condition Monitoring / Predictive Maintenance", STMicroelectronics, st.com. Siemens’ SIMOCODE M-CP embeds monitoring within motor control centers via Single Pair Ethernet, trimming wiring effort and extending diagnostics to smaller motors [2]Siemens AG, "Siemens Unveils Innovative Motor Management System for Industrial Switchboards" Siemens AG, press.siemens.com. Early adopters report millisecond-level anomaly detection and bandwidth cuts of up to 50%.
Surging Asset-intensive sectors in emerging Asia
New greenfield factories across China, India, and Southeast Asia integrate predictive systems from day one, avoiding retrofit complexity. Orders for automation and digitalization at Epiroc reached record highs as regional miners prioritized productivity and safety. At IEEE SENSORS 2024, more than 680 peer-reviewed papers showcased next-generation sensors relevant to machine health . Government smart-manufacturing incentives accelerate deployment by offsetting capital costs.
Wireless IIoT sensors slashing total cost of ownership
Removing cables cuts installation expense by up to 70%. Bluetooth Low Energy and LoRaWAN protocols deliver multi-year battery life, making coverage of secondary assets economically viable SKF’s Enlight Collect IMx-1-EX provides intrinsic safety for hazardous zones while enabling predictive workflows . Honeywell’s Versatilis Experion EHM transmits over LoRaWAN to visualize trends and alarms across sprawling sites.
ESG-driven push for energy-efficient plant operations
Mandatory disclosures on greenhouse gases now cover large US filers under SEC rules and corporations operating in Europe under CSRD guidelines, forcing visibility into asset efficiency. Monitoring platforms track power consumption drift and flag degrading components, helping firms sustain energy gains. The US Better Buildings Initiative recorded 3.6 quadrillion Btu saved through data-guided efficiency, illustrating value for process industries.
Restraints Impact Analysis*
| Restraint | (~) % Impact on CAGR Forecast | Geographic Relevance | Impact Timeline |
|---|---|---|---|
| Retrofit cost for legacy brown-field assets | -1.30% | Global, North America, Europe | Short term (≤ 2 years) |
| Shortage of vibration-analysis specialists | -0.80% | Global | Medium term (2-4 years) |
| Source: Mordor Intelligence | |||
Retrofit cost for legacy brown-field assets
Older facilities rarely feature sensor mounts or network backbones, so rollout involves engineering changes, safety approvals, and staged shutdowns that can stretch over 18 months. The US Marine Corps flagged conflicting legacy policies as barriers during Condition Based Maintenance Plus adoption, echoing similar struggles in civilian process plants. Wireless devices ease wiring pain yet power delivery and hazardous-area certification still raise budgets, prompting firms to phase projects by criticality.
Shortage of vibration-analysis specialists
Expert interpreters retire faster than universities replace them. Traditional signal processing mastery often takes five years, limiting user confidence in large-scale deployment. Technology vendors respond with AI modules that pre-classify anomalies; ABB and Cochl apply machine listening to automate fault diagnostics, narrowing dependence on scarce skills . Easy-to-read dashboards extend coverage to small and midsize enterprises.
*Our forecasts treat driver/restraint impacts as directional, not additive. The impact forecasts reflect baseline growth, mix effects, and variable interactions.
Segment Analysis
By Offering: Hardware Leads as Software Adds Intelligence
Hardware claimed 44.40% of 2025 revenue, underscoring the indispensable role of sensors, gateways, and acquisition units in every installation. This segment benefits from steady advances in micro-electromechanical systems that boost sensitivity while lowering power draw. Siemens blended hardware with licensable analytics modules in its SIMOCODE M-CP to simplify adoption for switchboard users . Services revenue expands as manufacturers outsource round-the-clock surveillance; SKF’s USD 60 million agreement with LKAB packages vibration measurements and remote diagnostics into a multi-year contract.
Wireless IIoT sensor networks are forecast to grow at 12.22% annually, underlining customer preference for low-touch retrofits. As adoption broadens, integrated platforms convert raw streams into maintenance tickets, creating recurring SaaS income. These factors collectively preserve scale benefits for incumbents while introducing fresh margin pools in analytics subscriptions.


By Monitoring Technique: Vibration Maintains Lead, Ultrasound Accelerates
Vibration analysis retained 33.75% share in 2025. Practitioners trust its rich fault signature library for rotating assets, and equipment makers bundle accelerometers at purchase, reinforcing network effects. Ultrasound emission is projected to expand 11.62% per year as plants value early bearing fault detection and compressed-air leak identification even in high-noise areas.
Thermography adoption rises with AI that flags thermal anomalies in cloud dashboards, aided by wearable integrations like the Teledyne FLIR and RealWear partnership. Motor current signature and oil analysis round out multi-modal suites that boost diagnostic confidence and extend reach into electrical and lubrication systems.
By Deployment: Continuous Monitoring Moves Wireless
Online systems captured 47.55% of the machine condition monitoring market size in 2025, reflecting user demand for always-available asset health reads. Plants continue to push continuous coverage onto less critical machinery but resist cabling complexity, which accelerates wireless uptake at a 12.22% CAGR. Honeywell’s Versatilis Experion EHM shows how LoRaWAN-based sensors transmit six parameter types to cloud models without control-system intrusion. NIST deployment guidance reinforces best practices in interference mitigation and cybersecurity for such architectures .
Portable instruments maintain relevance for commissioning and deep dives, forming a hybrid toolkit that balances cost and coverage. Edge processing embedded in sensor nodes now supports millisecond-scale anomaly identification before forwarding compressed insights upstream.
By End-user Industry: Oil & Gas Dominates, Food & Beverage Gains Pace
Oil and gas operations delivered 27.05% of 2025 demand because unplanned stoppages in midstream and upstream lines can cost millions per incident. Platforms derived from turbine health monitoring by Bentley Nevada underpin many deployments in this sector. Regulatory focus on methane emissions further drives real-time monitoring adoption for compressors and pumps.
Food and beverage manufacturers are forecast to grow at 10.39% CAGR, propelled by hygiene rules and rising sustainability goals. Celli Group cut equipment failures by 13% after deploying IoT sensors on beverage dispensers, showing measurable ROI. Similar drivers appear in dairy, bakery, and packaged foods where downtime erodes freshness windows.
Power, metals, mining, and chemicals continue to demand ruggedized solutions, while defense and aerospace remain specialized niches that reward high-reliability vendors who meet MIL-STD or rad-hard requirements.
Geography Analysis
North America held 32.10% of 2025 revenue, sustained by stringent safety codes and early Industry 4.0 rollouts. SEC emissions reporting and California SB 253 guide firms toward continuous efficiency measurement . Mature installed bases further encourage upgrade cycles to edge-capable sensors.
Asia-Pacific is poised for 9.78% annual growth. Smart-manufacturing subsidies in China and India defray upfront costs, while Japan’s sensor innovation hub showcases domain expertise at IEEE SENSORS 2024 . Rapid expansion of battery, semiconductor, and renewable-equipment factories embeds predictive maintenance from conception.
Europe leverages ESG frameworks to justify investment, and the Middle East aligns monitoring with oil and gas mega-projects. Latin America records emerging growth as miners digitalize conveyor fleets and hydro plants seek reliability uplift.


Competitive Landscape
The field remains moderately fragmented. Established automation majors such as SKF, Emerson Electric, and Siemens exploit their large aftermarket footprints and multiproduct bundles. Software-native entrants emphasize AI models and subscription pricing that lower entry barriers for mid-tier plants. ABB’s machine-listening collaboration with Cochl exemplifies partnership plays that accelerate algorithm refinement.
Acquisition strategy remains central. Rockwell Automation expanded its digital service line with Fiix, CUBIC, and Knowledge Lens, positioning for cross-sell into its Logix controller base. Honeywell’s AI rollouts, including Experion Operations Assistant, align with an adjacent-market penetration tactic that links process control with asset performance . White-space opportunities lie in low-cost wireless nodes for auxiliary assets, verticalized analytics for food processing, and cybersecurity-hardened solutions for space platforms.
Machine Condition Monitoring Industry Leaders
-
SKF AB
-
Emerson Electric Co. (Bently Nevada)
-
Rockwell Automation Inc.
-
ABB Ltd.
-
Siemens AG
- *Disclaimer: Major Players sorted in no particular order

Recent Industry Developments
- March 2025: Baker Hughes posted USD 27.8 billion 2024 revenue, funneled USD 643 million into R&D, and expanded its Industrial & Energy Technology line to accelerate low-carbon solutions.
- February 2025: Rockwell Automation’s Q1 2025 orders grew 10% year over year while Annual Recurring Revenue climbed 11%, underlining traction in outcome-based subscriptions.
- October 2024: Siemens released the SIMOCODE M-CP motor management system with built-in monitoring and Single Pair Ethernet connectivity, targeting chemicals and mining switchboards.
- October 2024: Honeywell unveiled Experion Operations Assistant, an explainable-AI tool that guides operators through complex process events while partnering with Chevron on refining analytics.


Research Methodology Framework and Report Scope
Market Definitions and Key Coverage
Our study defines the machine condition monitoring market as every hardware, software, and related service package that collects, transmits, and interprets vibration, thermal, acoustic, and lubricant-quality signals to flag incipient faults in industrial assets. According to Mordor Intelligence, the remit embraces online systems, portable instruments, and wireless IIoT sensor networks operating across oil and gas, power generation, metals and mining, chemicals, automotive, aerospace, food and beverage, marine, and adjacent verticals worldwide.
Exclusion: pure-play predictive maintenance software that functions without machine-level sensing hardware is kept outside scope.
Segmentation Overview
-
By Offering
- Hardware
- Software
- Services
-
By Monitoring Technique
- Vibration Analysis
- Thermography
- Ultrasound Emission
- Lubricating-Oil Analysis
- Motor-Current Signature
- Corrosion & Wear Debris
- Other Techniques
-
By Deployment
- Online/Continuous Systems
- Portable/Periodic Instruments
- Wireless IIoT Sensor Networks
-
By End-user Industry
- Oil & Gas
- Power Generation
- Metals & Mining
- Chemicals & Petrochemicals
- Automotive & Transportation
- Aerospace & Defense
- Food & Beverage
- Marine
- Other Industries
-
By Geography
-
North America
- United States
- Canada
-
South America
- Brazil
- Argentina
-
Europe
- Germany
- United Kingdom
- France
- Russia
-
Asia
- China
- Japan
- India
- South Korea
-
Middle East & Africa
-
Middle East
- Saudi Arabia
- UAE
-
Africa
- South Africa
-
Middle East
-
North America
Detailed Research Methodology and Data Validation
Primary Research
To ground the desk findings, we interview plant maintenance heads, vibration analysts, sensor OEM product managers, and predictive maintenance integrators across North America, Europe, and Asia. These conversations clarify failure mode prevalence, adoption barriers, typical ASP movements, and realistic retrofit rates, letting us fine-tune model assumptions.
Desk Research
Mordor analysts first map the universe through open statistics from bodies such as the U.S. Energy Information Administration, Eurostat Industrial Production files, and the International Organization for Standardization's asset management standards. Trade associations like the Society for Maintenance and Reliability Professionals, patent filings accessed via Questel, and asset failure studies in peer-reviewed journals enrich the problem statement.
Company 10-Ks, investor decks, customs shipment data, and news feeds pulled via D&B Hoovers and Dow Jones Factiva then help us anchor supplier footprints, sensor average selling prices (ASPs), and regional retrofit cycles. The sources cited here are illustrative; many additional records supported data gathering, validation, and clarification.
Market-Sizing and Forecasting
A top-down rebuild starts with the installed base of critical rotating equipment by industry; production and trade data reconstruct that pool, which is then multiplied by observed monitoring system penetration rates. Selective bottom-up checks, supplier revenue roll-ups, and sampled ASP times volume math validate and adjust totals. Key variables feeding the model include sensor ASP drift, industrial production growth, maintenance intensity ratios, IIoT adoption share, and unplanned downtime cost curves. Multivariate regression links those drivers to historic uptake, while scenario analysis frames optimistic and conservative adoption paths. Data gaps in bottom-up samples are bridged using moving average imputations reviewed with subject experts.
Data Validation and Update Cycle
Outputs undergo anomaly checks against independent metrics such as vibration sensor export volumes and OEM order books. Senior analysts review variances before sign-off. Reports refresh yearly, and material events, large regulations and major recalls, trigger interim updates. A fresh pass immediately precedes client delivery to ensure currency.
Why Mordor's Machine Condition Monitoring Baseline Earns Trust
Published market estimates often diverge because firms pick different product mixes, price points, and refresh cadences. Our disciplined scope, industry-specific variables, and annual update rhythm reduce that spread and give decision makers a dependable stake in the ground.
Key gap drivers include other publishers bundling broader predictive maintenance platforms, treating wireless sensor ASPs uniformly across currencies, or relying on narrow OEM panels without end user spend corroboration, whereas Mordor triangulates all three angles.
Benchmark comparison
| Market Size | Anonymized source | Primary gap driver |
|---|---|---|
| USD 1.37 billion (2025) | Mordor Intelligence | |
| USD 3.50 billion (2024) | Global Consultancy A | Broader inclusion of predictive platforms and structural health systems inflates base year |
| USD 3.10 billion (2024) | Global Consultancy B | Uniform ASP assumption and no currency re-baselining |
| USD 2.78 billion (2024) | Industry Association C | Shipment data from limited OEM panel; lacks end user spend cross-check |
Taken together, the comparison shows that Mordor's numbers sit on a transparent chain of variables, cross-verified sources, and repeatable steps, offering buyers a balanced and traceable baseline for strategic planning.


Key Questions Answered in the Report
How big is the Machine Condition Monitoring Market?
The Machine Condition Monitoring Market size is expected to reach USD 1.53 billion in 2026 and grow at a CAGR of 9.47% to reach USD 2.41 billion by 2031.
What is the current value of the machine condition monitoring market?
The machine condition monitoring market is valued at USD 1.53 billion in 2026.
How fast is the market expected to grow?
It is forecast to register a 9.47% CAGR, reaching USD 2.41 billion by 2031.
Which region holds the largest revenue share?
North America leads with 32.10% of 2025 revenue.
Which deployment model is gaining the most traction?
Wireless IIoT sensor networks show the strongest growth with a 12.22% CAGR.
Why is vibration analysis still dominant?
Decades of proven methodologies and extensive fault libraries keep vibration analysis at 33.75% market share in 2025, especially for rotating equipment monitoring.
Page last updated on:


