
Condition Monitoring Equipment Market Size and Share
Market Overview
| Study Period | 2020 - 2031 |
|---|---|
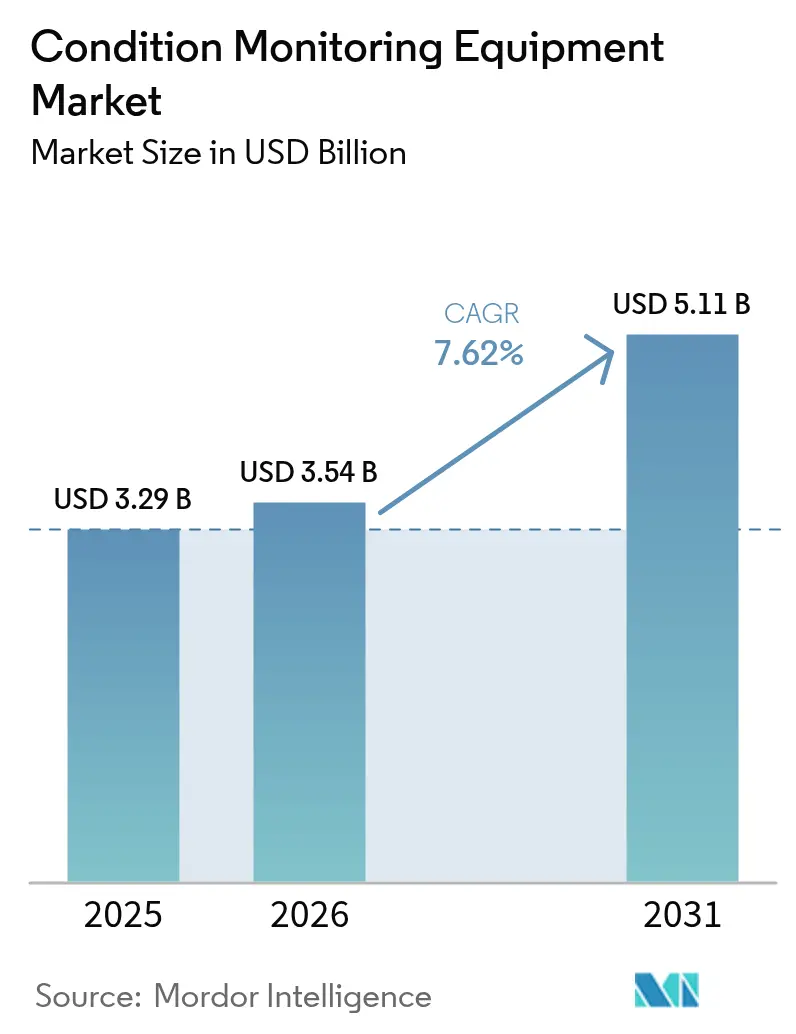
| Market Size (2026) | USD 3.54 Billion |
| Market Size (2031) | USD 5.11 Billion |
| Growth Rate (2026 - 2031) | 7.62 % |
| Fastest Growing Market | Middle East |
| Largest Market | North America |
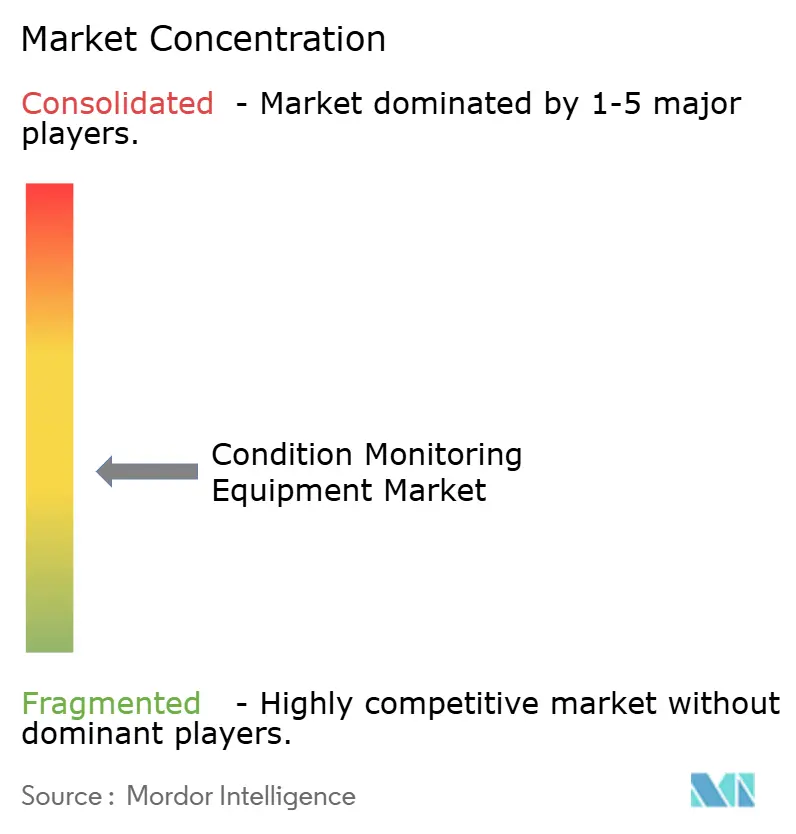
| Market Concentration | Medium |
Major Players *Disclaimer: Major Players sorted in no particular order Image © Mordor Intelligence. Reuse requires attribution under CC BY 4.0. | |
Condition Monitoring Equipment Market Analysis by Mordor Intelligence
The condition monitoring equipment market size was valued at USD 3.29 billion in 2025 and estimated to grow from USD 3.54 billion in 2026 to reach USD 5.11 billion by 2031, at a CAGR of 7.62% during the forecast period (2026-2031). Demand accelerates as factories transition from time-based to predictive maintenance, leveraging artificial intelligence, Internet of Things sensors, and cloud analytics for real-time insights into asset health. Hardware continues to anchor the condition monitoring equipment market because vibration probes, thermal imagers, and oil analysis tools remain essential in most industrial plants. Service-centric business models, however, are scaling faster as manufacturers shift capital outlays to operating budgets and outsource diagnostic expertise to specialist providers. Uptake is strongest in oil and gas facilities, power generation fleets, and renewable energy assets where downtime costs are high. Regional growth patterns favor North America’s advanced automation base today, while the Middle East and Asia-Pacific add new capacity and retrofit legacy infrastructure.
Key Report Takeaways
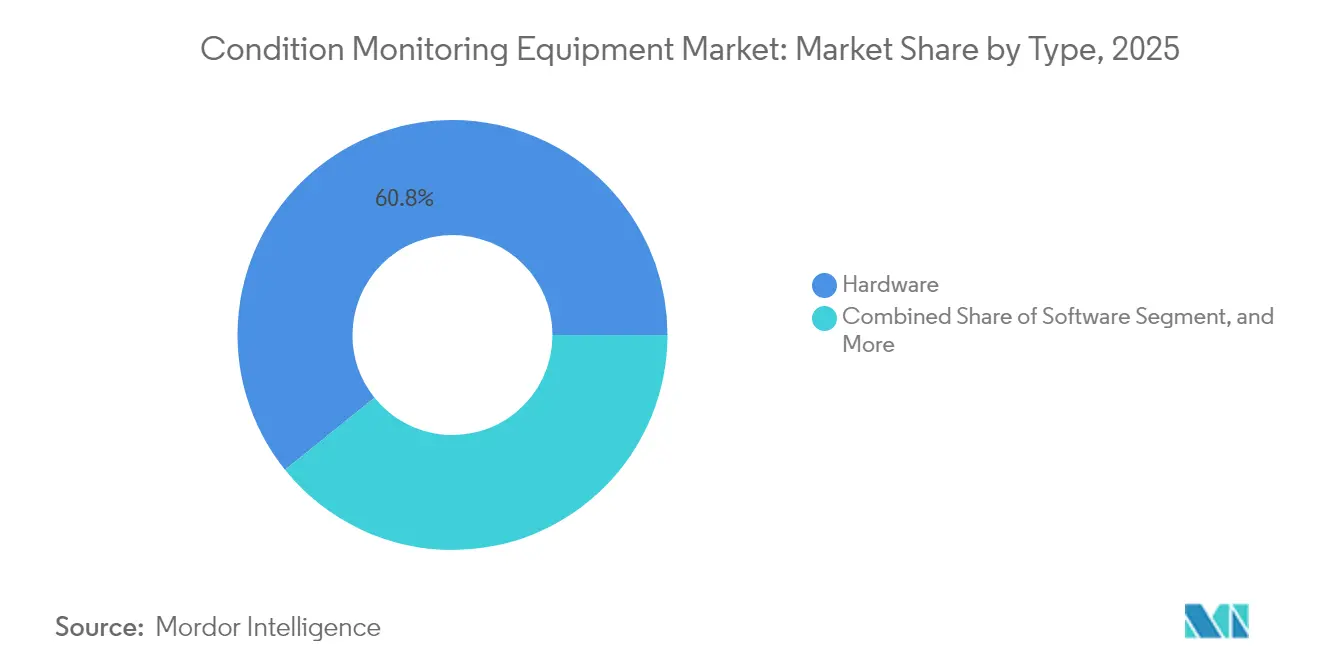
- By type, hardware led with a 60.78% market share of the condition monitoring equipment market in 2025; services are projected to expand at a 8.99% CAGR through 2031.
- By end-user vertical, the oil and gas sector held a 25.21% share of the condition monitoring equipment market size in 2025, while the power generation sector n is advancing at an 8.05% CAGR through 2031.
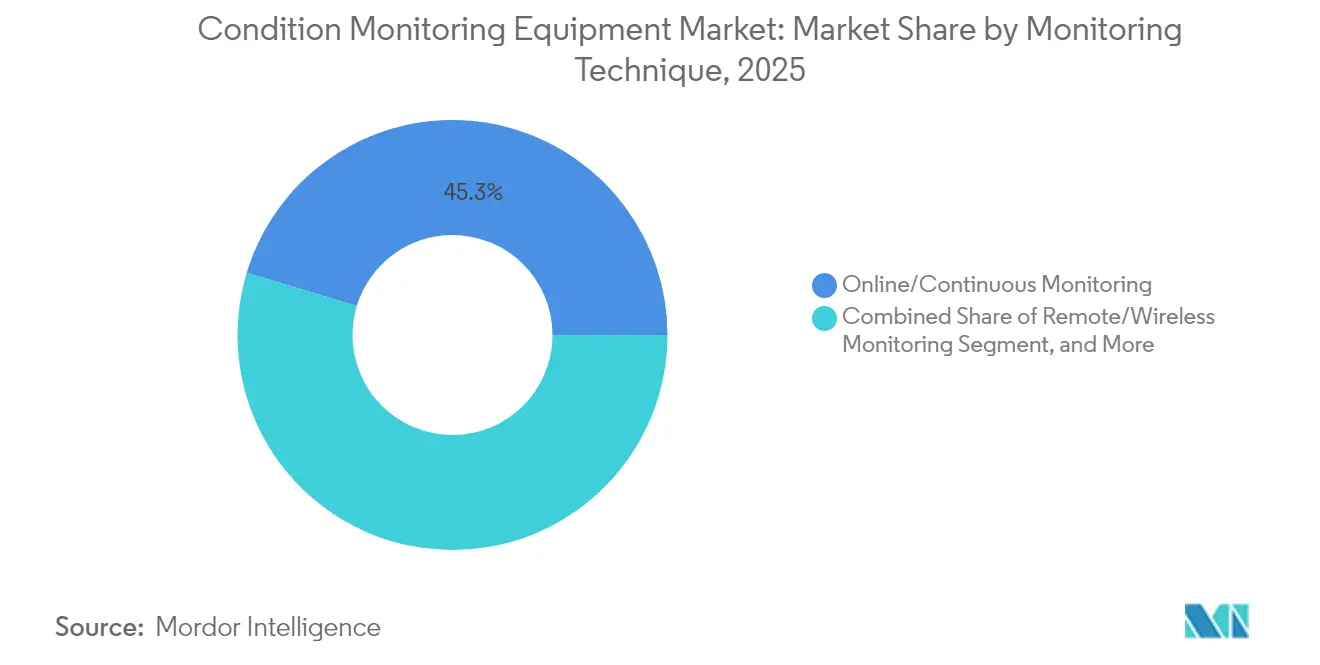
- By monitoring technique, online continuous monitoring accounted for a 45.32% share of the condition monitoring equipment market size in 2025, and remote wireless monitoring is projected to record the highest CAGR of 9.11% from 2026 to 2031.
- By deployment mode, on-premise installations commanded 68.57% share of the condition monitoring equipment market size in 2025; cloud-based solutions are forecast to expand at a 9.33% CAGR between 2026 and 2031.
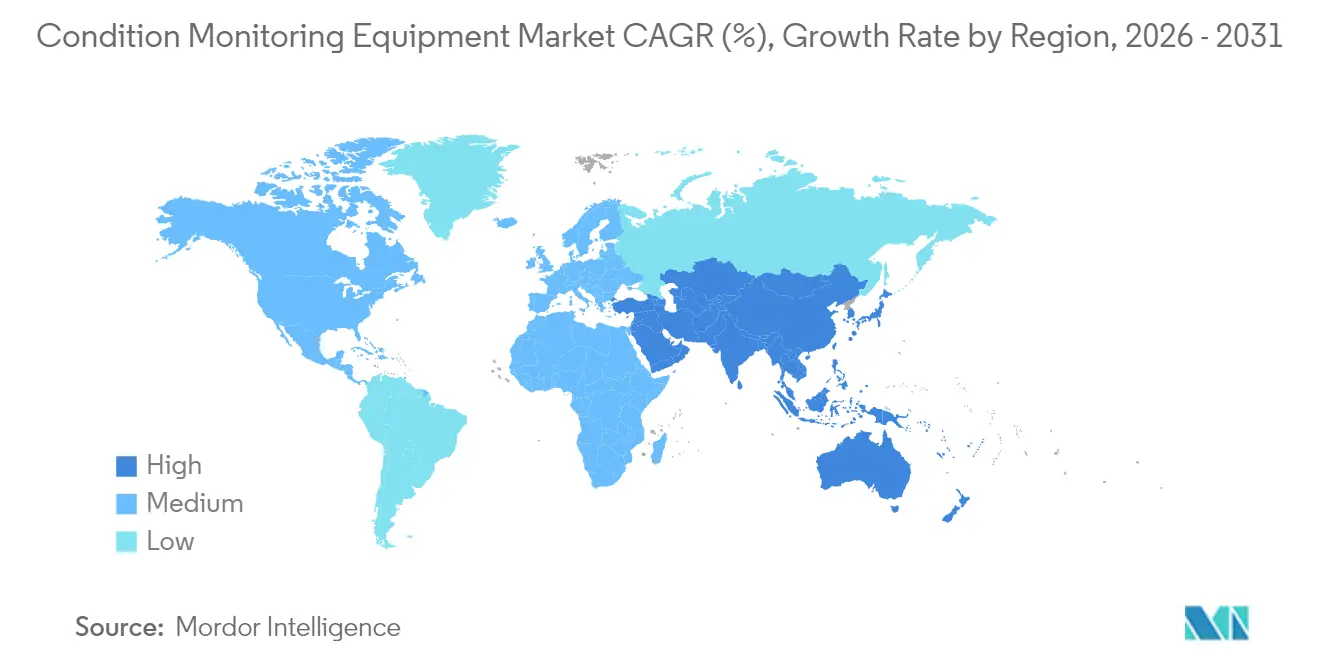
- By geography, North America led with a 33.21% revenue share in 2025, while the Middle East is forecast to witness the fastest growth, with a 7.88% CAGR through 2031.
Note: Market size and forecast figures in this report are generated using Mordor Intelligence’s proprietary estimation framework, updated with the latest available data and insights as of 2026.
Market Trends and Insights
Drivers Impact Analysis of Condition Monitoring Equipment Market*
| Driver | (~) % Impact on CAGR Forecast | Geographic Relevance | Impact Timeline |
|---|---|---|---|
| Rise in Demand for Smart Factories | +1.8% | Global, concentrated in North America and Europe | Medium term (2-4 years) |
| Growing Emphasis on Predictive Maintenance Programs | +2.1% | Global, led by Asia-Pacific manufacturing hubs | Short term (≤ 2 years) |
| Increasing Focus on Renewable Energy Asset Reliability | +1.4% | Europe, North America, emerging markets | Long term (≥ 4 years) |
| Integration of IIoT and Cloud Analytics in Condition Monitoring | +1.9% | Global, early adoption in developed markets | Medium term (2-4 years) |
| Miniaturisation of Wireless Sensor Nodes | +0.8% | Global, manufacturing in Asia-Pacific | Long term (≥ 4 years) |
| Shift Toward Servitisation Business Models | +1.2% | North America and Europe, expanding in Asia-Pacific | Medium term (2-4 years) |
| Source: Mordor Intelligence | |||
Rise in Demand for Smart Factories
Manufacturers building smart factories integrate asset health data with production metrics to drive holistic optimization. Condition monitoring platforms must interface with manufacturing execution and enterprise resource planning systems, so vendors emphasize open protocols and interoperable architectures.[1]Institute of Electrical and Electronics Engineers, “IEEE Standards Association,” ieee.org Edge computing enables immediate anomaly detection on the shop floor, reducing cloud bandwidth costs and response times. Operators use intuitive dashboards that translate vibration and thermal patterns into actionable tasks, and reported downtime reductions range from 15% to 25% when such systems are fully deployed. As enterprises link reliability outcomes to overall equipment effectiveness targets, demand rises for solutions scalable across multi-plant networks. The heightened focus on smart operations thus feeds long-term growth for the condition monitoring equipment market.
Growing Emphasis on Predictive Maintenance Programs
Corporate maintenance policies now prioritize data-driven interventions instead of rigid preventive schedules. Predictive maintenance often yields triple-digit returns on investment because failures are detected before secondary damage occurs, thereby reducing emergency repair costs and lost production hours. Machine-learning models synthesize vibration, temperature, and lubricant data into a single asset health score that maintenance planners trust for scheduling. Centralized cloud dashboards enable teams to oversee distributed plants from command centers, while shared databases of failure modes continually refine diagnostic accuracy. The positive economics and operational clarity continue to draw new adopters into the condition monitoring equipment market.
Increasing Focus on Renewable Energy Asset Reliability
Wind turbines, solar trackers, and battery storage systems operate in remote or harsh environments where manual inspections are costly. Offshore wind farms rely on continuous vibration and oil analysis to avoid catastrophic gearbox failures and reduce vessel dispatches.[2]International Renewable Energy Agency, “Renewable Energy Statistics 2024,” irena.org Monitoring kits must withstand salt spray, temperature fluctuations, and electromagnetic interference, driving the development of specialized sensors. Renewable project owners combine meteorological data with condition metrics to model stress loads, schedule maintenance windows around weather conditions, and ensure power purchase agreement performance. As global renewable capacity expands, these requirements accelerate revenue opportunities for condition monitoring vendors.
Integration of IIoT and Cloud Analytics in Condition Monitoring
Industrial Internet of Things frameworks enable millions of low-power sensors to stream data into elastic cloud platforms for advanced analytics.[3]National Institute of Standards and Technology, “Cybersecurity Framework,” nist.gov Edge devices run lightweight algorithms to flag anomalies locally, sending only compressed events to the cloud for deep pattern recognition. Software updates delivered over-the-air enable systems to evolve as new failure modes emerge, transforming hardware into a continually improving service. Cybersecurity guidelines specific to operational technology ensure that asset owners are assured that connectivity risks are controlled. This fusion of IIoT, secure networks, and scalable analytics continues to expand the addressable market for condition monitoring equipment.
Restraints Impact Analysis of Condition Monitoring Equipment Market*
| Restraint | (~) % Impact on CAGR Forecast | Geographic Relevance | Impact Timeline |
|---|---|---|---|
| Unpredictable Maintenance Scheduling Windows | -0.9% | Global, intense in continuous process industries | Short term (≤ 2 years) |
| Shortage of Skilled Reliability Engineers | -1.2% | Global, acute in developed markets | Long term (≥ 4 years) |
| Cybersecurity Concerns in Connected Monitoring Systems | -1.8% | Global, heightened in critical infrastructure | Medium term (2-4 years) |
| High Capital Outlay for Advanced Monitoring Equipment | -1.4% | Emerging markets, small to medium enterprises | Medium term (2-4 years) |
| Source: Mordor Intelligence | |||
Cybersecurity Concerns in Connected Monitoring Systems
High-profile cyber incidents targeting operational technology make asset owners cautious about connecting machines to external networks. Updated 2024 NIST guidelines highlight sensor gateways and data historians as potential attack vectors. Many legacy plants lack segmented architectures, so retrofits require significant investments in firewall, intrusion detection, and identity management. Regulations governing critical infrastructure require strict compliance audits, which can lengthen project timelines. As a result, some operators favor air-gapped or on-premise deployments, tempering the near-term growth of cloud-centric solutions within the condition monitoring equipment market.
High Capital Outlay for Advanced Monitoring Equipment
Fully featured systems that combine multi-parameter sensors, rugged data collectors, and analytics software can cost USD 100,000 or more per high-value asset. Small and medium manufacturers with thin maintenance budgets struggle to justify such investments, especially when economic conditions tighten. Custom integration with existing maintenance management or enterprise asset management software can inflate total project costs and extend payback periods. Supply chain disruptions add lead-time uncertainty and price inflation, causing some buyers to defer projects. These financial hurdles hinder adoption among budget-constrained facilities, despite the proven long-term benefits.
*Our forecasts treat driver/restraint impacts as directional, not additive. The impact forecasts reflect baseline growth, mix effects, and variable interactions.
Condition Monitoring Equipment Market Segment Analysis
By Type:
Services Extend Equipment ValueThe hardware segment accounted for 60.78% of the condition monitoring equipment market in 2025. Vibration probes, thermal cameras, and oil debris sensors remain the core diagnostic tools across rotating machinery, electrical systems, and hydraulics. Vendors continually raise sensor bandwidth and temperature ratings to match harsher service environments, reinforcing hardware replacement cycles. The services segment is the fastest-growing category, progressing at a 8.99% CAGR as users outsource data interpretation and repair planning. Under outcome-based contracts, providers leverage cloud analytics to guarantee uptime targets, aligning payment with performance rather than equipment sales. This model encourages wider adoption of predictive programs without major capital outlays, expanding the total condition monitoring equipment market.
Software advances bridge the gap between hardware and services by converting raw waveforms into actionable insights. Vendors embed artificial intelligence inside edge gateways to filter noise, compress relevant events, and push prioritized alerts to maintenance teams. Stand-alone software sales have slowed because buyers prefer integrated stacks, but software remains the differentiator that turns generic sensors into high-value solutions. Condition monitoring as a service, therefore, bundles hardware, analytics, and expert review into one subscription, driving recurring revenue and deeper customer lock-in across the condition monitoring equipment industry.



By End-User Vertical:
Power Generation Scales FastOil and gas operations dominated the condition monitoring equipment market, accounting for 25.21% of the market size in 2025. Harsh drilling, refining, and liquefaction environments expose pumps, turbines, and compressors to severe wear, so vibration and thermography systems are long-standing requirements. The power generation segment, led by wind, solar, and life-extension projects for thermal plants, is forecast to grow at an 8.05% CAGR through 2031. Renewable operators depend on continuous monitoring to plan offshore service visits and avoid lost megawatt-hours during peak demand periods. Utilities also integrate asset health scores into grid dispatch models to balance cost and reliability, broadening application scope.
Process and discrete manufacturing plants adopt predictive programs to support lean inventory and just-in-time production, where uptime is paramount. Aerospace, defense, and transportation sectors seek specialized certifications and ruggedized devices, creating profitable niches for high-margin products. Meanwhile, mining, marine, and civil infrastructure markets add incremental volume by applying proven methodologies from the oil and gas sector. This diversification stabilizes demand and sustains healthy prospects for the condition monitoring equipment market.
By Monitoring Technique:
Wireless Networks Unlock New AssetsOnline continuous systems held a 45.32% share of the condition monitoring equipment market size in 2025, as critical assets such as turbines and pumps cannot be shut down for manual checks. Sensors feed data to data collectors every second, enabling immediate fault identification and preventing catastrophic failures. Remote wireless monitoring is the fastest-growing technique, expected to compound at a 9.11% annual growth rate through 2031. Low-power wireless mesh networks, coupled with 5G backhaul, transmit data from inaccessible or moving equipment, such as crane gearboxes and high-altitude conveyors. Battery life improvements and energy harvesting lower maintenance burdens for these wireless nodes.
Portable offline instruments remain valuable for troubleshooting or verifying alarms. Analysts carrying handheld vibration meters or infrared cameras can capture high-resolution snapshots, confirm findings, and teach machine-learning models. A blended strategy that mixes continuous, wireless, and portable tools yields the highest diagnostic confidence. This layered approach broadens product portfolios and strengthens vendor relationships in the condition monitoring equipment market.
By Deployment Mode:
Hybrid Architectures Gain TractionOn-premise installations represented 68.57% of market spending in 2025 because many plants keep operational data within facility firewalls for security and latency reasons. Local servers run vibration algorithms and store historical baselines for audits. Cloud-based implementations, however, are scaling at a 9.33% CAGR as organizations see value in elastic computing and cross-site benchmarking. Public, private, and hybrid clouds enable maintenance teams to compare identical machines across multiple locations, identify anomalous wear patterns, and optimize spare parts strategies.
Hybrid models are increasingly common: edge gateways perform first-level analytics on-site, then stream compressed insights to the cloud for fleet-wide dashboards. Cybersecurity frameworks now include zero-trust principles and secure tunneling to protect traffic. As confidence grows, more users migrate their historical data to the cloud to train more comprehensive predictive models. This architectural flexibility accelerates the growth of the condition monitoring equipment market without compromising data governance.
Geography Analysis
North America Condition Monitoring Equipment Market
North America led the condition monitoring equipment market, accounting for a 33.21% share in 2025. The United States relies on predictive maintenance to counter skilled-labor shortages and extend the life of aging process plants. Federal safety regulations and corporate sustainability goals further mandate the monitoring of asset integrity. Canada applies similar technologies in oil sands operations and remote hydroelectric facilities, whereas Mexico’s expanding automotive corridor demands cost-effective wireless solutions to uphold lean production targets. Together, these factors sustain strong replacement and upgrade cycles across the region.
Middle East Condition Monitoring Equipment Market
The Middle East is the fastest-growing region, projected to grow at a 7.88% CAGR through 2031. National diversification agendas aim to modernize petrochemical complexes and create advanced manufacturing hubs through large-scale programs. New smart city and transportation projects generate additional demand for continuous verification of asset health. Harsh ambient temperatures, desert dust, and corrosive atmospheres drive the need for specialized sensors, and regional service hubs are emerging to support the local interpretation of diagnostic data.
APAC Condition Monitoring Equipment Market
Asia-Pacific follows closely due to its massive industrial base. China pushes domestic innovation through industrial internet initiatives, linking condition data with supply-chain platforms to boost quality competitiveness. Japan’s mature plants undertake large-scale retrofits to keep their automotive and electronics facilities competitive, while India’s 'Make in India' initiative stimulates adoption among small and mid-sized manufacturers. Across the region, a surge in renewable power projects requires remote monitoring to protect investments in wind and solar assets. Collectively, these factors widen the scope of the condition monitoring equipment market.

Regulatory Landscape
Condition monitoring deployments are shaped by machinery safety obligations and technical standards for diagnostics and prognostics. In the European Union, Regulation (EU) 2023/1230 (Machinery Regulation) introduces requirements that are especially relevant to networked machinery and digitally controlled safety functions, and it applies from 20 January 2027. This timeline pushes asset owners and OEMs to document secure architectures and lifecycle controls when condition monitoring is connected to control systems.
On the standards side, ISO technical work covering condition monitoring and diagnostics of machine systems (ISO/TC 108/SC 5) underpins common data interpretation and analytics practices. ISO 13379-1:2025 supports data interpretation and diagnostics, while ISO 13381-1:2025 provides prognostics process guidance. In the United States, 42 USC 17115a directs the Department of Energy to develop and periodically revise a smart manufacturing plan, reinforcing federal attention to monitoring and networked production infrastructure as factories digitize maintenance and reliability programs.
Value Chain Analysis
The value chain starts with component suppliers, including sensors, MEMS, industrial radios, ruggedized gateways, and mature-node semiconductors. Device OEMs then produce vibration, thermography, and oil-debris systems, followed by software layers for edge analytics and cloud monitoring, with integration into EAM and CMMS platforms. Distribution is largely handled through direct enterprise sales and automation channels, while service partners provide installation, cybersecurity hardening, remote diagnostics, and outcome-based uptime programs that are increasingly bundled with hardware.
Recent activity points to edge gateways and cloud platforms as core intermediaries between field sensors and enterprise workflows. In June 2025, Lantronix began a multi-year rollout of edge gateways and cloud software to monitor over 50,000 backup power systems for a Tier-1 US mobile operator, reflecting scale demand in distributed assets. Creanord was selected by Eutelsat OneWeb in February 2025 for AI-powered TWAMP monitoring, and VIAVI launched its cloud-based XEdge solution in February 2025, indicating continued investment in cloud and edge monitoring stacks. Supply-side constraints remain a key friction point, with mature-node semiconductor capacity and industrial component lead times cited as tightening, pushing buyers toward risk-based inventory and multi-sourcing to protect sensor and gateway availability.
Competitive Landscape
The condition monitoring equipment market remains moderately fragmented. Global automation leaders, including Siemens, Emerson, Rockwell Automation, ABB, and Honeywell, differentiate themselves through integrated hardware, software, and cloud ecosystems. Siemens expanded its Xcelerator program in 2024, adding analytics partners that layer digital-twin physics over live sensor data, enhancing fault prediction accuracy. Rockwell Automation integrated Microsoft Azure artificial intelligence to deliver configuration-free analytics, shortening deployment time. Emerson leveraged AspenTech process models to couple condition data with advanced control logic, providing holistic asset performance management.
Consolidation is accelerating as hardware vendors acquire analytics firms to secure software intellectual property and lock customers into their ecosystems. Start-ups focusing on wireless sensors and edge AI target specific niches, such as renewable energy or mobile equipment, often partnering with larger players to gain channel access. Customers are increasingly favoring suppliers that offer outcome-based contracts with guaranteed uptime, which requires a blend of equipment, algorithms, and domain expertise. This shift raises entry barriers for pure-play sensor companies yet opens opportunities for cloud-native innovators. Overall, competition centers on demonstrating a return on investment, cybersecurity credentials, and the ability to scale across global facilities.
Condition Monitoring Equipment Industry Leaders
Rockwell Automation Inc.
Emerson Electric Co.
Meggitt PLC
General Electric Company
SKF AB
- *Disclaimer: Major Players sorted in no particular order
Condition Monitoring Equipment Market Companies Covered in this Report
- Rockwell Automation Inc.
- Emerson Electric Co.
- Meggitt PLC
- General Electric Company
- SKF AB
- Brüel and Kjær Vibro GmbH
- Teledyne FLIR LLC
- Fluke Corporation
- Nippon Avionics Co., Ltd.
- Thermo Fisher Scientific Inc.
- PerkinElmer Inc.
- Spectro Scientific Inc. (AMETEK Inc.)
- Parker Hannifin Corporation
- Gastops Ltd.
- Siemens AG
- Honeywell International Inc.
- ABB Ltd.
- Baker Hughes Company
- National Instruments Corporation
- Schaeffler AG
- PRUFTECHNIK Dieter Busch AG
- Wilcoxon Sensing Technologies (ITT Inc.)
- Connection Technology Center Inc.

Market Opportunities and Future Outlook
Wireless and edge-first architectures create room for assets that are difficult to instrument with wired online systems, including remote oil and gas sites, renewables, and widely distributed infrastructure. Hardware still anchors most deployments (60.78% share in 2025), but higher attach rates for subscriptions and remote diagnostics are making condition monitoring as a service more relevant. In this model, edge gateways filter events locally, while expert teams triage alerts.
Platform and service expansion activity reflects that direction. Emerson's May 2026 launch of the Synchros IIoT platform with WirelessHART-based wireless temperature monitoring and Schneider Electric's June 2026 expansion of EcoCare service coverage to include 3-phase UPS systems with AI-powered condition-based maintenance both extend monitoring into power and industrial use cases. Interoperability and assurance around analytics are also an active opportunity area as buyers embed condition data into wider smart factory programs. ISO guidance for diagnostics and prognostics processes (ISO 13379-1:2025 and ISO 13381-1:2025) supports repeatable workflows across plants, and government roadmapping reinforces AI adoption in manufacturing, including NIST's 2026 roadmap on AI and machine learning for smart manufacturing. Vendors that package multi-modal sensing (vibration, thermal, and lubricant/debris signals) with secure edge-to-cloud integration and clear audit trails align with tightening focus on connected machinery compliance, particularly ahead of the EU Machinery Regulation (EU) 2023/1230 applying from 20 January 2027.
Recent Industry Developments in Condition Monitoring Equipment Market
- July 2026: IMI secured a contract to supply more than 500 IMI TWTG NEON wireless vibration sensors along with SolidRed condition monitoring software to a refinery in Oman. The award underscores continued investment in wireless monitoring for high-consequence rotating equipment in refining, where avoiding unplanned downtime has direct throughput and safety implications.
- June 2026: Schneider Electric expanded its EcoCare service plan to cover 3-phase UPS systems, adding AI-powered condition-based maintenance. Extending condition monitoring into critical power infrastructure strengthens service-led recurring models and broadens monitoring use cases beyond traditional rotating machinery.
- September 2025: Siemens introduced the next-generation Simatic Edge AI platform for condition monitoring to analyze vibration and thermal data on site. Edge processing supports faster response and reduces dependence on cloud connectivity, aligning with buyer requirements for latency control and cybersecurity in automotive and process plants.


Condition Monitoring Equipment Market Report Scope and Research Methodology
Market Definition and Coverage
This market covers revenue generated from equipment used to track machine health and detect abnormal behavior before failure, typically through vibration, temperature, oil, ultrasound, or similar measurements, plus the related software and support tied to those deployments.
Scope exclusions: Third-party condition monitoring service provider revenue is excluded, and embedded software bundled inside hardware is counted under hardware rather than as standalone software.
Segments Covered in This Report
- By Type
- Hardware
- Vibration Monitoring Equipment
- Thermography Equipment
- Lubricating Oil Analysis Equipment
- Software
- Services
- Hardware
- By End-User vertical
- Oil and Gas
- Power Generation
- Process and Manufacturing
- Aerospace and Defence
- Automotive and Transportation
- Other End-user Verticals
- By Monitoring Technique
- Portable/Offline Monitoring
- Online/Continuous Monitoring
- Remote/Wireless Monitoring
- By Deployment Mode
- On-Premise
- Cloud-Based
- By Geography
- North America
- United States
- Canada
- Mexico
- Europe
- Germany
- United Kingdom
- France
- Russia
- Rest of Europe
- Asia-Pacific
- China
- Japan
- India
- South Korea
- Australia
- Rest of Asia-Pacific
- Middle East and Africa
- Middle East
- Saudi Arabia
- United Arab Emirates
- Rest of Middle East
- Africa
- South Africa
- Egypt
- Rest of Africa
- Middle East
- South America
- Brazil
- Argentina
- Rest of South America
- North America
Data Sources, Market Sizing, and Validation
Desk Research
Desk work starts by mapping where condition monitoring equipment demand is coming from, mainly from industrial maintenance spending and asset reliability programs. We review public sources such as US Energy Information Administration statistics, US Bureau of Labor Statistics industrial output series, Eurostat manufacturing indicators, International Energy Agency energy and power generation data, and trade data from UN Comtrade to track end market activity and cross-border equipment flows.
On top of this, we read annual reports, investor decks, and product catalogs to capture how offerings are packaged across hardware, software, and services. Patent databases are also used to sense where sensing methods and wireless monitoring are moving, and then news and financial intelligence subscriptions help track launches, pricing narratives, and regional expansion signals. These desk research inputs are not exhaustive, and many other public and paid sources were also consulted to collect, validate, and clarify the data used in the model.
Primary Interviews and Surveys
Primary work is used to test what desk indicators cannot fully show, including the typical deployment mix between online and portable monitoring, how often systems are upgraded, and what pricing changes look like by sensor type and software packaging. We speak with a mix of equipment suppliers, system integrators, and end users across manufacturing, oil and gas, power generation, and process industries, and the conversations are spread across major industrial regions so assumptions can be corrected before totals are finalized.
Distribution of primary research fieldwork respondents
| Company type | Respondent position | Region |
|---|---|---|
| Top tier: 36% | CXOs: 14% | APAC: 44% |
| Mid tier: 47% | Functional/Unit leaders: 29% | EMEA: 31% |
| Smaller Players: 17% | Managers: 57% | Americas: 25% |
Market-Sizing & Forecasting
Sizing is built using a top-down approach where industrial asset bases and maintenance activity signals are translated into an addressable demand pool for monitoring equipment, then allocated by technique and deployment preference. To keep the totals realistic, the outputs are cross-checked with selective bottom-up approximations, such as sampled average selling prices multiplied by likely unit volumes for common sensor and analyzer categories, followed by channel checks on service attachment rates.
Key inputs that shape the model include installed base intensity in asset heavy industries, adoption of predictive maintenance programs, mix shift between portable and online monitoring, cloud versus on-premise deployment preference, and typical refresh cycles for sensors and data acquisition hardware. Forecasting uses scenario analysis guided by expert views on capex cycles, reliability budgets, and how fast wireless and remote monitoring adoption is moving, and then a smoothing step is applied so year-to-year growth stays aligned with real purchasing behavior. Where direct volume evidence is thin for smaller geographies, assumptions are anchored to comparable end market activity and then corrected through primary feedback.
Data Validation & Update Cycle
Validation is done by triangulating the modeled totals against independent signals such as industrial output direction, energy and process capacity movement, and visible shifts in maintenance strategies discussed by practitioners. If a segment grows too fast or too slow versus these signals, the driver assumptions are revisited and the relevant respondents are re-contacted to confirm whether the change is real or timing related.
Before sign-off, the model goes through multi-step analyst reviews, where inputs, conversions, and scope treatment are checked for internal consistency. Reports are refreshed annually, and interim updates are made when material events occur, such as large policy shifts, major supply constraints, or rapid changes in deployment preference. Right before delivery, a final review pass is completed so clients receive the latest updated view.
Mordor Intelligence's Condition Monitoring Equipment Market Estimate Compared With Other Published Estimates
Published market values for condition monitoring equipment do not always match because each publisher draws the line differently on what counts as equipment revenue, and they also use different time windows and growth assumptions. Differences show up quickly when software is bundled with hardware, or when services are treated as a separate market rather than as part of the equipment buying decision.
The main gap comes from whether third-party monitoring services and bundled software are counted inside the market. Mordor Intelligence excludes third-party service provider revenue and counts embedded software under hardware, which can move the total compared with studies that group all monitoring services together. Other gaps often come from base year choice, how online versus portable systems are weighted by industry, and how currency conversion timing is handled for regions with more volatility.
Benchmark comparison
| Source | Market Size | Gaps in Research Methodology |
|---|---|---|
| Mordor Intelligence | USD 3.54 B (2026) | |
| Industry Publisher A | USD 2.50 B (2024) | Uses an earlier base year and a longer forecast window, and the scope description centers on predictive maintenance broadly, which can lead to different inclusion of software and service revenue tied to monitoring programs. |
| Industry Publisher B | USD 4.96 B (2025) | Appears to include a wider basket across components and services, and the higher starting value can reflect bundling of service-heavy monitoring offerings and broader component definitions beyond equipment-only accounting. |
The spread in the table is largely explained by scope handling and timing, rather than a single disputed demand signal. When equipment-only revenue is separated from third-party services, and hardware-software bundling is treated consistently, the final number becomes easier to trace back to clear adoption and refresh variables that can be rechecked over time.


Key Questions Answered in the Report
What is the projected value of the condition monitoring equipment market in 2031?
The market is forecast to reach USD 5.11 billion by 2031 at a 7.62% CAGR.
Which segment grows fastest within condition monitoring deployments?
The services segment is expected to expand at a 8.99% CAGR because manufacturers prefer outcome-based maintenance contracts.
Why are wireless monitoring techniques gaining traction?
Advances in low-power sensors, mesh networking, and 5G connectivity enable reliable data collection from hard-to-access assets, driving a 9.11% CAGR for remote wireless systems.
Which region shows the highest growth rate through 2031?
The Middle East leads with a 7.88% CAGR, fueled by petrochemical expansions and smart city programs under Saudi Vision 2030.
How do cloud platforms enhance predictive maintenance?
Cloud analytics provide scalable processing power and fleetwide benchmarking, allowing maintenance teams to compare identical machines across sites and refine diagnostic models quickly.
What restrains smaller firms from adopting advanced systems?
High upfront costs, often surpassing USD 100,000 per critical asset, limit adoption among small and medium manufacturers despite long-term savings.
Page last updated on:





