Infrastructure Monitoring Market Size and Share
Market Overview
| Study Period | 2021 - 2031 |
|---|---|
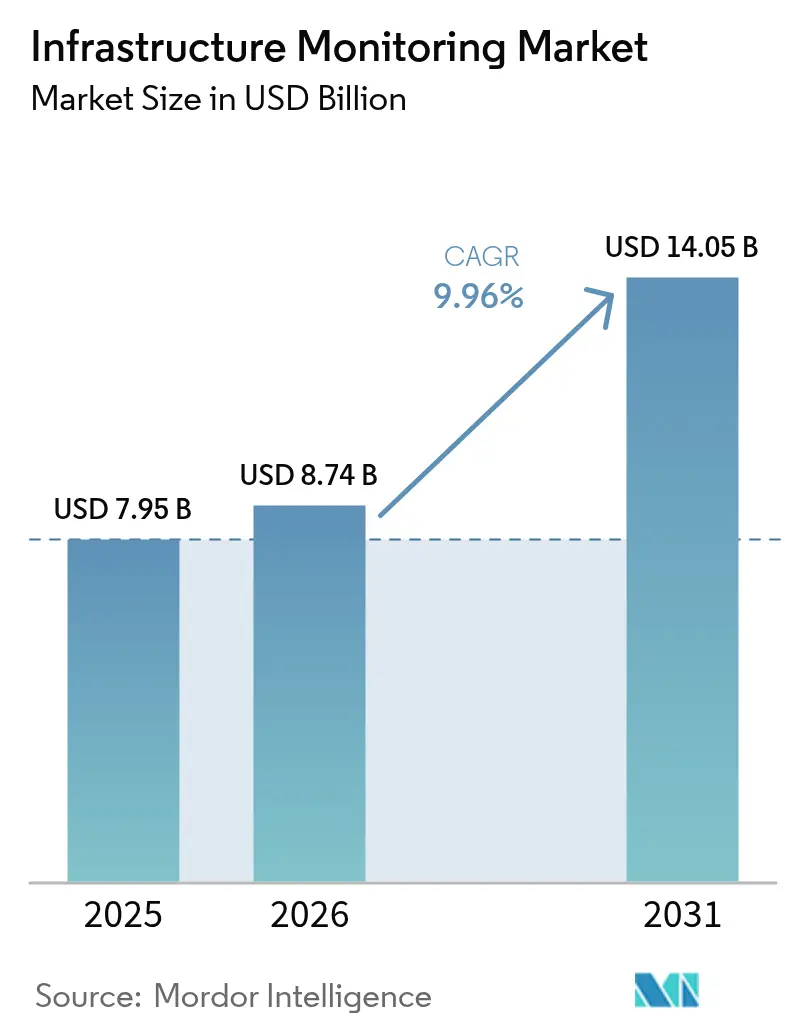
| Market Size (2026) | USD 8.74 Billion |
| Market Size (2031) | USD 14.05 Billion |
| Growth Rate (2026 - 2031) | 9.96% CAGR |
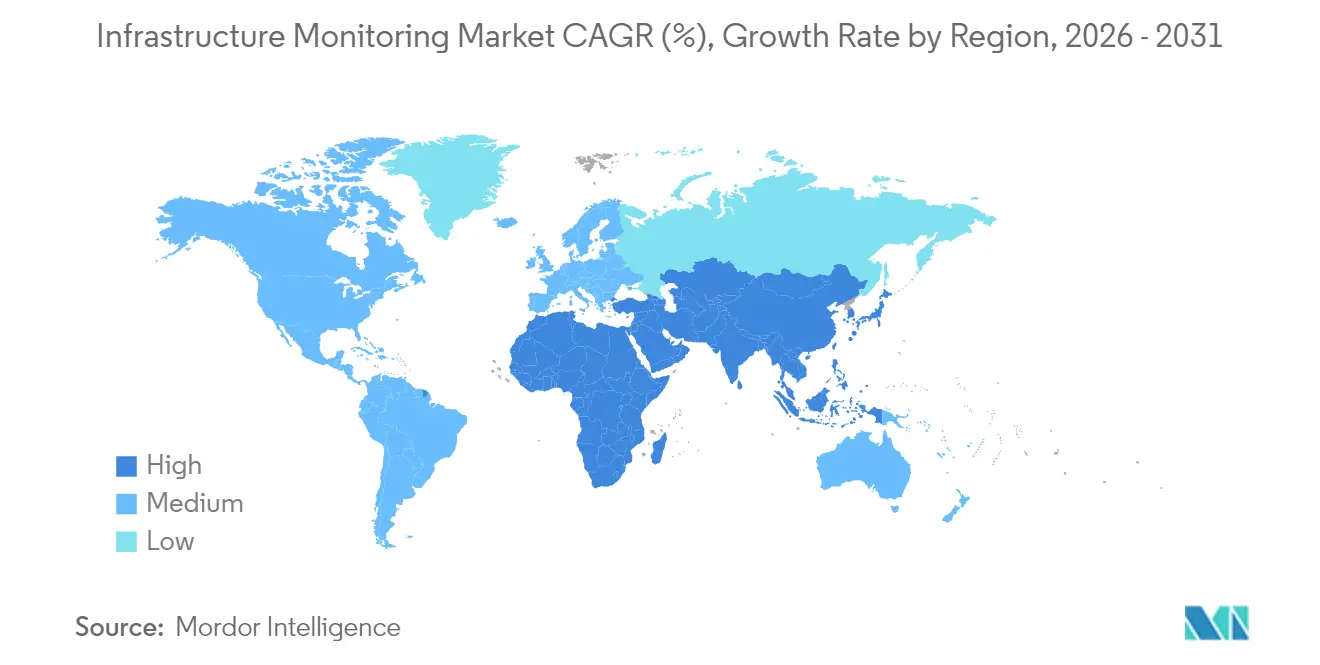
| Fastest Growing Market | Asia Pacific |
| Largest Market | North America |
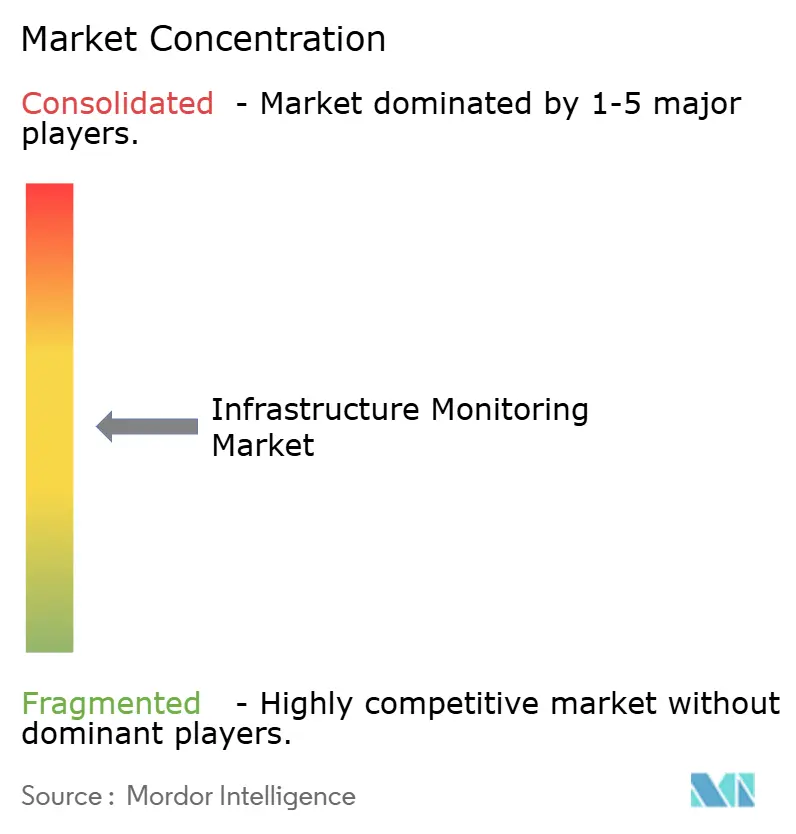
| Market Concentration | Medium |
Major Players
*Disclaimer: Major Players sorted in no particular order Image © Mordor Intelligence. Reuse requires attribution under CC BY 4.0. |
|
Infrastructure Monitoring Market Analysis by Mordor Intelligence
Infrastructure monitoring market size in 2026 is estimated at USD 8.74 billion, growing from 2025 value of USD 7.95 billion with 2031 projections showing USD 14.05 billion, growing at 9.96% CAGR over 2026-2031. Robust momentum reflects escalating deployments of wireless sensor networks, falling micro-electromechanical (MEMS) sensor prices, and rising demand for predictive maintenance across aging civil assets. Integration of IoT, AI, and cloud platforms continues to reduce lifecycle costs, allowing asset owners to shift from schedule-based to condition-based maintenance. Public-sector stimulus in North America, Japan, and the EU is accelerating digital-twin roll-outs, while smart-city programs in APAC are driving real-time structural health monitoring (SHM). Competitive intensity is heightening as incumbents pivot toward end-to-end platforms and niche specialists pursue modular offerings that resolve interoperability gaps between wired and wireless systems. Market opportunities are strongest where environmental and seismic hazards intersect with aging infrastructure, creating urgent demand for multi-hazard monitoring solutions that combine structural, geotechnical, and climate data streams.
Key Report Takeaways
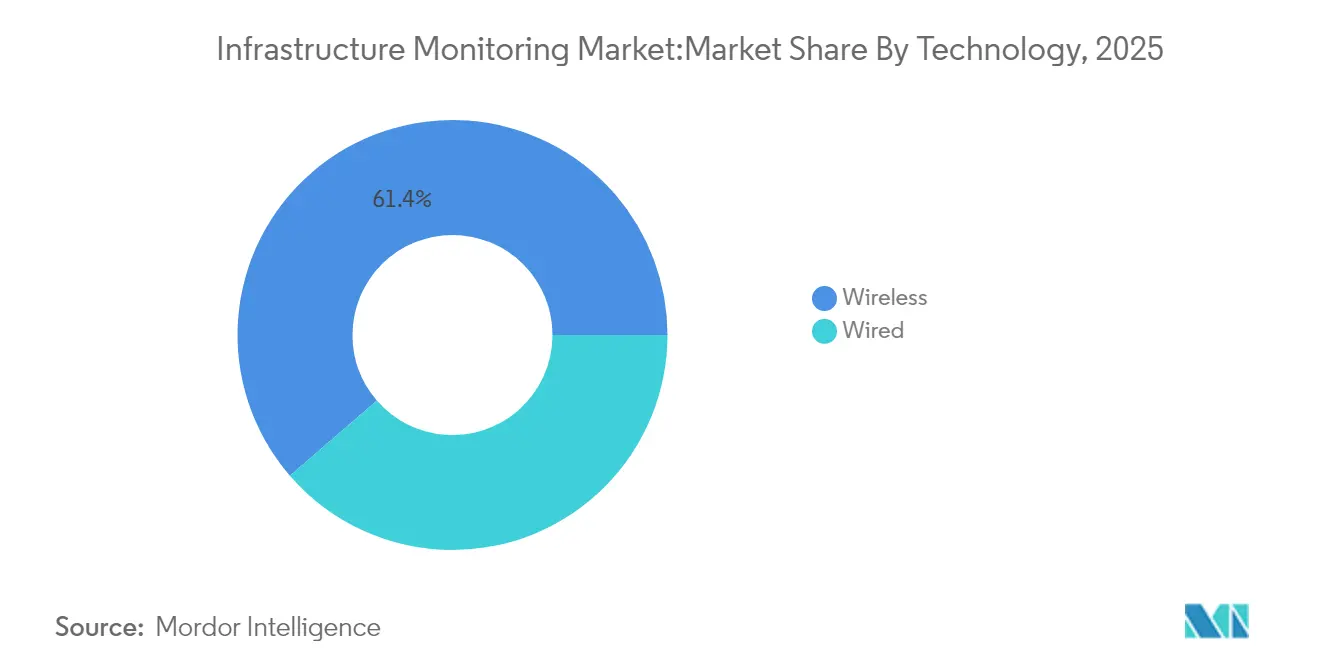
- By technology, wireless systems commanded 61.35% of the infrastructure monitoring market share in 2025; they are advancing at an 11.45% CAGR through 2031.
- By application, environmental and seismic monitoring is forecast to expand at a 12.18% CAGR, the fastest among all use cases.
- By end-user industry, civil infrastructure held 46.55% revenue share in 2025, while energy & utilities is projected to register a 11.88% CAGR to 2031.
- By deployment model, cloud/edge solutions represent the fastest trajectory with a 13.05% CAGR, even though on-premise retains a 67.10% share.
- By geography, North America led with 29.40% of the infrastructure monitoring market in 2025; Asia-Pacific shows the strongest growth outlook at 11.86% CAGR.
Note: Market size and forecast figures in this report are generated using Mordor Intelligence’s proprietary estimation framework, updated with the latest available data and insights as of 2026.
Global Infrastructure Monitoring Market Trends and Insights
Drivers Impact Analysis*
| Driver | (~) % Impact on CAGR Forecast | Geographic Relevance | Impact Timeline |
|---|---|---|---|
| Accelerating deployment of wireless sensor networks in aging bridges | +2.4% | North America & Europe | Medium term (2-4 years) |
| Smart-city megaprojects fuel real-time SHM demand | +2.1% | Asia-Pacific | Long term (≥ 4 years) |
| EU & Japan predictive-maintenance mandates for dams/tunnels | +1.8% | European Union & Japan | Medium term (2-4 years) |
| US IIJA-funded digital-twin roll-outs | +1.5% | United States | Short term (≤ 2 years) |
| Cloud-first monitoring adoption by GCC EPC majors | +1.2% | Middle East (GCC) | Medium term (2-4 years) |
| Falling MEMS sensor cost enabling secondary-road instrumentation | +1.7% | Global | Medium term (2-4 years) |
| Source: Mordor Intelligence | |||
Accelerating Deployment of Wireless Sensor Networks in Aging Bridges (NA & EU)
Aging bridges—45% are more than 50 years old—are prompting asset owners to install wireless nodes that stream strain and vibration data continuously. Linear wireless sensor network designs have cut power consumption and eased installation on long-span structures, evidenced by the 64-node Golden Gate Bridge deployment collecting 1 kHz data without traffic disruption. Project timelines are shortening because cloud-based dashboards allow engineers to validate sensor performance remotely, minimizing field revisits and scaffolding costs.[1]Lynch, J. P., and others, "Health Monitoring of Civil Infrastructures Using Wireless Sensor Networks." ACM Digital Library, dl.acm.org
Smart-City Megaprojects Fuel Real-Time SHM Demand
UN-Habitat forecasts APAC’s urban population to reach 3.5 billion by 2050, pushing municipal authorities to embed SHM into transit corridors, tunnels, and public buildings.[2]UN-Habitat, "World Smart Cities Outlook 2024", unhabitat.org ASEAN’s 108 active smart-city programs are standardizing data exchanges for structural sensors, while 5G federated edge platforms in Macau and Hong Kong stream gigabyte-scale dynamic-load data in under 50 milliseconds. Procurement frameworks now require open APIs, encouraging start-ups to license micro-services for crack detection, corrosion mapping, and anomaly triage.
EU & Japan Predictive-Maintenance Mandates for Dams/Tunnels
Society 5.0 policies in Japan and new EU dam-safety directives compel operators to shift from interval inspections to predictive analytics.[3]Kuczyńska, Agnieszka, "Analysis of Opportunities for EU SMEs in Japan's Data Economy and Artificial Intelligence in Connection with Robotics" EU-Japan Centre, eu-japan.euLive hydrological, vibration, and seepage metrics feed digital twins that simulate breach scenarios, letting owners prioritize reinforcement budgets. Joint research with universities is further de-risking procurement, as reference architectures for data integration become publicly available.
US IIJA-Funded Digital-Twin Roll-outs
IIJA appropriations earmark USD 60 billion for digital technologies. State departments of transportation are bundling lidar, BIM, and sensor data into unified twins that forecast load paths and fatigue life in real time. Early adopters report double-digit reductions in maintenance work orders and extend inspection intervals, freeing capex for resilience upgrades.
Restraints Impact Analysis*
| Restraint | (~) % Impact on CAGR Forecast | Geographic Relevance | Impact Timeline |
|---|---|---|---|
| High capex for remote-area wireless links | −1.3% | Africa, South America, rural Asia | Medium term (2-4 years) |
| Data-governance & cybersecurity barriers in EU public assets | −0.9% | European Union | Short term (≤ 2 years) |
| Shortage of structural-data scientists in emerging markets | −0.8% | Africa, South America, Southeast Asia | Long term (≥ 4 years) |
| Interoperability gaps between legacy wired & IoT sensors | −1.1% | Global | Medium term (2-4 years) |
| Source: Mordor Intelligence | |||
High Capex for Remote-Area Wireless Links
Sparse backhaul in remote regions raises deployment costs by up to 45%, deterring adoption despite proven ROI in urban settings. While low-earth-orbit satellite constellations promise relief, terminals remain price-prohibitive for many municipalities, postponing sensor roll-outs on rural bridges and pipelines.
Data-Governance & Cyber-Security Barriers in EU Public Assets
The EU’s stringent General Data Protection Regulation and upcoming Cyber Resilience Act impose encryption, audit, and data-sovereignty obligations that lengthen procurement cycles. Small municipalities struggle to field specialists who can manage tokenization and zero-trust architectures, delaying sensor integrations into cloud supervisory control systems.
*Our forecasts treat driver/restraint impacts as directional, not additive. The impact forecasts reflect baseline growth, mix effects, and variable interactions.
Segment Analysis
By Technology: Wireless Systems Redefine Infrastructure Insights
Wireless platforms underpin USD 4.88 billion of 2025 revenue, equivalent to 61.35% of the infrastructure monitoring market. Supported by improvements in mesh routing, sub-GHz radios, and energy harvesting, wireless networks now achieve five-year battery life, matching wired uptime benchmarks while avoiding conduit and trenching expenses. The infrastructure monitoring market size for wireless systems is forecast to expand at 11.45% CAGR, driven by public bridge retrofits in North America and Europe. In contrast, the wired cohort retains relevance for nuclear plants and long-span tunnels where deterministic latency is non-negotiable.
As cloud vendors introduce digital-signal-processing services, asset managers can deploy vibration and acoustic algorithms without maintaining on-premise servers. Edge-optimized AI chips embedded in wireless gateways now execute modal analysis locally, transmitting compressed features rather than raw waveforms—cutting bandwidth costs by 70%. This shift unlocks green-field opportunities in emerging economies where 3G/4G coverage is patchy yet growing.


By Offering: Services Surpass Hardware in Growth Velocity
Hardware still represents 54.30% of 2025 revenue, but services are set to outpace all other categories with a 12.44% CAGR. The infrastructure monitoring market size for services will rise as owners outsource data engineering, AI model training, and dashboard customization to firms that blend civil-engineering know-how with cloud-native skills. Demand is especially acute in Latin America and Southeast Asia, where engineer shortages hamper in-house program development.
Software platforms account for the remaining 18.35% of spending, yet face persistent integration challenges. Open-source middleware initiatives seek to standardize message brokers and semantic models, but vendor lock-in remains common. Cyber-security hardening features—zero-trust access, secure boot, over-the-air patching—are now baseline requirements for enterprise procurement.
By Deployment Model: Cloud/Edge Catalyzes Real-Time Decision-Making
On-premise systems captured 67.10% revenue in 2025, reflecting entrenched policies on data sovereignty across defense, nuclear, and water utilities. Nevertheless, cloud/edge deployments are advancing fastest at 13.05% CAGR, and their infrastructure monitoring market share is projected to exceed 42.15% by 2031. Edge nodes equipped with FPGA and GPU accelerators perform spectral clustering and anomaly detection against gigahertz data streams, forwarding only exception reports to central repositories.
Hybrid adoption patterns dominate: asset owners retain mission-critical logic on-site but push historical data and machine-learning training to the cloud. Regulatory clarity in Europe around data processing agreements is gradually reducing resistance, while zero-copy encryption technologies strengthen trust in multitenant environments. EPC majors in the GCC are institutionalizing “cloud-first” design guides, setting procurement precedents that ripple across Africa and South Asia.
By Application: Environmental & Seismic Monitoring Accelerates
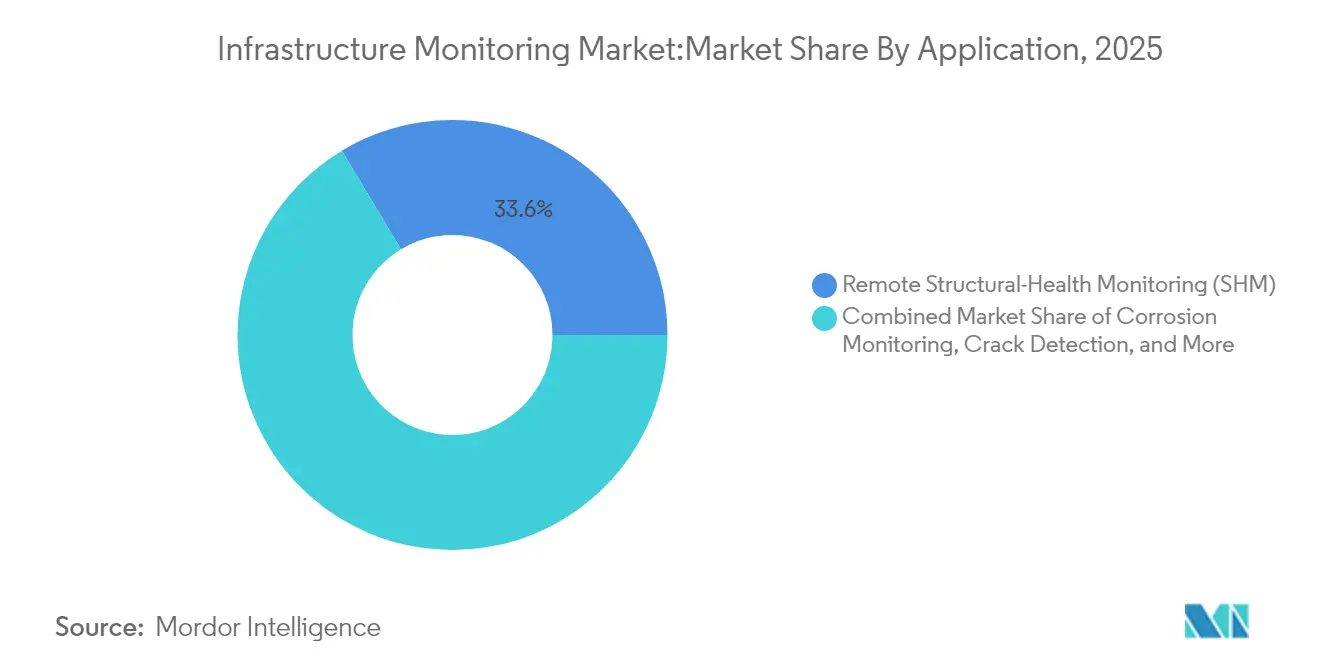
Remote structural health monitoring (SHM) remains the anchor at 33.60% revenue, yet environmental and seismic monitoring are scaling fastest at 12.18% CAGR as climate volatility escalates. The infrastructure monitoring market size for environmental applications will benefit from mandated flood-early-warning networks and landslide detection in mountainous regions. Operators now link rainfall, groundwater, and vibration sensors into integrated dashboards, providing a cohesive risk picture.
Corrosion monitoring is tracking metal-loss rates on offshore platforms with distributed fiber-optic sensors, while crack-width measurement via near-infrared fluorescence imaging reaches 0.08 mm resolution. Meanwhile, vibration and dynamic-load monitoring algorithms are extending bridge fatigue life by predicting traffic-induced stresses more accurately than previous empirical models.
By End-User Industry: Energy & Utilities Surge Ahead
Civil infrastructure held a dominant 46.55% slice in 2025, anchored by bridge and road retrofits in OECD economies. The infrastructure monitoring market size for this segment will continue to grow steadily as federal programs earmark resilience funds. Energy & utilities emerges as the growth pacesetter at 11.88% CAGR, propelled by distributed renewable assets and stricter reliability standards. Utilities layering drone imagery, line-sensor data, and weather feeds are reducing wildfire risks and shaving condition-based maintenance spend by double digits.
Transportation hubs—ports, rail corridors, airports—are expanding roll-outs of fiber-optic vibration arrays to manage increased freight volumes. Aerospace & defense engineers embed high-g accelerometers within runway slabs, monitoring FOD-induced stresses during fighter take-offs. Mining & metals firms deploy atmospheric-corrosion sensors on haul-truck frames, scheduling proactive sand-blasting and extending chassis life.
Geography Analysis
North America anchors 29.40% of 2025 revenue, supported by IIJA-funded digital-twin pilots and a policy push to rehabilitate bridges older than 50 years. Smart-sensor retrofits demonstrate 20% maintenance cost savings, prompting state agencies to incorporate sensing budgets into resurfacing contracts. Canadian provinces leverage federal green-infrastructure grants to trial edge-AI crack detection on remote timber bridges, while Mexico accelerates toll-road concessions that stipulate condition-based monitoring from day one.
Asia-Pacific delivers the steepest trajectory with a 11.86% CAGR through 2031. China’s 14th Five-Year Plan prioritizes SHM on high-speed rail viaducts, and Japan’s Society 5.0 target embeds robotics in tunnel maintenance. India’s Smart Cities Mission funds integrated command centers that ingest flood gauges and traffic sensors, offering a blueprint for mid-tier cities across ASEAN. Australia’s asset-management councils adopt fiber-optic strain lines on coastal seawalls to anticipate storm-surge damage, a practice now spreading to New Zealand and Pacific Island states.
Europe’s regulatory rigor fosters early adoption of predictive-maintenance mandates. Nordic countries pioneer infrastructure-as-a-service concessions where contractors guarantee uptime using continuous monitoring. The Netherlands applies real-time deflection sensing on dykes to counter sea-level rise, while Germany pilots quantum gravimetry to detect subsidence beneath Autobahn foundations. Southern Europe channels pandemic-recovery funds into seismic retrofits, bundling accelerometers with energy-efficiency upgrades.

Competitive Landscape
The market comprises diversified industrials, vertical-focused specialists, and venture-backed disruptors. The top five vendors collectively capture 35-40% of revenue, signalling moderate concentration. Siemens AG and Schneider Electric pursue platform consolidation, adding analytics layers and field-service capabilities via targeted M&A. Siemens’ new USD 190 million Texas facility exemplifies a capacity build-out to localize production for North American AI-enabled infrastructure programs. Schneider Electric’s motion-control launches extend its edge-compute portfolio, offering deterministic control for high-speed data acquisition.
Specialists such as Worldsensing and Sixense Group command loyalty in geotechnical and tunnel monitoring niches, leveraging proprietary long-range telemetry and high-precision fiber-optic sensors. Civionics positions as a pure-play wireless sensor vendor for bridge health, winning DOT pilots where retrofit downtime must be negligible. Start-ups exploit white spaces in secondary-road monitoring by packaging sub-USD 2 MEMS sensors with AI-in-a-box gateways, appealing to county engineers with limited IT staff.
Strategic partnerships focus on de-risking full-stack deployments: cloud hyperscalers sign MOUs with civil-engineering firms to simplify data ingestion; telecom carriers bundle 5G private networks with edge gateways; and drone operators integrate orthophoto analytics into SHM dashboards. Quantum sensing research at CU Boulder hints at longer-term disruption by enabling single-sensor multi-parameter measurements, potentially trimming instrument counts on future projects.
Infrastructure Monitoring Industry Leaders
-
National Instruments Corporation
-
Pure Technologies Ltd. Company (Xylem Inc.)
-
Structural Monitoring Systems plc
-
Acellent Technologies, Inc.
-
Campbell Scientific, Inc.
- *Disclaimer: Major Players sorted in no particular order

Recent Industry Developments
- May 2025: DP World pledged USD 2.5 billion for logistics-infrastructure upgrades, embedding end-to-end sensor suites to enhance supply-chain visibility.
- April 2025: Siemens inaugurated a USD 190 million Fort Worth plant to localize production of AI-ready electrical equipment for data-center and infrastructure clients.
- March 2025: Schneider Electric unveiled the Modicon M660 IPC motion controller and Altivar Process ATV6100 drive, deepening edge-compute integration in monitoring systems.
- February 2025: Indutrade completed 16 acquisitions spanning sensors and civil-infrastructure services, broadening its monitoring portfolio.


Research Methodology Framework and Report Scope
Market Definitions and Key Coverage
Mordor Intelligence defines the infrastructure monitoring market as the revenue generated worldwide from sensors, data-acquisition units, edge or cloud-based analytics, and related services that gather, transmit, and interpret structural or environmental readings across civil, energy, and industrial assets in order to prevent failure and optimize lifecycle costs.
Scope Exclusions: Routine SCADA, general IT log monitoring, and standalone cybersecurity tools sit outside our boundary.
Segmentation Overview
-
By Technology
- Wired
- Wireless
-
By Offering
- Hardware
- Software
- Services
-
By Deployment Model
- On-premise
- Cloud / Edge
-
By Application
- Corrosion Monitoring
- Crack / Strain Detection
- Vibration and Dynamic Load Monitoring
- Remote Structural-Health Monitoring (SHM)
- Environmental and Seismic Monitoring
-
By End-user Industry
- Civil Infrastructure (Bridges, Roads, Tunnels, Dams)
- Energy and Utilities
- Aerospace and Defense
- Mining and Metals
- Oil and Gas / Petro-chemicals
- Transportation (Harbors, Rail, Airports)
-
By Geography
-
North America
- United States
- Canada
- Mexico
-
South America
- Brazil
- Argentina
- Rest of South America
-
APAC
- China
- Japan
- India
- South Korea
- ASEAN
- Rest of APAC
-
Europe
- Germany
- United Kingdom
- France
- Italy
- Nordics
- Rest of Europe
-
Middle East and Africa
- GCC
- Turkey
- Rest of Middle East and Africa
-
North America
Detailed Research Methodology and Data Validation
Primary Research
We validate assumptions through interviews with structural engineers, municipal asset managers, sensor OEM product heads, and regional installers across North America, Europe, Asia-Pacific, and the Gulf. These discussions clarify real installation costs, typical sensor densities, emerging wireless preferences, and service contract renewal cycles, helping our team reconcile desk findings with ground reality.
Desk Research
Our analysts gather baseline figures from reputable, freely accessible sources such as the US Federal Highway Administration, Eurostat construction output dashboards, Japan MLIT bridge registers, UN Comtrade shipment codes for smart sensors, and white papers from bodies such as IEEE and ASCE. Paid intelligence platforms, including D&B Hoovers for company revenues and Dow Jones Factiva for deal flow, supply hard-to-source financial clues that tighten model inputs. The team also mines patent alerts on Questel and project tenders on Tenders Info to gauge technology uptake and contract momentum. These sources are illustrative; numerous additional repositories are reviewed before any number is locked in.
Market-Sizing & Forecasting
A top-down build begins with national infrastructure outlay and installed-base counts, which are then linked to sensor penetration ratios, average selling prices, and service attach rates. Selective bottom-up cross-checks, such as supplier roll-ups and sampled ASP × volume worksheets, fine-tune totals. Inputs that move the dial include bridge deck area under repair, MEMS price erosion curves, wireless battery life improvements, cloud analytics adoption rates, season-adjusted construction spending, and currency shifts. Multivariate regression combined with scenario analysis projects these drivers through 2030, while gaps in bottom-up coverage are bridged by region-specific substitution factors vetted in interviews.
Data Validation & Update Cycle
Outputs flow through variance dashboards that flag deviations versus historical spend, public contract awards, and import statistics. Senior reviewers challenge anomalies, after which a fresh fact pass is completed before release. Reports refresh every twelve months, with mid-cycle tweaks if material events surface.
Why Our Infrastructure Monitoring Baseline Earns Trust
Published estimates often diverge because firms frame the market differently, convert currencies on separate dates, or extrapolate older datasets. Our disciplined scoping, annual refresh, and balanced top-down plus bottom-up blend keep figures dependable for planners.
Key gap drivers include exclusion of analytics software by some publishers, aggressive roll-forward of 2020-era sensor costs, or limited geographic samples that understate newer demand pockets in Southeast Asia.
Benchmark comparison
| Market Size | Anonymized source | Primary gap driver |
|---|---|---|
| USD 7.95 B (2025) | Mordor Intelligence | - |
| USD 6.45 B (2025) | Global Consultancy A | Omits cloud analytics and uses straight-line capex growth |
| USD 4.96 B (2023) | Trade Journal B | Last update in 2023 and focuses mainly on hardware for civil bridges |
These contrasts show that Mordor's refreshed scope, live price tracking, and broader asset coverage deliver a balanced, transparent baseline users can replicate with clear variables and repeatable steps.


Key Questions Answered in the Report
How big is the Infrastructure Monitoring Market?
The Infrastructure Monitoring Market size is expected to reach USD 8.74 billion in 2026 and grow at a CAGR of 9.96% to reach USD 14.05 billion by 2031.
What is the current size of the infrastructure monitoring market?
The market is valued at USD 8.74 billion in 2026.
How fast is the infrastructure monitoring market expected to grow?
It is projected to advance at a 9.96% CAGR and reach USD 14.05 billion by 2031.
Which technology segment holds the largest infrastructure monitoring market share?
Wireless systems dominate with 61.35% share in 2025 and continue to outpace other technologies.
Which application area is expanding most rapidly?
Environmental and seismic monitoring leads with a 12.18% CAGR through 2031.
Which region offers the strongest growth outlook?
Asia-Pacific shows the fastest expansion, with a 11.86% CAGR forecast for 2026-2031.
Why are digital twins important for infrastructure monitoring?
Digital twins integrate real-time sensor data with virtual models, enabling predictive maintenance and reducing lifecycle costs across bridges, tunnels, and utility networks.
Page last updated on:


