Sri Lanka Used Car Market Size and Share
Market Overview
| Study Period | 2019 - 2031 |
|---|---|
| Forecast Data Period | 2026 - 2031 |
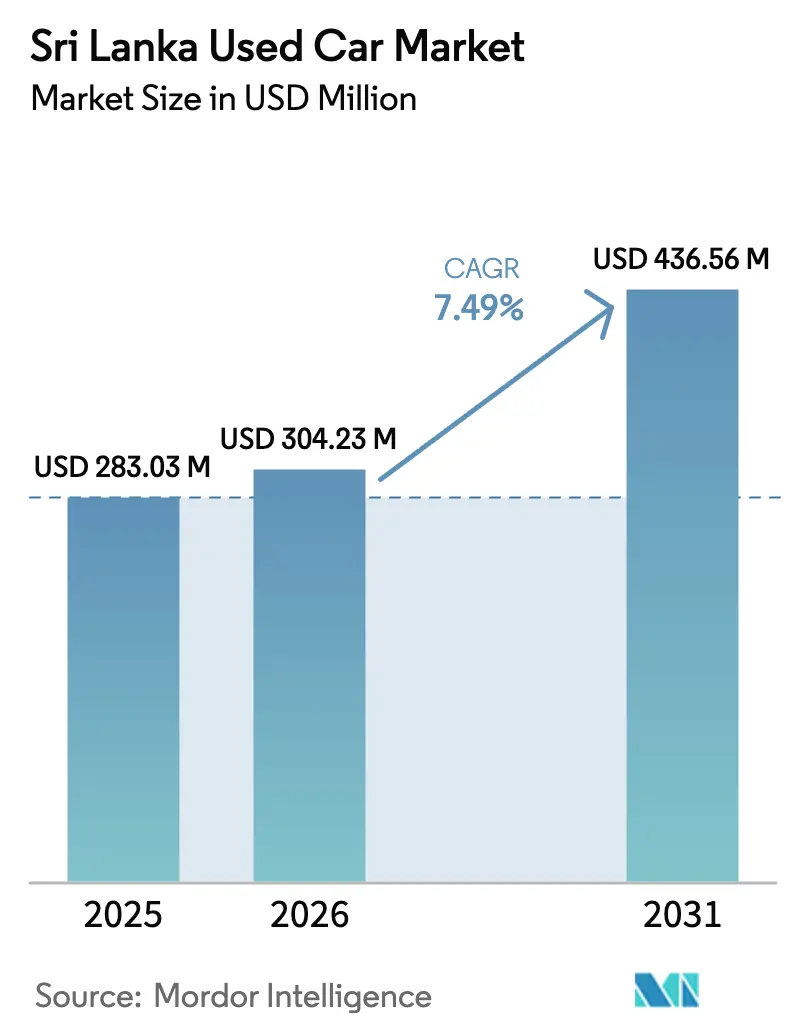
| Base Year Market Size (2025) | USD 283.03 Million |
| Market Size (2026) | USD 304.23 Million |
| Market Size (2031) | USD 436.56 Million |
| Growth Rate (2026 - 2031) | 7.49% CAGR |
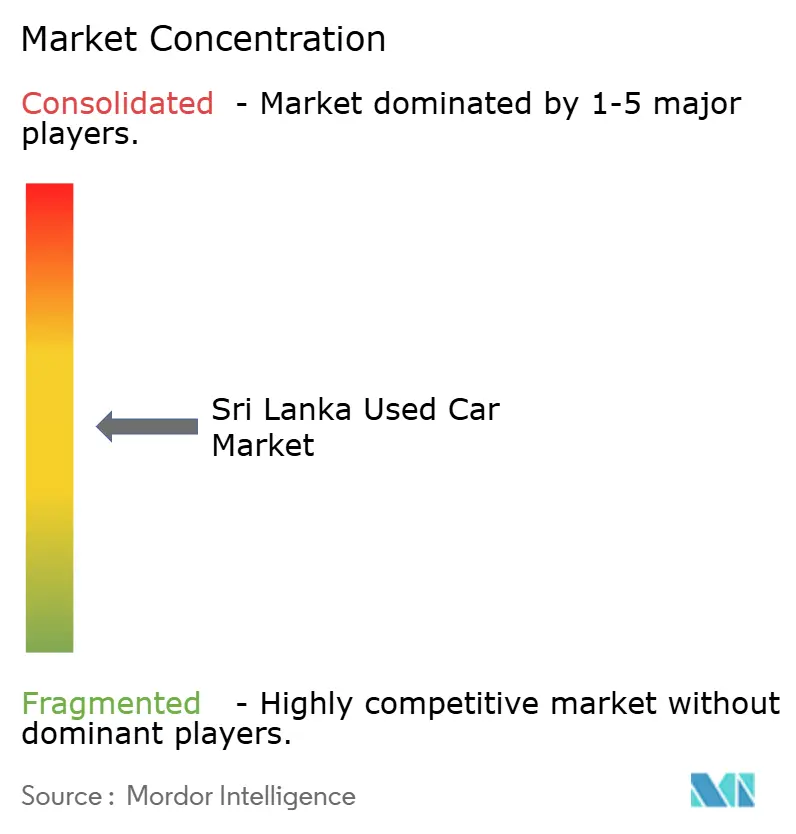
| Market Concentration | Medium |
Major Players
*Disclaimer: Major Players sorted in no particular order Image © Mordor Intelligence. Reuse requires attribution under CC BY 4.0. |
|
Sri Lanka Used Car Market Analysis by Mordor Intelligence
The Sri Lankan used car market size is projected to be USD 283.03 million in 2025, USD 304.23 million in 2026, and reach USD 436.56 million by 2031, growing at a CAGR of 7.49% from 2026 to 2031. The rebound follows February 2025’s removal of a three-year import freeze, a policy shift that has released pent-up demand yet preserved high indirect taxes that keep most consumers oriented toward pre-owned rather than new vehicles. E-commerce penetration, fintech-enabled credit, and standardized inspection programs are raising buyer confidence in organized channels, while foreign-exchange management continues to influence product mix as import duties fluctuate within a narrow, revenue-protective band. Hatchbacks and 3-to-5-year-old units dominate volume because their smaller displacement attracts lower luxury levies and better fuel subsidies, whereas SUVs enjoy the fastest growth due to demand from ride-hailing operators and affluent families upgrading for inter-city travel.
Key Report Takeaways
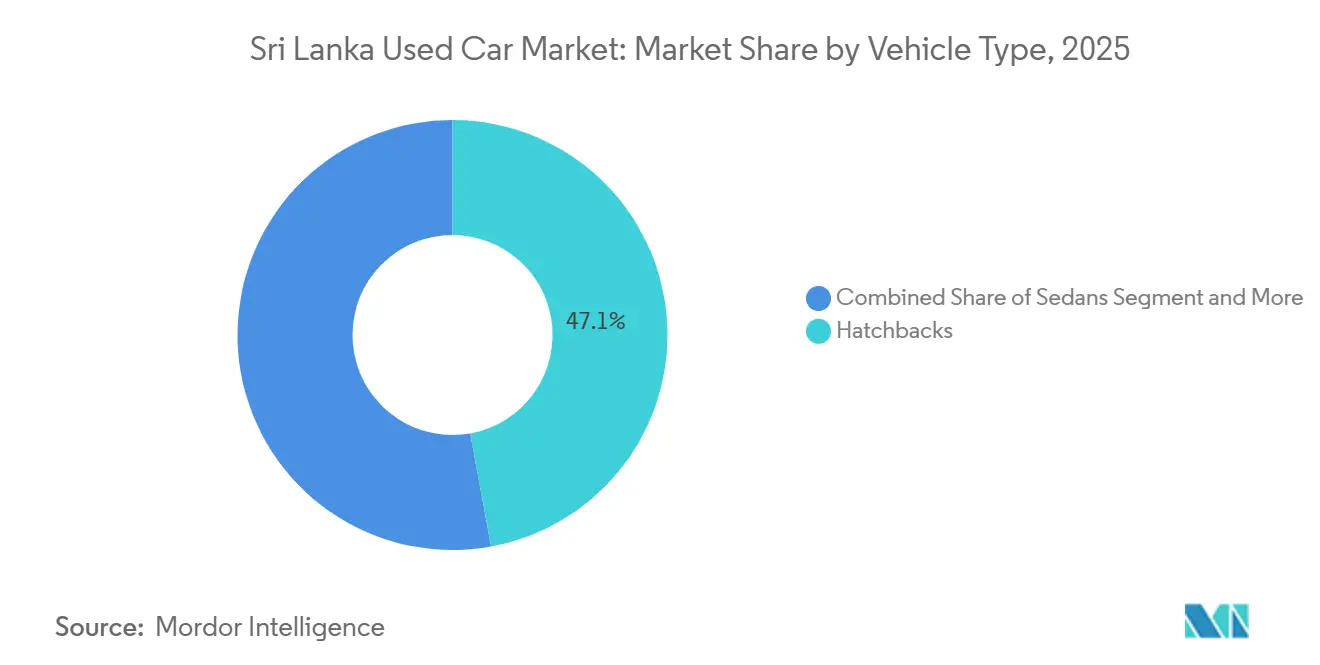
- By vehicle type, hatchbacks led with 47.14% of Sri Lanka used car market share in 2025; sport-utility vehicles are forecast to expand at a 7.53% CAGR through 2031.
- By vendor type, the unorganized segment held 85.06% share in 2025, while organized sellers are advancing at a 9.78% CAGR to 2031.
- By fuel type, petrol vehicles captured 69.69% share in 2025; battery-electric vehicles are rising at an 18.07% CAGR over the forecast period.
- By vehicle age, the 3-to-5-year cohort accounted for 42.02% of the Sri Lankan used-car market in 2025 and is growing at a 7.9% CAGR through 2031.
- By price segment, the USD 5,000-to-9,999 band commanded 33.82% share in 2025; units priced above USD 30,000 are projected to gain at a 10.05% CAGR.
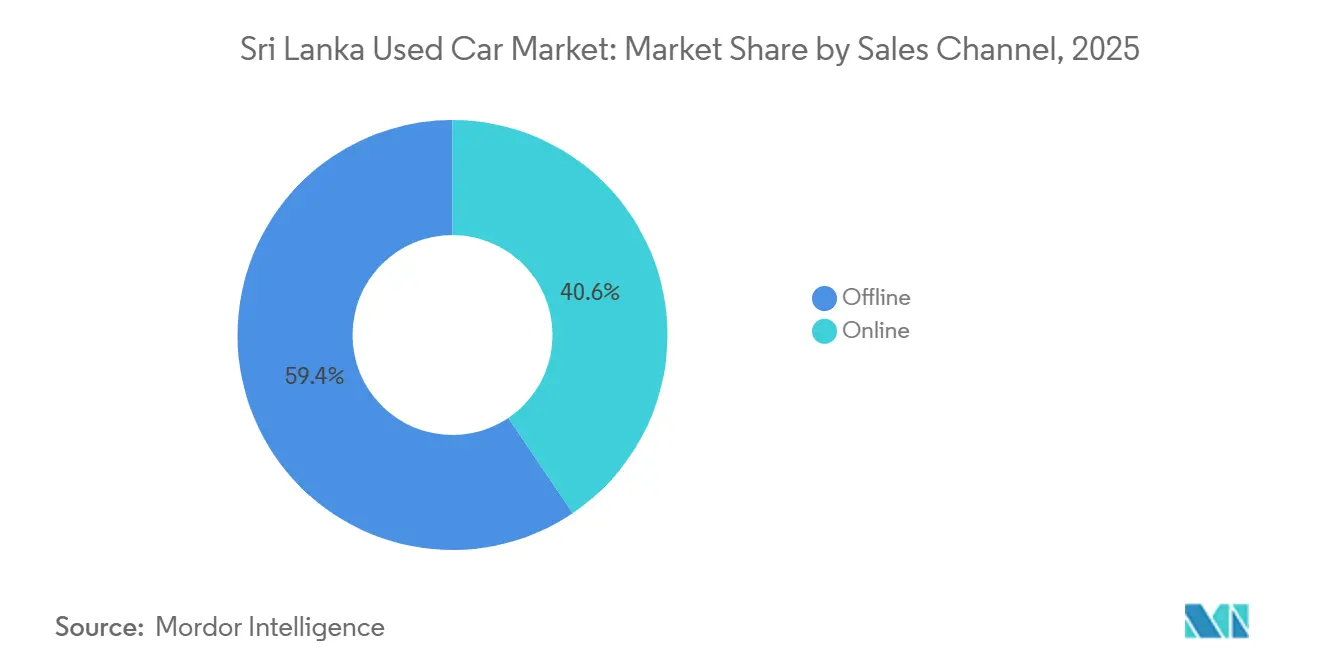
- By sales channel, the offline (multi-brand independent dealers) segment held 59.44% share in 2025, while OEM-certified online stores are projected to post a 14.24% CAGR.
- By ownership, multi-owner vehicles held a dominant 58.41% market share in 2025. Meanwhile, first-owner resales are projected to expand at a steady 8.25% CAGR, continuing through 2031.
Note: Market size and forecast figures in this report are generated using Mordor Intelligence’s proprietary estimation framework, updated with the latest available data and insights as of January 2026.
Figures recorded within Sri lanka feed into a worldwide estimate while studying the global industry. Mordor Intelligence's used car market size captures this aggregation.
Sri Lanka Used Car Market Trends and Insights
Drivers Impact Analysis*
| Driver | (~)% Impact on CAGR Forecast | Geographic Relevance | Impact Timeline |
|---|---|---|---|
| Vehicle-Import Ban Relaxation | +2.8% | Western Province (Colombo, Gampaha, Kalutara), Central Province (Kandy), Southern Province (Galle, Matara) | Medium term (2-4 years) |
| EV-Conversion Rebate | +1.6% | Western Province (Colombo, Gampaha), North Western Province (Kurunegala) | Short term (≤ 2 years) |
| Online Classifieds and Digital Payments | +1.4% | Western Province (Colombo, Gampaha), Central Province (Kandy), Southern Province (Galle) | Medium term (2-4 years) |
| Fin-tech Escrow and Instant-Loan Apps | +1.2% | Western Province (Colombo, Gampaha, Kalutara), Southern Province (Galle, Matara) | Short term (≤ 2 years) |
| Ride-Hailing Fleet Renewal Cycles | +0.9% | Western Province (Colombo, Gampaha), Central Province (Kandy) | Medium term (2-4 years) |
| Aftermarket Warranty and Inspection Services | +0.7% | Western Province (Colombo, Gampaha), North Western Province (Kurunegala), Central Province (Kandy) | Long term (≥ 4 years) |
| Source: Mordor Intelligence | |||
Gradual Relaxation of Vehicle-Import Ban
Sri Lanka's vehicle import restrictions, which will be lifted in phases starting February 2025, are designed to expand supply while managing foreign exchange pressures through a structured allocation system. The government plans to prioritize public transport and commercial vehicles first, delaying private imports to a later stage. This approach ensures that infrastructure needs are addressed before consumer demand. By sequencing imports in this manner, the government aims to prevent a depletion of foreign exchange that caused the 2020 import ban, while gradually meeting the pent-up demand that has driven used vehicle prices to 2-3 times their pre-ban levels. The USD 1 billion annual import allocation represents a carefully calibrated approach to market liberalization that balances consumer access with macroeconomic stability[1]Anbarasan Ethirajan "Sri Lanka eases vehicle import ban, but can people afford a new car?", BBC, .bbc.com. .
Government EV-Conversion Rebate Releasing ICE Inventory
In 2024, a rebate encouraged the scrapping of internal-combustion vehicles in favor of electric ones. This initiative has led early adopters, particularly ride-hailing drivers, to trade in their relatively new petrol hatchbacks. These low-mileage vehicles have started appearing in organized lots[2]P Nandalal Weerasinghe, "Sri Lanka's sustained economic growth", Bank for International Settlements, bis.org.. Over time, this has created a fresh inventory stream that appeals to mid-tier buyers. Dealers market these cars as “EV-upgrade trade-ins,” distinguishing them from older, multi-owner stock and justifying slightly higher prices. With plans to expand the rebate to Gampaha and Kandy in the coming years, this trend is expected to grow further. The quicker turnover of these newer cars also helps stabilize depreciation and supports better residual values, making longer loan terms more viable.
Surge in Online Classifieds and Digital Payments
The Sri Lankan cashless transaction market demonstrates substantial growth, aligning with broader South Asian market trends. Analysis indicates significant expansion in online classifieds and digital payments, driven by rising internet and smartphone penetration, greater transaction accessibility, and pandemic-induced behavioral shifts. Market assessment reveals notable growth in e-commerce activities and the rising adoption of digital payment solutions, particularly LankaQR for contactless transactions. The PhonePe-LankaPay partnership enables UPI payment acceptance across merchant networks, reducing transaction friction for cross-border buyers and business travelers. This infrastructure development addresses traditional pain points in used-vehicle transactions, where cash-heavy exchanges and complex documentation previously deterred many potential buyers. Platform operators increasingly integrate financing options, inspection services, and warranty products, creating ecosystem approaches that capture higher transaction values while improving buyer confidence.
Fin-tech Escrow and Instant-Loan Apps Easing Transactions
Digital payment infrastructure development fundamentally transforms the mechanics of used-vehicle transactions, where traditional cash-heavy exchanges and lengthy financing approvals previously created significant friction for buyers and sellers. The PhonePe-LankaPay partnership enables UPI payments across LankaQR merchant networks, providing secure transaction processing that reduces counterparty risks inherent in high-value used-vehicle purchases. Seylan Bank's implementation of electronic know-your-customer (eKYC) technology streamlines account openings and loan approvals, while SeylanPay integration simplifies payment processing for automotive transactions. These technological solutions address traditional pain points that have deterred many potential transactions, particularly in premium segments where transaction values exceed typical cash payment comfort levels.
Restraints Impact Analysis*
| Restraint | (~)% Impact on CAGR Forecast | Geographic Relevance | Impact Timeline |
|---|---|---|---|
| Excise Duties and VAT on Imports | -1.8% | Western Province (Colombo, Gampaha, Kalutara), Central Province (Kandy), Southern Province (Galle, Matara) | Long term (≥ 4 years) |
| Odometer and Accident-History Fraud | -1.2% | Western Province (Colombo, Gampaha), North Western Province (Kurunegala), Southern Province (Galle) | Medium term (2-4 years) |
| Double-Digit Inflation | -0.9% | Western Province (Colombo, Gampaha), Central Province (Kandy), Southern Province (Galle, Matara) | Short term (≤ 2 years) |
| Limited Battery-Health Data | -0.6% | Western Province (Colombo, Gampaha), Central Province (Kandy) | Medium term (2-4 years) |
| Source: Mordor Intelligence | |||
Still-Elevated Excise Duties and VAT on Imports
The new tax structure imposes excise duties up to 300% based on engine capacity, alongside 18% VAT, creating affordability barriers that constrain market expansion despite the relaxation of the import ban. These rates increase vehicle costs by LKR 500,000 to 1,000,000 (USD 1,618 to 3,236) and effectively price out middle-income buyers, representing the market's growth engine. The tax policy reflects government revenue priorities following the economic crisis, where vehicle imports provide substantial fiscal contributions despite the effects of demand suppression. This creates a structural tension between revenue generation and market development, limiting the full realization of pent-up demand accumulated during the import ban period.
Odometer and Accident-History Fraud
Sri Lanka still relies on a largely paper-based registration system, creating loopholes that allow mileage tampering and concealment of foreign accident records when cars are imported from Japan. Estimates suggest that as many as one-quarter of unorganized listings in 2025 contained manipulated odometer readings. Legal penalties are nominal, and inspection standards vary widely outside Colombo, so rural buyers remain vulnerable. Organized dealers do offer 150-point checks, but the fees significantly raise unit costs, limiting uptake among price-sensitive segments. Until a centralized, tamper-proof vehicle-history database is adopted, consumer skepticism will temper the shift toward formal channels.
*Our forecasts treat driver/restraint impacts as directional, not additive. The impact forecasts reflect baseline growth, mix effects, and variable interactions.
Segment Analysis
By Vehicle Type: SUVs Drive Premium Segment Growth
Hatchbacks command a leading 47.14% market share due to their affordability and fuel efficiency in a price-sensitive landscape. Yet SUVs are surging ahead, with a 7.53% CAGR projected through 2031, fueled by urbanization and shifting lifestyle choices of Sri Lankan consumers. Sedans find their niche, appealing to both corporate and family buyers, while MPVs cater to commercial passenger transport and larger families. Meanwhile, the "Others" category - spanning convertibles, coupes, crossovers, and sports cars - remains constrained, hampered by import restrictions and hefty taxes on luxury vehicles.
The rising preference for SUVs underscores significant socioeconomic shifts. As Sri Lanka's middle class grows and urban infrastructure improves, demand for higher-clearance vehicles is rising. International manufacturers, like Revolt Motors with its RV400 electric motorcycle and Ather Energy with its expansion, are eyeing Sri Lanka as a prime market for alternative mobility. This trend indicates a shift towards utility-centric vehicles, well-suited for both city commutes and occasional off-roading, especially as infrastructure expands in suburban and rural areas.


By Vendor Type: Organized Players Gain Market Share
Unorganized vendors commanded 85.06% of the Sri Lankan used car market share in 2025, a legacy of informal cash deals and limited consumer protection. Organized providers, however, are growing at 9.78% CAGR, supported by inspection centers, escrow-protected payments, and 12-month powertrain warranties that de-risk purchases for first-time buyers. Western Province hosts the highest density of certified lots, where seller fees fund 150-point checks that guarantee mileage accuracy and structural integrity.
Technology compounds this shift. Riyasewana’s API plug-in to the Department of Motor Traffic lets shoppers instantly authenticate title status, a feature that helped raise certified listings by a significant margin. Indian entrant CARS24 has signaled plans to replicate its refurbishment-plus-e-commerce model locally, which could accelerate professionalization. Unorganized traders remain strong in Kurunegala and Galle, but looming 2026 legislation mandating third-party inspections for vehicles older than 10 years will increase their costs by LKR 8,000-12,000 (USD 25.89-38.84) per unit, shrinking margins and nudging them either to formalize or exit.
By Fuel Type: Electric Vehicles Accelerate Despite Petrol Dominance
Petrol engines held 69.69% share in 2025, underpinned by 1,200-plus filling stations that guarantee nationwide range confidence. Diesel, at 18% share, is losing ground as subsidies wind down and resale values wobble. Hybrids occupy a subtle share of the fleet, mostly Toyota Aqua and Prius units favored by ride-hailing drivers. Battery-electric vehicles, though still small, are expanding at an 18.07% CAGR, buoyed by conversion rebates and falling battery costs.
Standardized battery-health reports remain uncommon outside Colombo, dampening EV expansion in rural areas. Organized dealers are piloting third-party capacity tests that add significantly to transaction costs, but early adopters are willing to pay the premium to secure warranty transfers. Diesel’s decline is quickening among pickup fleets shifting to petrol to sidestep the 2028 subsidy sunset. Hybrids enjoy a virtuous circle: high ride-hailing uptime maximizes fuel savings, raising fleet demand and funneling young, documented trade-ins into organized lots.

By Vehicle Age: Newer Vehicles Command Premium Growth
Units aged 3-to-5 years represented 42.02% of Sri Lanka used car market size in 2025, offering the sweet spot of depreciated pricing plus residual warranty coverage. Dealers can secure financing terms up to seven years on this cohort, a feature that aligns with middle-income cash-flow constraints. The 0-to-2-year bracket is smaller but growing at 8.79% CAGR, thanks to the import-ban lift that makes near-new Japanese stock widely available.
Older inventories confront regulatory drag. Vehicles over nine years old face mandatory Euro 4 retrofits by 2027, pushing owners either to scrap or bear compliance costs that erode resale prices. Policy uncertainty also crimps demand for 6-to-8-year cars, because buyers worry about crossing the 10-year inspection trigger soon after purchase. Ride-hailing fleets help stabilize the 3-to-5-year segment by cycling out cars once manufacturer warranties lapse, feeding organized sellers with documented, single-owner stock that commands small but defensible premiums.
By Price Segment: Mid-Tier Dominates, Premium Segment Surges
The USD 5,000-to-9,999 bracket accounted for 33.82% of the 2025 market, dominated by hatchbacks and sedans that marry affordability with basic infotainment and safety features. Easy-pay loans from People’s Bank reduce monthly installments to roughly USD 120 on a USD 8,000 ticket, matching the income profiles of households earning LKR 80,000-100,000 (USD 248 - 310) per month. At the other end, vehicles priced above USD 30,000 are projected to grow at a 10.05% CAGR as repatriated professionals and ride-hailing VIP services demand premium SUVs.
Sub-USD 5,000 inventory is shrinking under the weight of forthcoming inspection mandates that raise compliance costs by up to 8%. Mid-premium bands (USD 10,000-to-29,999) soak up demand from hybrid and SUV upgraders who benefit from seven-year loan tenures. Chinese luxury EV brands now offer three-year-old certified units at 20-30% discounts to new-car prices, broadening choice for high-net-worth buyers and putting pressure on traditional German marques to match warranty lengths.
By Sales Channel: Multi-Brand Independents Lead, OEM-Certified Online Stores Fastest-Growing
Multi-brand independents generated 59.44% of sales in 2025, owing to their deep supplier networks and willingness to accept trade-ins across makes. OEM-certified online stores, while starting from a small base, are accelerating at a 14.24% CAGR as Toyota Lanka and Nissan Ceylon digitize storefronts, integrate financing APIs, and offer 7-day return policies. Digital classifieds account for roughly 18% of volume but wield outsized influence because their pricing dashboards serve as market benchmarks.
Embedded escrow and instant-credit widgets in listings compress settlement cycles from a week to under 2 days, freeing up working capital and reducing fraud. Pure-play e-retailers bundle insurance and doorstep delivery, attracting first-time online buyers who prize convenience over haggling. Physical auction houses still handle about 8% of transactions, servicing trade buyers who lack funds to import directly, yet their market share is expected to taper as digital wholesale exchanges scale.
By Ownership: Multi-Owner Vehicles Dominate Supply
Multi-owner vehicles command 58.41% market share in 2025, reflecting the natural progression of vehicle ownership through multiple hands over their useful life. However, first-owner resales grow at an 8.25% CAGR through 2031, indicating increased supply from fleet operators, corporate users, and affluent individuals who upgrade their vehicles more frequently. This ownership pattern creates distinct market segments with different pricing, warranty, and financing characteristics that appeal to specific buyer profiles.
The first-owner growth trend reflects several factors: ride-hailing fleet expansion, creating regular disposal cycles; corporate fleet modernization driven by tax incentives; and individual upgrade patterns as financing becomes more accessible. PickMe's franchise expansion and 72.2% earnings increase demonstrate sustainable business models that generate predictable first-owner supply through regular fleet renewal. This institutional supply source sets inventory quality and documentation standards that command premium pricing while reducing information asymmetries that traditionally complicate used-vehicle transactions.
Geography Analysis
Western Province, encompassing Colombo, Gampaha, and Kalutara, accounted for the majority of market share in 2025, underpinned by its robust contribution to national GDP, dense road network, and concentration of fintech services that facilitate on-the-spot loan approvals. Colombo alone contributed more than half of the monthly classified inventory that year, reflecting urban commuters’ reliance on private transport amid limited rail capacity. High foot traffic at port auctions and proximity to inspection centers also tilt supply toward the capital. Suburbanization pushes demand into Gampaha, where newly built expressways shorten travel times and encourage families to shift from two-wheelers to compact cars.
Central Province, led by Kandy, is expanding as tea-estate workers and government staff graduate into entry-level hatchbacks financed by mobile-money lenders. Platform analytics show that verified listings from Kandy climbed significantly after fintech escrow became available in late 2024. Southern Province registered progress with tourism operators upgrading to SUVs and MPVs geared for airport transfers and coastal hotel routes. Better road connectivity from the Southern Expressway fuels inter-city travel and elevates resale values for larger vehicles.
North Western and Sabaragamuwa Provinces enjoy above-trend growth because organized dealers are opening satellite showrooms that pull inventory from Colombo and resell at 8-12% premiums. Kurunegala stands out with 188 monthly listings, fourth nationally, signaling its rise as a logistics hub linking the north and south. Northern and Eastern Provinces lag, hampered by lower disposable incomes and weaker road networks. Digital classifieds are narrowing historic price gaps among regions, but infrastructure disparities still dictate transaction velocity.
Mordor Intelligence evaluates the used car market across all key regional markets, including Africa, with deeper country-level insights covering Bangladesh, New Zealand, Kenya, South Korea, Brazil, Kuwait, Canada, and Qatar.
Competitive Landscape
The Sri Lankan used-car market is moderately fragmented, with emerging consolidation pressures as digital platforms and financing partnerships create competitive advantages for organized players. Market concentration remains relatively low, with no single player commanding a dominant share, yet technology adoption and capital access increasingly differentiate successful operators from traditional dealers. Established platforms like Ikman leverage comprehensive listing capabilities and user-friendly interfaces to capture transaction volume. At the same time, specialized dealers like Indra Traders maintain competitive positions through brand partnerships and established customer relationships.
The competitive intensity increases as import restrictions ease and supply becomes more available, forcing players to differentiate through service quality, financing options, and digital capabilities rather than through inventory scarcity. Strategic patterns reveal three distinct approaches: platform aggregators that connect buyers and sellers while providing transaction services, traditional dealers that emphasize personal relationships and physical inspection capabilities, and hybrid models that combine digital reach with physical presence.
PickMe's evolution from ride-hailing to comprehensive mobility solutions demonstrates how successful companies expand beyond core services to capture additional revenue streams and customer touchpoints. White-space opportunities exist in aftermarket services, warranty products, and financing solutions that address traditional pain points in used vehicle transactions. Emerging disruptors include fintech companies that provide instant loan approvals and international platforms that bring global best practices to local market conditions.
Sri Lanka Used Car Industry Leaders
-
Ikman
-
Riyasewana
-
Patpat
-
Autodirect
-
Careka
- *Disclaimer: Major Players sorted in no particular order

Recent Industry Developments
- February 2025: The Sri Lankan government officially lifted the five-year vehicle import ban, allowing the import of buses, trucks, utility vehicles, and private cars, subject to a three-year age limit and an annual allocation of USD 1 billion. This policy reversal addresses pent-up demand while managing foreign-exchange pressures through structured import quotas and higher tax rates.
- January 2025: A new vehicle tax structure was implemented, with excise duties up to 300% based on engine capacity and an 18% VAT, increasing vehicle costs by LKR 500,000 to 1,000,000 (USD 1,618-3,236). The Lanka Vehicle Importers Association warned of dramatic price increases unless policy adjustments are made to allow the import of 7-year-old vehicles.


Sri Lanka Used Car Market Report Scope
A used car/pre-owned vehicle, or a secondhand car, is a vehicle that previously had one or more retail owners. A certified pre-owned (CPO) vehicle, on the other hand, is a pre-owned vehicle that has been extensively inspected (pre-purchase inspection) and expertly reconditioned. The used car market consists of a wide range of companies involved in the purchasing and selling of pre-owned vehicles through online or offline sales channels.
The Sri Lanka used car market is segmented by vehicle type, vendor type, fuel type, and sales channel. By vehicle type, the market is segmented into hatchbacks, sedans, and sports utility vehicles (SUVs)/multi-purpose vehicles (MPVs). By vendor type, the market is segmented into organized and unorganized. By fuel type, the market is segmented into petrol, diesel, electric, and other fuel types (liquefied petroleum gas, compressed natural gas, etc.). By sales channel, the market is segmented into online and offline. The report offers market size and forecast in terms of value (USD) and volume (units) for all the above segments.
| Hatchbacks |
| Sedans |
| Sport-Utility Vehicles (SUVs) |
| Multi-Purpose Vehicles (MPVs) |
| Others (convertibles, coupes, crossovers, sports cars) |
| Organized |
| Unorganized |
| Petrol |
| Diesel |
| Hybrid (HEV and PHEV) |
| Battery-Electric (BEV) |
| Others |
| 0 to 2 Years |
| 3 to 5 Years |
| 6 to 8 Years |
| 9 to 12 Years |
| More Than 12 Years |
| Less Than 5,000 |
| 5,000 to 9,999 |
| 10,000 to 14,999 |
| 15,000 to 19,999 |
| 20,000 to 29,999 |
| More Than 30,000 |
| Online | Digital Classified Portals |
| Pure-play e-Retailers | |
| OEM-Certified Online Stores | |
| Offline | OEM-Franchised Dealers |
| Multi-brand Independent Dealers | |
| Physical Auction Houses |
| First-owner Resale |
| Multi-owner |
| By Vehicle Type | Hatchbacks | |
| Sedans | ||
| Sport-Utility Vehicles (SUVs) | ||
| Multi-Purpose Vehicles (MPVs) | ||
| Others (convertibles, coupes, crossovers, sports cars) | ||
| By Vendor Type | Organized | |
| Unorganized | ||
| By Fuel Type | Petrol | |
| Diesel | ||
| Hybrid (HEV and PHEV) | ||
| Battery-Electric (BEV) | ||
| Others | ||
| By Vehicle Age | 0 to 2 Years | |
| 3 to 5 Years | ||
| 6 to 8 Years | ||
| 9 to 12 Years | ||
| More Than 12 Years | ||
| By Price Segment (USD) | Less Than 5,000 | |
| 5,000 to 9,999 | ||
| 10,000 to 14,999 | ||
| 15,000 to 19,999 | ||
| 20,000 to 29,999 | ||
| More Than 30,000 | ||
| By Sales Channel | Online | Digital Classified Portals |
| Pure-play e-Retailers | ||
| OEM-Certified Online Stores | ||
| Offline | OEM-Franchised Dealers | |
| Multi-brand Independent Dealers | ||
| Physical Auction Houses | ||
| By Ownership | First-owner Resale | |
| Multi-owner | ||


Key Questions Answered in the Report
What growth rate is projected for the Sri Lanka used car market between 2026 and 2031?
The market is forecasted to grow at a 7.49% CAGR, rising from USD 304.23 million in 2026 to USD 436.56 million by 2031.
Which vehicle type leads sales volume in Sri Lanka?
Hatchbacks dominate with 47.14% share due to lower running costs, compact size, and favorable taxes.
How fast is the battery-electric segment expanding?
Battery-electric vehicles are expected to post an 18.07% CAGR, the fastest among all fuel types, driven by a government conversion rebate.
Why are organized dealers gaining ground over unorganized vendors?
Inspection centers, escrow-protected payments, and fintech-enabled credit raise buyer confidence and allow organized channels to grow at 9.78% CAGR.
What policy change most recently affected import supply?
The February 2025 lifting of the three-year import ban reopened channels for 3-to-5-year-old Japanese vehicles, boosting supply and variety.
Page last updated on:


