
Market Overview
| Study Period | 2019 - 2031 |
|---|---|
| Forecast Data Period | 2026 - 2031 |
| Base Year Market Size (2025) | USD 69.73 Billion |
| Market Size (2026) | USD 74.33 Billion |
| Market Size (2031) | USD 102.37 Billion |
| Growth Rate (2026 - 2031) | 6.61 % |
| Market Concentration | Medium |
Major Players *Disclaimer: Major Players sorted in no particular order Image © Mordor Intelligence. Reuse requires attribution under CC BY 4.0. | |
South-East Asia Used Car Market Analysis by Mordor Intelligence
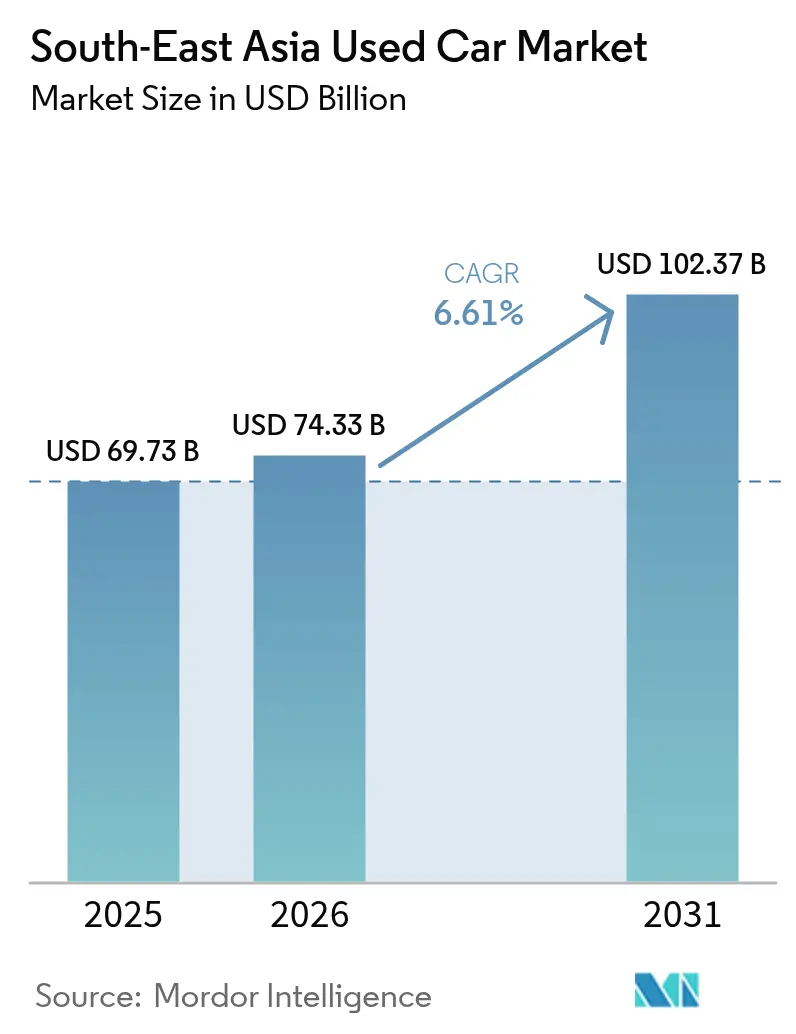
The South-East Asia Used Car Market size is projected to be USD 69.73 billion in 2025, USD 74.33 billion in 2026, and reach USD 102.37 billion by 2031, growing at a CAGR of 6.61% from 2026 to 2031. Scale is shifting toward structured dealers as digital platforms, certified programs, and data-rich financing compress risk and widen consumer choice. Unorganized lots still dominate more than half of transactions because many provincial buyers rely on cash negotiations and verbal guarantees rather than formal credit scoring. Indonesia anchors the regional opportunity in 2025, its low motorization rate suggesting headroom for fintech lenders to test novel datasets for underwriting. Vietnam is the fastest-growing market, as tariff cuts and stronger vehicle-history disclosure attract late-model imports. Sport-utility vehicles, battery-electric units, and 0-to-3-year cars are the quickest movers, while AI-enabled inspections and extended-tenure loans nurture trust and affordability across the Southeast Asian used-car market.
Key Report Takeaways
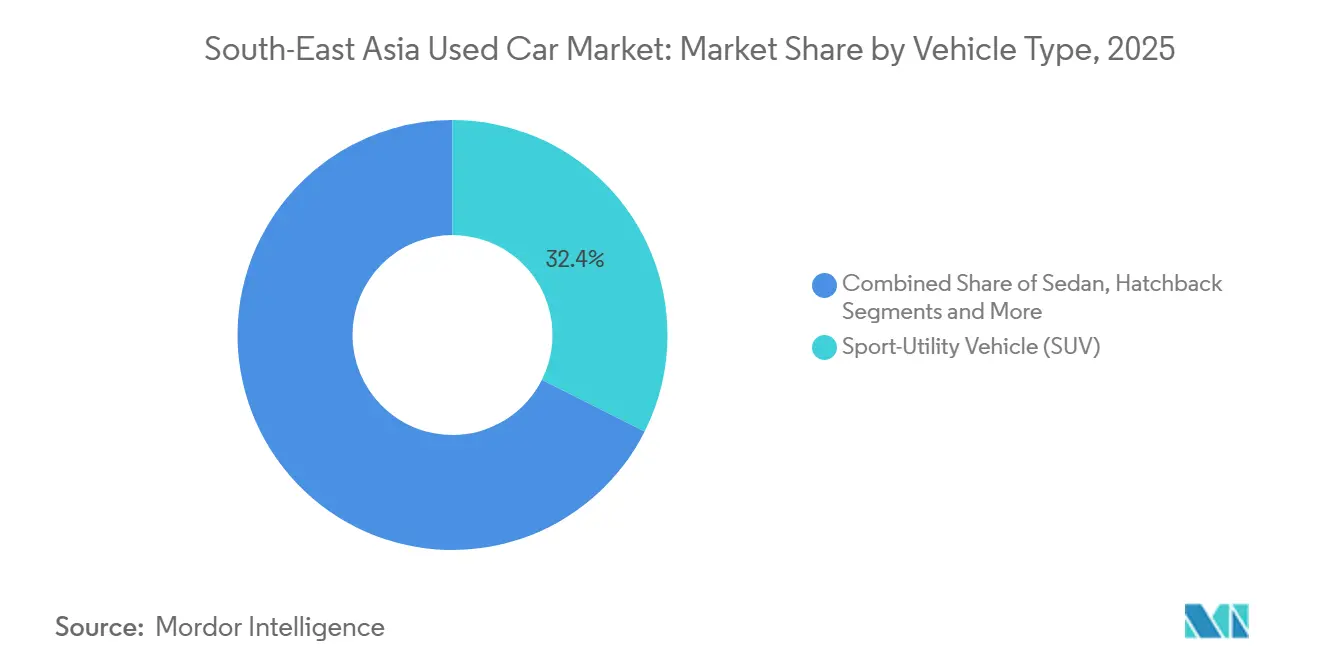
- By vehicle type, sport-utility vehicles held 32.37% of the Southeast Asia used-car market share in 2025 and are advancing at a 6.63% CAGR through 2031.
- By fuel type, gasoline-powered vehicles accounted for 73.36% of market share in 2025, while battery-electric units are projected to grow at a 6.71% CAGR through 2031.
- By vehicle age, the 4-to-6-year bracket led with 38.72% market share in 2025; in contrast, the 0-to-3-year cohort is expanding most quickly, with a 6.78% CAGR by 2031.
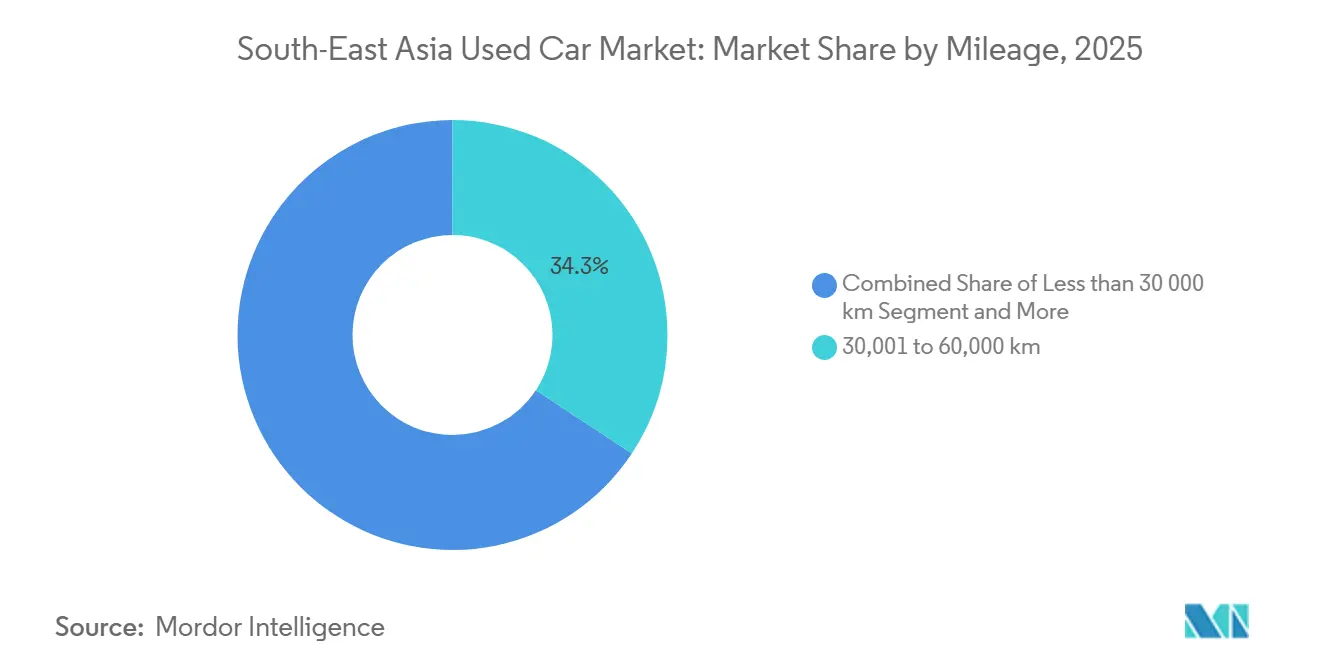
- By mileage, cars showing 30,001-60,000 kilometers held the largest 34.25% market share in 2025, whereas the 60,001-100,000-kilometer band is forecast to grow fastest at 6.81% CAGR by 2031.
- By sales channel, offline dealers still accounted for 61.24% of the Southeast Asia used-car market share in 2025, while online platforms are expanding at a 6.66% CAGR by 2031.
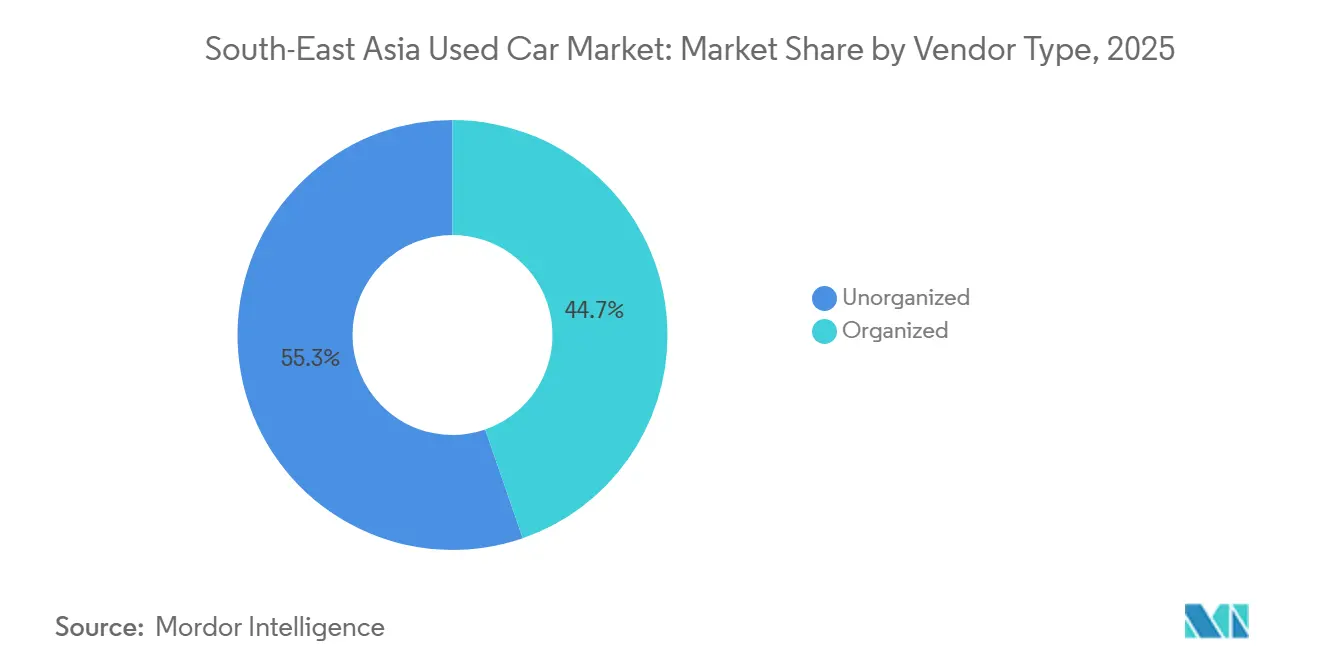
- By vendor type, organized providers captured 44.74% share of the Southeast Asia used-car market in 2025 and led growth at a 6.73% CAGR by 2031, on the back of certified warranties and embedded credit.
- By purchase method, financed transactions accounted for 31.55% of market share in 2025 and are growing at a 6.77% CAGR through 2031 as non-bank lenders lengthen tenures.
- By geography, Indonesia accounted for 28.77% of market share in 2025, while Vietnam recorded the highest projected CAGR at 6.69% through 2031.
Note: Market size and forecast figures in this report are generated using Mordor Intelligence’s proprietary estimation framework, updated with the latest available data and insights as of 2026.
Market Trends and Insights
Drivers Impact Analysis of South-East Asia Used Car Market*
| Driver | (~) % Impact on CAGR Forecast | Geographic Relevance | Impact Timeline |
|---|---|---|---|
| Growth in Organized Dealership Networks and Certified Pre-Owned Programs | +1.5% | Global, strongest in Malaysia, Thailand, Indonesia | Long term (≥ 4 years) |
| Availability of Integrated Financing and Insurance Solutions | +1.4% | Malaysia, Indonesia, Thailand, expanding to Vietnam, Philippines | Medium term (2-4 years) |
| Increasing Turnover of New-Car Sales (Especially SUVs) Feeding Used Supply | +1.3% | Indonesia, Thailand, Philippines, Vietnam | Short term (≤ 2 years) |
| Rising Sales Through Online Channels and Digital Marketplaces | +1.2% | Malaysia, Singapore, urban Indonesia, Thailand | Medium term (2-4 years) |
| Government Circular-Economy and Scrappage Incentives Accelerating Trade-Ins | +0.8% | Thailand, Vietnam, pilot discussions in Indonesia | Long term (≥ 4 years) |
| AI-Driven Inspection/Pricing Platforms Boosting Buyer Trust | +0.5% | Malaysia, Singapore, pilot rollouts in Thailand, Indonesia | Medium term (2-4 years) |
| Source: Mordor Intelligence | |||
Growth in Organized Dealership Networks and Certified Pre-Owned Programs
Toyota U Trust and Honda Certified add one-year warranties and 100-point inspections, commanding premiums that many SUV buyers accept for peace of mind [1]“LIVA Digital Platform Announcement,” Honda Motor Indonesia, honda-indonesia.com . Luxury badges push the envelope: BMW Premium Selection in Singapore offers 24-month coverage and rate discounts through its captive lender, tethering clients to the brand’s lifecycle. Malaysia’s inspection firm Puspakom rolled out AI-aided CAVIS V4 in 2025, giving organized lots an external benchmark to distance themselves from curbside sellers [2]“CAVIS V4 Inspection System Overview,” Puspakom, puspakom.com.my .
Availability of Integrated Financing and Insurance Solutions
Carsome Capital bolstered its standing by curbing non-performing loans. This was achieved by merging borrower cash-flow data with AI-driven vehicle grading, thereby refining credit risk assessments. Such a meticulous strategy won the trust of major banks, including AmBank and Maybank, which offered substantial credit lines and bolstered confidence in Carsome's lending model. In early 2025, JACCS, eyeing the gig-economy segment, acquired a notable minority stake. They tapped into alternative data streams, notably e-wallet transactions, to broaden their reach. Concurrently, Carsome introduced bundled insurance offerings, seamlessly integrating roadside assistance into monthly installments. This move not only alleviated buyer friction but also enriched the customer experience and elevated commission take-rates within Carsome's ecosystem.
Increasing Turnover of New-Car Sales (Especially SUVs) Feeding Used Supply
Southeast Asia's used-car market is increasingly favoring SUVs over sedans, as stronger residual values prompt owners to sell sooner. In Thailand, production has leaned towards pickup-based SUVs, a choice that resonates with both local buyers and export demands, influencing regional supply dynamics. Concurrently, Indonesia sees repossessed compact SUVs bolstering auction inventories, aligning with a notable shift in buyers from new showrooms to budget-friendly used cars. Collectively, these trends underscore the SUV's commanding presence in shaping Southeast Asia's automotive landscape.
Rising Sales Through Online Channels and Digital Marketplaces
Transaction portals are transforming the used-car landscape, offering features such as 360-degree imagery, verified inspection scores, and instant financing. However, the importance of physical test drives in cities outside the top-tier limits the industry's complete digital shift. Carsome, for instance, has shown that by expanding services such as warranties and insurance, platforms can profit beyond vehicle sales, highlighting the benefits of a well-integrated ecosystem. Original Equipment Manufacturers (OEMs), such as Honda Indonesia, are delving into embedded credit workflows, emphasizing their desire to maintain control over customer data. In Southeast Asia's digital auto arena, regional frontrunners like Carro are securing substantial funding for mergers and expansion, signaling a trend of consolidation and heightened competition. The next wave of adoption will depend on the logistics of doorstep test drives, which could reduce dependence on roadside lots and strengthen the blend of online ease with offline trust.
Restraints Impact Analysis of South-East Asia Used Car Market*
| Restraint | (~) % Impact on CAGR Forecast | Geographic Relevance | Impact Timeline |
|---|---|---|---|
| Dominance of Unorganized Dealers and Roadside Lots | -0.9% | Indonesia, Philippines, Vietnam, rural Thailand, Malaysia | Short term (≤ 2 years) |
| Lack of Standardized Vehicle-Condition Reporting Protocols | -0.7% | Global, acute in Vietnam, Philippines, Cambodia, Myanmar | Medium term (2-4 years) |
| Emerging Import Restrictions on Older Used Vehicles | -0.5% | Vietnam, Thailand, Indonesia (under discussion) | Long term (≥ 4 years) |
| Reduced Private-Car Ownership in Urban Areas Due to Mobility-As-A-Service | -0.3% | Singapore, Kuala Lumpur, Jakarta, Bangkok (urban cores) | Long term (≥ 4 years) |
| Source: Mordor Intelligence | |||
Dominance of Unorganized Dealers and Roadside Lots
In Southeast Asia's used car market, cash-based curbside dealers are outpacing certified sellers by offering lower prices and flexible weekly payments, all without the need for formal credit checks. For instance, in Jakarta's Kemayoran market, social trust often takes precedence over digital records, bolstering the presence of these informal dealers. Meanwhile, in Thailand, stricter bank lending has shuttered many small dealerships. Those that remain are turning to repossession auctions for inventory, sidestepping refurbishment costs. Furthermore, the lack of mandatory dealer licensing means that unregulated vendors incur lower compliance costs, giving them a competitive edge over organized dealers bound by stricter regulations.
Lack of Standardized Vehicle-Condition Reporting Protocols
In Southeast Asia's used car market, the lack of an ASEAN-level registry for accident or mileage data hampers transparency. Buyers often rely on visual inspections, which can easily overlook issues such as flood damage or prior taxi use. In Malaysia, while standards address battery health, they fall short for combustion-engine vehicles, prompting platforms to seek third-party verification services to build trust. In contrast, curbside dealers sidestep these expenses. This disparity widens the price gap between organized and informal channels, hindering the shift towards a more formal market, even as consumers clamor for greater reliability and accountability.
*Our forecasts treat driver/restraint impacts as directional, not additive. The impact forecasts reflect baseline growth, mix effects, and variable interactions.
South-East Asia Used Car Market Segment Analysis
By Vehicle Type:
SUVs Anchor Volume and VelocitySUVs represented 32.37% of the 2025 market share and are set to climb at a 6.63% CAGR, the fastest of any body style. The Southeast Asia used-car market for SUVs is projected to reach USD 33.1 billion in 2031, driven by residual values that remain 60-70% of the original price after 3 years. Thailand’s Toyota Fortuner and Indonesia’s Mitsubishi Xpander funnel high-clearance stock into certified lots, while Malaysia’s Proton X70 lifts the mid-range bracket. Sedans lose share as corporate and ride-hailing fleets pivot toward crossovers. Hatchbacks and multipurpose vehicles hold niche appeal in Vietnam and the Philippines, where tight urban lanes favor compact footprints.
Trade-in cycles average 3-5 years for SUVs, compared with 5-7 years for sedans, which injects late-model units that qualify for warranty extensions. New launches such as the BYD Atto 3 will seed the pipeline by 2028, when early adopters re-enter the Southeast Asian used-car market. Certified programs cherry-pick SUVs because reconditioning costs are spread over higher resale values.



By Fuel Type:
Electric Fastest, Gasoline LargestGasoline cars still accounted for 73.36% of the 2025 market share, yet electric vehicles will grow at a 6.71% CAGR through 2031. Malaysia’s battery passport rule reduces buyer discounting of used EVs from the historical 30-40% to 20% by providing state-of-health scores.
Starting from a modest base of under 150 units sold in 2020, electric vehicle (EV) sales have experienced a notable uptick, especially in the first half of 2025. By the second quarter of 2025, quarterly sales had climbed to around 22,000 units; most of these units will enter the Southeast Asian used-car market after 2028. Diesel’s relevance slides as Bangkok and Jakarta introduce low-emission zones. Vietnam’s 2026 tax incentive, pricing hybrids at 70% of the internal-combustion duty, will spur hybrid adoption and expand future supply.
By Vehicle Age:
Newer Cohorts Outpace Older StockIn 2025, the 4-to-6-year age band commanded a dominant 38.72% share. However, it now grapples with pricing pressures. Since 2015, Thailand's used-vehicle index has plummeted by over 30 points, diminishing residual values. On the other hand, the 0-to-3-year segment is on a rapid ascent, boasting a projected CAGR of 6.78%. This growth is bolstered by early SUV upgrades and residual-value guarantees, which promote swifter replacement cycles.
Meanwhile, in both Vietnam and Thailand, imports over a decade old face stringent policy challenges. This has nudged buyers towards younger, certified vehicles, further solidifying the trend towards organized channels in Southeast Asia's used-car arena.
By Mileage:
Mid-Range Band Gains TractionIn 2025, vehicles in the 30,001–60,000 kilometer range are set to dominate the market, capturing a significant 34.25% share. Meanwhile, cars clocking in at 60,001–100,000 kilometers are on track to grow at a robust 6.81% CAGR. This range strikes a balance, being both affordable and eligible for extended financing terms of 60–84 months.
The confidence in this mileage bracket is bolstered by AI-driven odometer verifications from firms like Wisedrive and Mobee, which not only mitigate fraud risks but also enhance buyer trust. On the other end of the spectrum, vehicles surpassing the 150,000-kilometer mark still attract commercial operators eyeing budget-friendly fleet expansions. However, their growth is tempered by escalating maintenance costs and operational challenges.
By Sales Channel:
Online Gains, Offline EnduresIn 2025, the offline segment dominated the market with a 61.24% share, underscoring the significance of tactile assurance for buyers in Indonesia's tier-two cities. Despite the rise of digital platforms, hands-on vehicle interaction remains pivotal in purchasing choices. Meanwhile, doorstep test-drive initiatives in Kuala Lumpur and Singapore are bridging the offline-online divide, nudging consumers towards digital avenues.
Online platforms are on a steady ascent, projected to expand at a 6.66% CAGR through 2031, driven by their convenience and integrated financing options. A testament to this hybrid approach is Honda's LIVA. This OEM portal adeptly merges brand-owned data streams with showroom inventories and smartphone interfaces, bolstering trust and facilitating digital interactions.
By Vendor Type:
Organized Gains, Unorganized AdaptsIn 2025, organized entities captured 44.74% of market activity and are projected to grow at a 6.73% CAGR, with expectations to eclipse the 50% mark by 2029. Their growth is fueled by bundled offerings—warranties, inspections, and financing packages—that bolster buyer confidence and streamline transactions in Southeast Asia's used car market.
Meanwhile, unorganized sellers maintain their relevance by serving customers outside formal payroll systems, providing weekly installment plans, and demanding less stringent documentation. This interplay highlights the growing dominance of structured platforms while underscoring the enduring strength of informal operators.
By Purchase Method:
Financing Overtakes CashFinanced transactions, which accounted for 31.55% of the market in 2025, are projected to grow at a 6.77% CAGR through 2031, thanks to non-bank lenders extending tenures. These financed deals are poised to outpace cash transactions before 2030, signaling a shift in buyer behavior in Southeast Asia's used car market. Non-bank lenders, extending repayment terms to 9 years and using AI-scored collateral, maintain default rates below 2%.
Moreover, by leveraging alternative data from e-wallets and utility bills, they expand access beyond salaried workers, boosting penetration and accelerating the adoption of formal financing.
Geography Analysis
Indonesia South-East Asia Used Car Market
In 2025, Indonesia commanded a 28.77% market share, leading the region in volume. This came on the heels of a 13% sales dip in 2024, which in turn triggered repossessions and increased the supply of late-model vehicles. Fintech lenders, adept at transforming mobile-money histories into credit scores, play a crucial role in tapping into the demand from informal earners.
Vietnam and Thailand South-East Asia Used Car Market
Vietnam is set to enjoy the highest projected CAGR of 6.69% through 2031, fueled by an import-driven surge. Showrooms are bustling with vehicles from European, Thai, and Indonesian manufacturers, thanks to clearer tariff schedules and hybrid tax incentives. Thailand, despite grappling with household debt, is looking to scrap vouchers to refresh its vehicle fleet.
APAC South-East Asia Used Car Market
In 2025, Malaysia's battery-passport regulation gives certified dealers a leg up in the pre-owned EV market. The Philippines, with its fragmented landscape extending beyond Metro Manila, is poised for growth from a modest starting point, hinting at consolidation opportunities. On the other hand, Singapore's high entitlement premiums keep used-car prices elevated, even amid robust consumer demand, thereby curbing the market's overall size.
Regulatory Landscape
Used-car rules across Southeast Asia remain country-specific, with trade agreements shaping cross-border flows more than any single ASEAN-wide regime. In Vietnam, the Ministry of Industry and Trade tightened CPTPP-linked used-car imports through Circular 08/2026/TT-BCT (issued February 25, 2026), reinforcing rules-of-origin compliance and valid certificates of origin under tariff-rate quotas. This was complemented by a March 2, 2026 consolidated framework (11/VBHN-BCT) that standardizes tariff-rate quota auctions, and an April 3, 2026 update (Decree 117/2026/NĐ-CP) that adjusts conditions tied to import and after-sales obligations.
Import permissiveness diverges sharply elsewhere. Thailand continues to apply strict licensing or prohibition for used vehicle imports (with narrow exemptions such as classic vehicles), while Singapore controls the vehicle parc through its Certificate of Entitlement (COE) system, shaping used pricing and turnover. Across markets, customs classification typically follows ASEAN Harmonized Tariff Nomenclature (AHTN), while technical compliance often references Euro 4/5-type emission benchmarks and local inspection and roadworthiness requirements, keeping documentation and testing central to formal used-car transactions.
Value Chain Analysis
The Southeast Asia used-car value chain starts with supply creation from trade-ins, lease and fleet de-fleets, repossessions, and selective imports, then moves through sourcing via auctions and platform procurement, reconditioning, inspection and grading, listing and lead generation, financing and insurance attachment, and finally delivery, registration transfer, and after-sales support. Organized players increasingly combine inspection standards (including third-party inspection firms), refurbishment capacity, and integrated financing to convert uncertain vehicle quality into bankable collateral and faster inventory turns, while unorganized roadside lots compete primarily on cash pricing and informal weekly payments.
Digitization is pulling trade-in data upstream and tightening price discovery. One concrete example is Toyota taking a 40% stake in Astra Digital Mobil in June 2025 for USD 120 million, strengthening its access to Indonesia-focused platforms (OLX/OLXmobbi) and the related inventory and customer-data rails. Cross-border scalability is still constrained by uneven import regimes and logistics capabilities, which keeps local partnerships (dealers, lenders, inspection providers, and vehicle logistics operators) central to throughput and compliance management.
Competitive Landscape
Carsome, Carro, Cars24, OLX Autos, and iCar Asia together handled roughly one quarter of organized transactions in 2025. Carsome bought iCar Asia for over USD 200 million, folded iCar Asia into JACCS as a 49% partner for its finance arm, and secured RM 200 million in bank lines to expand underwriting.
Carro’s pre-IPO fundraise aims at regional acquisitions and an Australian beachhead. Wisedrive supplies inspection tech that reduces refurbishment costs, enabling mid-sized dealers to meet certification standards without in-house data science.
OEMs are circling: Honda’s LIVA integrates inventory and finance rails inside its Indonesia network to capture trade-ins before they leak to third-party sites. Market rivalry therefore splits between data-rich platforms and price-led micro-dealers; the former expand trust infrastructure, the latter trade flexibility for compliance.
South-East Asia Used Car Industry Leaders
Carro
Cars24 Services Private Limited
Oto
Carmudi
Carsome
- *Disclaimer: Major Players sorted in no particular order

South-East Asia Used Car Market Companies Covered in this Report
- Carro
- Carsome
- Cars24 Services Pvt Ltd
- Carousell
- OLX
- iCar Asia (Carlist.my)
- myTukar
- BeliMobilGue.co.id
- Carmudi
- Oto.com
- Automart PH
- Mercedes-Benz Certified
- Toyota U Trust
- Honda Certified Pre-Owned
- BMW Premium Selection
- Nissan Intelligent Choice
- Hyundai Promise
- Mitsubishi Diamond Certified
- Isuzu Used Car Program
- LausAutoGroup (Carmix)

Market Opportunities and Future Outlook
A large, actionable whitespace is forming around trust infrastructure and compliance-led transparency, given the absence of an ASEAN-level accident or mileage registry and uneven adoption of standardized condition reporting. That gap supports scalable third-party inspection scoring, real-time lien and tax-status verification, and OEM-linked certified programs (including Toyota U Trust, Honda Certified, and BMW Premium Selection) that attach warranties and financing to reduce buyer risk and broaden acceptance of online-first journeys.
Investment is also concentrating around platform consolidation and capacity build-out. In March 2026, CARSOME announced a strategic fundraising round of over USD 30 million to accelerate regional growth and AI and data applications. In June 2026, it expanded physical capacity in Greater Jakarta through four new locations that raised inspection throughput to 2,500 units per month. Cross-border capability building is advancing as well, illustrated by Carro moving into Australia through its acquisition of CarPlace (June 2026), which supports broader sourcing and resale pathways for late-model inventory across Asia-Pacific.
Recent Industry Developments in South-East Asia Used Car Market
- June 2026: CARSOME Indonesia opened four new locations across Greater Jakarta, expanding its physical footprint for retailing and ecosystem services. The added sites lifted inspection capacity to about 2,500 vehicles per month and broadened inventory access beyond core urban nodes, supporting faster turnarounds for omnichannel sales.
- September 2025: Carro outlined an acquisition-led expansion agenda and an Australia foray ahead of a potential dual listing, signaling a push to scale beyond its core Southeast Asia base. The move highlighted cross-border supply and demand matching as a competitive lever for large marketplaces, especially for late-model inventory.
- April 2024: Hyundai Capital announced plans to rebrand its subsidiary and commence full-scale operations in Indonesia by April 2025, in collaboration with Sinar Mas and Bank Shinhan Indonesia. The build-out strengthened captive and partner financing availability, which is pivotal for improving used-car affordability and increasing financed transaction penetration.


South-East Asia Used Car Market Report Scope and Research Methodology
Market Definition and Coverage
For this methodology, the market covers the resale of passenger cars that have had at least one prior owner across Southeast Asia, measured in transaction value (USD) over the study period.
Scope exclusions: We exclude new car first registrations and do not count revenue from financing, insurance, aftersales service, or parts bundled around a used car transaction.
Segments Covered in This Report
- By Vehicle Type
- Hatchback
- Sedan
- Sport-Utility Vehicle (SUV)
- Multi-Purpose Vehicle (MPV)
- By Fuel Type
- Gasoline
- Diesel
- Electric
- Alternative Fuels (LPG/CNG/Hybrid)
- By Vehicle Age
- 0 to 3 Years
- 4 to 6 Years
- 7 to 10 Years
- More than 10 Years
- By Mileage
- Less than 30 000 km
- 30 001 to 60 000 km
- 60 001 to 100 000 km
- More than 100 000 km
- By Sales Channel
- Online
- Offline
- By Vendor Type
- Organized
- Unorganized
- By Purchase Method
- Outright Purchase
- Financed Purchase
- Captive Financing
- Bank Financing
- Non-Banking Financial Companies (NBFC)
- By Country
- Indonesia
- Thailand
- Vietnam
- Malaysia
- Philippines
- Singapore
- Other Countries (Cambodia, Laos, Myanmar, Brunei)
Data Sources, Market Sizing, and Validation
Desk Research
Desk research was used to map the size of the addressable used car pool and to set guardrails for country-level assumptions. Public sources were checked for the demand backdrop and vehicle ownership trends, including information from national transport and registration agencies in Indonesia, Thailand, Malaysia, Vietnam, and the Philippines, along with ASEAN trade publications and statistics releases.
To align the market with observed transaction behavior, we also referred to sources such as national statistics offices, central bank consumer credit releases, customs and trade datasets that signal vehicle flows, and road safety and emissions policy notes that influence scrappage and replacement cycles. Annual reports and investor presentations from larger dealer groups and marketplace operators were reviewed to understand typical take rates, channel mix, and pricing bands. Where needed, paid subscriptions for company financials and intelligence, news and financials, and shipment-level import and export data were used to cross-check outliers and fill missing time series. The above list is illustrative, and many other public sources were also used for data collection, validation, and clarification.
Primary Interviews and Surveys
Primary work focused on validating how used car prices and volumes move by country, and how activity splits across organized dealers, smaller lots, and person-to-person transfers. We spoke with dealer operators, online marketplace and inspection ecosystem participants, lenders, and local auto stakeholders across the region, which helped confirm assumptions on channel shift, stock turnover, and typical discounting during weak demand periods.
Distribution of primary research fieldwork respondents
| Company type | Respondent position |
|---|---|
| Top tier: 25% | CXOs: 12% |
| Mid tier: 61% | Functional/Unit leaders: 33% |
| Smaller Players: 14% | Managers: 55% |
Market-Sizing & Forecasting
The core model uses a top-down build where the regional used car value is reconstructed from each country's active vehicle parc, annual turnover behavior, and price levels that match observed income and credit conditions. Those country totals are then checked against selective bottom-up approximations, including dealer revenue roll-ups where available, sampled listing-to-transaction conversion checks, and average selling price times estimated units for major channels, so the final number is not driven by one angle alone.
Inputs that were treated as key fingerprints include used-to-new substitution patterns, average vehicle age and scrappage pressure, penetration of organized and online channels, consumer credit availability and loan tenure, and shifts in fuel mix that change demand for newer used vehicles. When a variable was weak in one country, proxies were used (for example, linking turnover rates to registration activity and credit growth), and then tightened through interview feedback.
For forecasting, scenario analysis was used with a base case that ties growth to macro drivers and channel formalization, and then stress-tested for interest rate swings, policy changes, and supply shocks from new car sales cycles. The forward curve for prices and volumes was reviewed with primary inputs to keep the path realistic for each major market in the region.
Data Validation & Update Cycle
Outputs are validated through stepwise cross-checks, where totals must align with independent signals such as vehicle ownership direction, financing availability, and reported dealer throughput. Variance checks are run across countries to catch unusual swings in prices, turnover, or channel shares, and any abnormal result is reviewed and corrected with a documented assumption update.
Before sign-off, a second analyst reviews the logic, the math, and the key assumptions, and follow-up calls are triggered when a country estimate moves beyond expected ranges. Reports are refreshed annually, and interim updates are made when material events occur, such as regulatory shifts or sharp credit tightening. Right before delivery, a final pass is completed so clients receive the latest updated view.
Mordor Intelligence's South East Asia Used Car Market Estimate Compared With Other Published Estimates
Published market sizes for used cars in Southeast Asia can vary widely because the scope boundary is easy to stretch, and because price and volume assumptions can shift quickly in this category. Differences usually come from what is counted as a transaction, how the region and country coverage is handled, and whether values are built from units and prices or from a smaller sample that is then scaled.
By tracking transaction value drivers such as vehicle parc turnover, country-level price progression, and channel mix refreshes, Mordor Intelligence keeps the estimate anchored to used car sales value only, rather than blending in finance or aftersales revenues that inflate totals.
Benchmark comparison
| Source | Market Size | Gaps in Research Methodology |
|---|---|---|
| Mordor Intelligence | USD 69.73 B (2025) | |
| Trade Journal A | USD 32.38 B (2024) | Typically reflects a narrower captured set of transactions, often leaning on organized or online activity signals, which can miss informal and offline transfers that are still common across several SEA countries. |
| Global Consultancy B | USD 77.95 B (2026) | Uses a different starting year and can apply a faster price ramp or higher turnover assumption across all countries, which may overstate near-term value if credit conditions and supply cycles are uneven by market. |
The comparison shows that the spread is mainly explained by transaction capture and by how pricing and turnover are carried forward year to year. Our method stays traceable because each country total is linked to a small set of observable inputs, and then checked through interviews and channel-level reality checks before being rolled up to the regional number.


Key Questions Answered in the Report
How large is the Southeast Asia used car market in value terms for 2026?
The Southeast Asia used car market size is estimated at USD 74.33 billion in 2026, on track toward USD 102.37 billion by 2031.
Which body style leads transactions across the region?
Sport-utility vehicles captured 32.37% of the 2025 volume and are the fastest-growing body style at a 6.63% CAGR.
Why is Vietnam growing faster than its neighbors in used-car sales?
Lower tariffs under the EU-Vietnam trade pact and a sharp rise in certified imports lift Vietnam’s forecast CAGR to 6.69% through 2031.
What share of deals are completed online versus offline?
Offline dealerships still held 61.24% of 2025 transactions, though online channels are growing 6.66% annually as inspection and delivery logistics improve.
How are financing trends reshaping buyer behavior?
Financed purchases are expanding 6.77% CAGR, driven by non-bank lenders offering 108-month tenures and AI-based underwriting that keeps defaults below 2%.
What impact could Thailand’s proposed scrappage scheme have?
Incentives for retiring cars older than 10 years would rotate older stock out faster and channel buyers toward late-model certified units.
Page last updated on:


 Your data is secure and never sold or shared.


