Market Overview
| Study Period | 2019 - 2031 |
|---|---|
| Forecast Data Period | 2026 - 2031 |
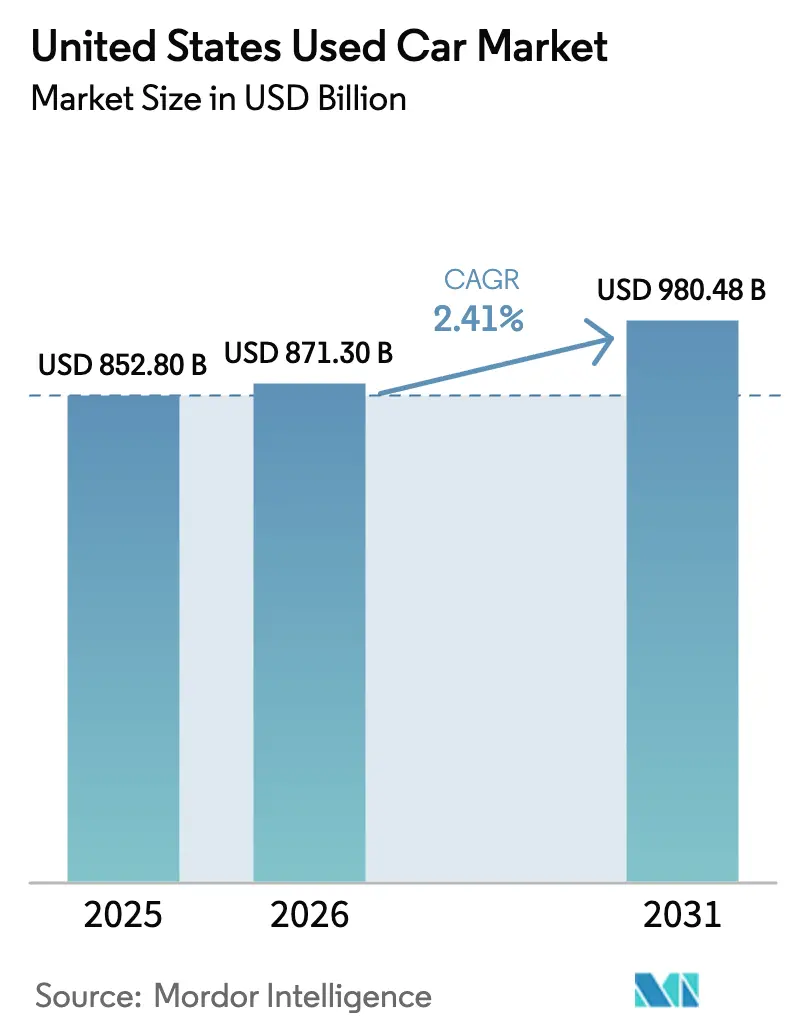
| Base Year Market Size (2025) | USD 852.80 Billion |
| Market Size (2026) | USD 871.30 Billion |
| Market Size (2031) | USD 980.48 Billion |
| Growth Rate (2026 - 2031) | 2.41% CAGR |
| Market Concentration | Low |
Major Players *Disclaimer: Major Players sorted in no particular order Image © Mordor Intelligence. Reuse requires attribution under CC BY 4.0. | |
United States Used Car Market Analysis by Mordor Intelligence
The United States used car market size was valued at USD 852.80 billion in 2025 and estimated to grow from USD 871.30 billion in 2026 to reach USD 980.48 billion by 2031, at a CAGR of 2.41% during the forecast period (2026-2031). Organized dealer groups are widening their lead through AI-driven pricing engines, same-day home delivery, and omnichannel storefronts, while independent lots struggle with thinner margins and slower inventory turns. Battery-electric models, although still a small slice of volume, are advancing quickly as falling resale prices and rising gasoline costs reshape shopper math. Dealers also face an affordability squeeze: used-vehicle loan rates climbed above 16% in late 2025, pushing many buyers toward certified pre-owned (CPO) programs that stretch warranty coverage on older vehicles. Regional growth remains uneven, with Texas, Florida, and North Carolina outpacing mature Northeastern states as population migration patterns shift demand corridors.
Key Report Takeaways
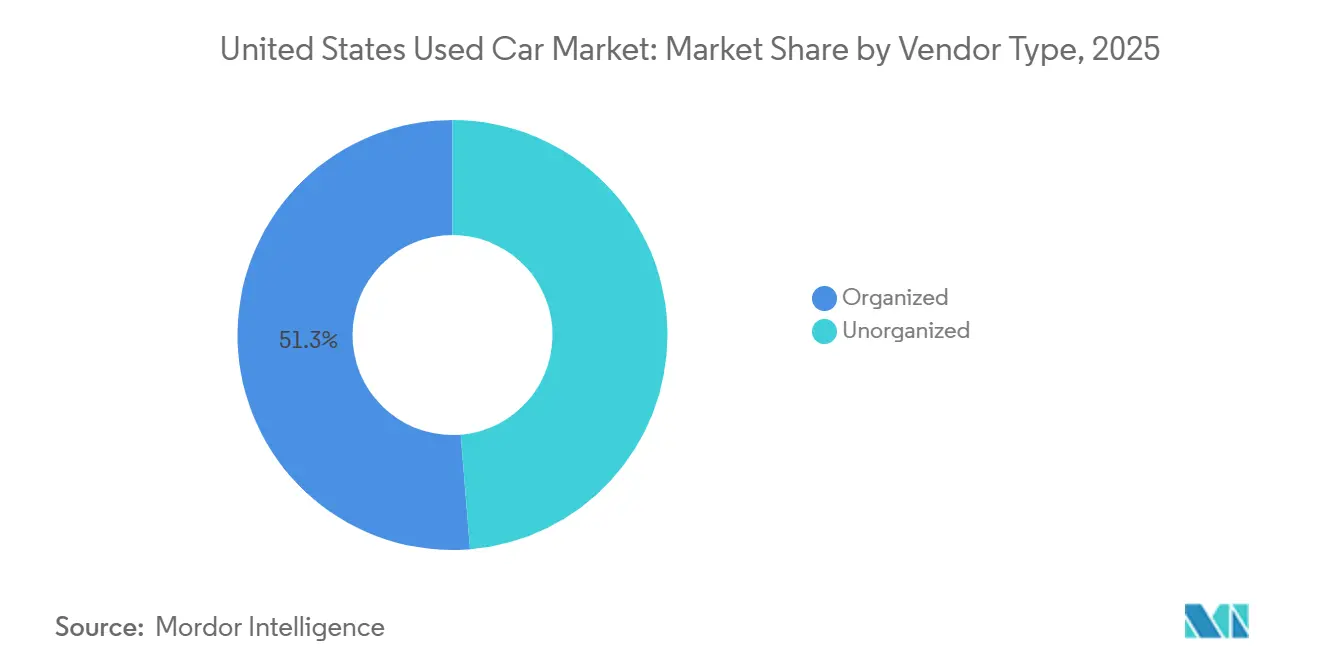
- By vendor type, organized dealers held 51.27% of the United States used car market share in 2025 and are expanding at a 7.41% CAGR through 2031.
- By fuel type, gasoline retained the largest 84.28% revenue share in 2025, while battery-electric vehicles recorded the fastest 7.78% CAGR from 2026 to 2031.
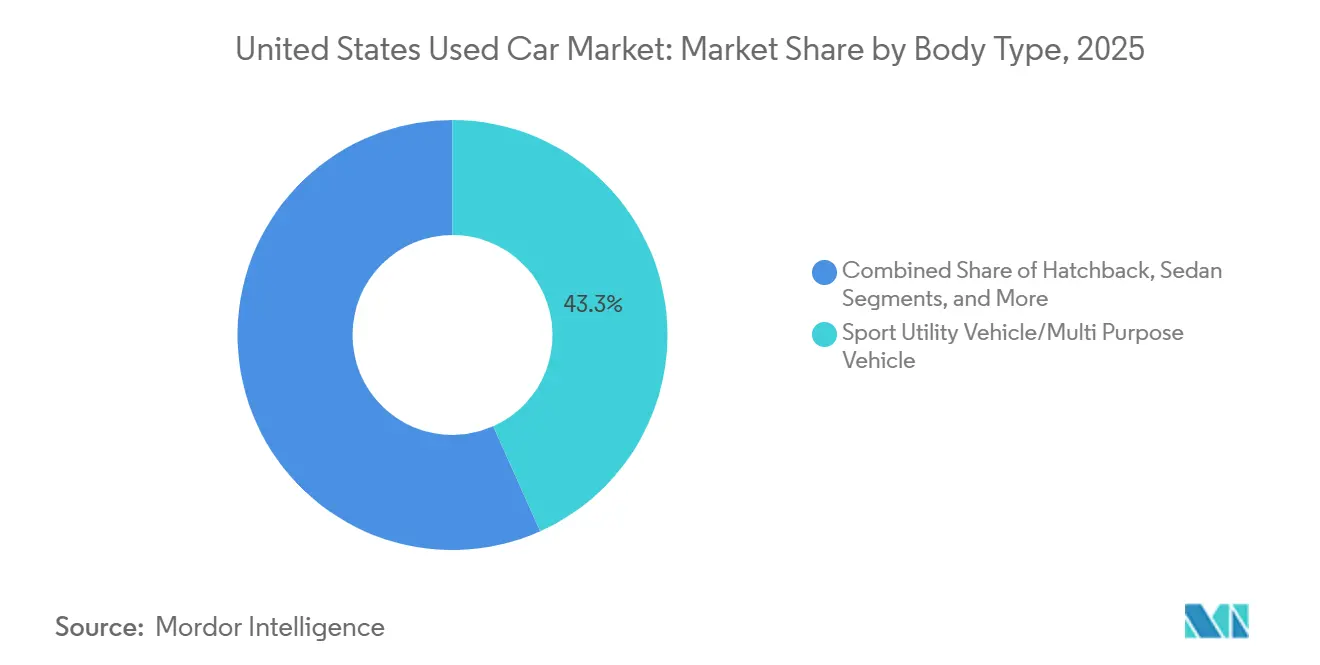
- By body type, sport utility vehicles (SUVs) and crossovers captured 43.27% of the United States used car market size in 2025 and are growing at a 7.25% CAGR to 2031.
- By sales channel, the offline segment captured 66.51% of total volume, while online transactions are poised to grow at a 7.19% CAGR through 2031.
- By state, California led with a 24.17% revenue share in 2025; Texas is the fastest-growing state at a 7.34% CAGR through 2031.
Note: Market size and forecast figures in this report are generated using Mordor Intelligence’s proprietary estimation framework, updated with the latest available data and insights as of January 2026.
United States Used Car Market Trends and Insights
Drivers Impact Analysis*
| Driver | (~) % Impact on CAGR Forecast | Geographic Relevance | Impact Timeline |
|---|---|---|---|
| Rising New-Vehicle Prices | +0.7% | National, with strongest impact in California, Texas, Florida | Medium term (2-4 years) |
| Expansion of Certified Pre-Owned (CPO) Programs | +0.6% | National, concentrated in organized dealer networks | Long term (≥ 4 years) |
| IRA USD 4k Used-EV Credit Energizing Secondary EV Demand | +0.5% | National, early adoption in California, Washington, New York | Short term (≤ 2 years) |
| OEM Subscription-to-Resale Loops Boosting Late-Model Supply | +0.3% | National, pilot markets in major metropolitan areas | Long term (≥ 4 years) |
| AI-Driven Dynamic-Pricing Engines Lifting Dealer Profitability | +0.2% | National, faster adoption in organized dealer networks | Medium term (2-4 years) |
| Dealer-Built Home-Delivery Logistics | +0.1% | National, concentrated in urban and suburban markets | Medium term (2-4 years) |
| Source: Mordor Intelligence | |||
Rising New-Vehicle Prices Driving Value-Seeking Buyers
Average new-car transaction prices reached USD 48,841 in July 2025, yet the typical monthly payment now runs above USD 700, steering many first-time purchasers into the United States used car market. Loan balances on used cars averaged USD 26,795 in mid-2025, giving value-oriented shoppers a viable substitute when credit is tight. The affordability gap is widest in California, New York, and Illinois, where housing costs magnify the burden of a new-car payment. Dealers report that buyers who once considered entry-level new sedans are shifting toward three-year-old crossovers, lifting demand for late-model inventory. Pricing parity is unlikely before 2027 because automakers continue prioritizing profitable trucks and sport utility vehicles (SUVs). AutoNation’s Q4 2024 disclosure showed used-vehicle gross profit up 14%, proving that disciplined sourcing and reconditioning sustain margin even when transactions slow.[1]AutoNation Inc., “Q4 2024 Form 10-K,” autonation.com.
Expansion of Certified Pre-Owned Programs
OEM-backed CPO inventory now covers a broader range of models after Toyota achieved 80% dealer participation and observed that 40% of CPO customers transition into a new Toyota within four years.[2]Toyota Motor Sales USA, “Toyota Certified Used Vehicle Program,” toyota.com. Dealers that invest in on-site reconditioning reap higher front-end gross and future new-car conversions, creating a virtuous margin loop. Cox Automotive noted that certified pre-owned sales outpaced overall used volume in 2024, confirming strong buyer willingness to pay for warranty peace of mind.[3]Cox Automotive, “CPO Market Insights 2024,” coxautoinc.com. Acura’s Precision Used initiative and similar offerings from mainstream brands generate warranty-linked service revenue and strengthen dealer profit streams. Manufacturer marketing support and lower floor-plan rates provide franchise stores with cost advantages that independents cannot match. As warranty coverage stretches, buyers see less risk in older vehicles, sustaining volume despite higher interest charges.
IRA USD 4,000 Used-EV Credit Energizing Secondary EV Demand
The Inflation Reduction Act introduced a USD 4,000 credit for qualifying used electric vehicles at or below USD 25,000, triggering more than 15,000 point-of-sale transfers by May 2024. Recurrent Auto data shows used-EV prices fell 25% year-over-year in 2024, placing many models squarely within the credit’s cap. Although Congress repealed the incentive effective October 2025, dealers are discounting pre-cutoff inventory to sustain momentum. Hertz’s 20,000-unit EV fleet sale in January 2024 further boosted supply and familiarized budget shoppers with plug-in ownership. Even without the credit, lower fuel and maintenance outlays keep total cost of ownership favorable.
OEM Subscription-to-Resale Loops Boosting Late-Model Supply
Automakers are piloting subscription programs that rotate vehicles back to dealers after short terms, adding low-mileage inventory aged under two years. Volkswagen’s VW Flex in Atlanta exemplifies the model, creating predictable supply streams and commanding premium resale prices. Dealers using software platforms such as Loopit report faster turns because subscription cars carry full service history and require minimal reconditioning. The loop reduces residual-value risk for captives by selling units at market rates instead of absorbing lease-end write-downs. Urban centers with younger, high-mobility populations stand to benefit first.
Restraints Impact Analysis*
| Restraint | (~) % Impact on CAGR Forecast | Geographic Relevance | Impact Timeline |
|---|---|---|---|
| Higher Interest-Rate Environment | -0.7% | National, disproportionate impact in lower-income markets | Short term (≤ 2 years) |
| Post-Pandemic Shortage | -0.4% | National, concentrated in premium vehicle segments | Medium term (2-4 years) |
| Normalizing Wholesale Auction Prices | -0.3% | National, affecting all dealer acquisition channels | Short term (≤ 2 years) |
| State “Right-to-Repair” Data Rules | -0.1% | National, with state-by-state implementation variations | Medium term (2-4 years) |
| Source: Mordor Intelligence | |||
Higher Interest-Rate Environment Suppressing Affordability
In Q3 2025, the average used‑vehicle monthly loan payment in the United States was approximately USD 538, according to the data released by TransUnion, reflecting higher borrowing costs amid rising interest rates. Delinquency rates for auto loans (60+ days past due) were around 1.45%, slightly higher than the previous year, showing moderate credit performance pressure. Subprime borrowers faced higher interest rates than prime borrowers, contributing to affordability challenges. Lenders generally maintained tighter credit standards, requiring larger down payments and lower loan-to-value ratios. With the Federal Reserve keeping policy rates elevated, borrowing costs are expected to remain high into 2026, limiting relief for consumers.
Post-Pandemic Shortage of 0–4-Year Lease Returns
In 2024, the United States saw an off-lease vehicle supply of around 2.8 million units, a significant drop from roughly 4.4 million units in 2019. This decline underscores the repercussions of production disruptions experienced during 2020–2021. Lease penetration in the United States dipped from about 30% of new-vehicle sales in 2019 to 22% in 2024. This shift has curtailed the availability of late-model, high-margin used vehicles, which typically sell quickly on dealer lots. To bolster their inventory, dealers have turned more to rental fleet vehicles and direct trades from consumers. However, these alternatives tend to be older and often demand extensive reconditioning. Given the ongoing recovery in new-vehicle production and leasing activities, experts predict that the off-lease supply won't rebound to pre-pandemic figures until the latter half of the decade.
*Our forecasts treat driver/restraint impacts as directional, not additive. The impact forecasts reflect baseline growth, mix effects, and variable interactions.
Segment Analysis
By Vendor Type: Organized Dealers Extend Lead Over Independents
Organized dealers controlled 51.27% of the United States used car market share in 2025 and are set to grow at a 7.41% CAGR through 2031 as scale allows bulk buying and rapid tech deployment. PriceVantage improved inventory turns fivefold for early adopters, illustrating data-driven gains. Lithia Motors retailed 84,251 used units in Q3 2024 and lifted gross per unit to USD 2,115. Franchise groups amortize software costs across many rooftops and benefit from lower floor-plan interest rates. Independents, still handling 48.73% of volume, face margin compression as online transparency narrows pricing latitude. Many must rely on buy-here-pay-here financing that carries higher default risk, limiting capital for digital upgrades.
Consolidation continues: AutoNation, Penske, and Sonic each added multiple rooftops in 2024, and private equity remains active. Large groups attach Finance and Insurance (F&I) products to 75-80% of transactions, boosting per-unit profit by USD 1,500-2,000. Independents manage closer to 50%, widening the earnings gap. With thin margins and rising recon costs, small lots increasingly sell or partner with larger networks that can extend technology and logistics infrastructure.


By Fuel Type: Battery-Electric Momentum Outpaces Combustion Legacy
Gasoline vehicles still represented 84.28% of the United States used car market size in 2025, yet battery-electric units are growing at a 7.78% CAGR to 2031. Recurrent Auto recorded a 25% decline in used-EV prices during 2024, placing many models in the USD 25,000–28,000 range. The Treasury logged 15,000 used-EV credit transactions by May 2024 before the incentive’s repeal. Hertz’s early-2024 liquidation of 20,000 EVs widened supply and normalized resale talk tracks. Although the credit ended, lower energy and maintenance costs sustain interest, particularly in coastal metros with mature charging networks.
Hybrid demand grows modestly as buyers seek efficiency without range anxiety, while diesel share erodes under tighter emissions rules. Tesla Model 3 depreciation narrowed against gasoline peers in 2024, signaling stabilizing residuals that encourage secondary buyers. Dealers market lifetime fuel-savings calculators to offset higher financing rates, and manufacturers’ eight-year battery warranties assuage durability concerns. Externalities such as state zero-emission vehicle mandates will keep the electric share trending upward.
By Body Type: SUV and Crossover Supremacy Shows No Signs of Slowing
Sport utility vehicles/multi-purpose vehicles (SUVs/MPVs) captured 43.27% of transactions in 2025 and are expanding at a 7.25% CAGR, far exceeding sedans’ stagnant trajectory. Compact SUVs like the Honda CR-V and Toyota RAV4 retail at 10–15% premiums over same-age sedans. Automakers phased out several passenger-car nameplates, constraining sedan supply and pushing shoppers into light trucks. Pickups retain strong residuals, aided by contractor and small-business demand; a three-year-old Ford F-150 can keep 60–65% of its original value.
Hatchbacks hold niche appeal in urban cores but face share loss as subcompact crossovers offer similar economy with higher seating positions. Vans, led by Ford Transit and Ram ProMaster, benefit from last-mile delivery expansion and turn faster than passenger vehicles. Body-type preferences appear durable through 2031, given family utility priorities and original equipment manufacturer investment bias toward trucks and crossovers.
By Sales Channel: Online Grows Fast, Hybrid Becomes Norm
Offline venues accounted for 66.51% of 2025 sales, while online channels are growing at a rate of 7.19% annually. Carvana sold 108,651 retail units in Q3 2024, a 34% year-over-year increase, with a gross profit per vehicle of USD 7,427 after integrating ADESA sites. CarMax saw comparable-store unit sales decline 6.3% in fiscal Q2 2025, despite 30% of deals involving digital steps, highlighting competitive pressure. Pure-play online firms Vroom and Shift exited in 2023, illustrating that customers still want physical inspection options.
Franchise dealers now layer digital financing and at-home document signing over showroom experiences, creating an omnichannel baseline. Independent lots struggle to finance transport and titling tech required for statewide delivery. Younger buyers show the highest online preference, suggesting continued share gains. Trade-in convenience and same-day possession, however, remain offline strengths.
Geography Analysis
California’s 24.17% share owes to population scale and aggressive clean-air mandates that accelerate fleet refresh. Advanced Clean Cars II requires 35% zero-emission penetration by 2026, prompting a rush of gasoline trade-ins that could depress residuals in the short term. Dealers in Los Angeles and the Bay Area note sport utility vehicles turn 20–30% faster than sedans. Texas, with a 7.34% forecast CAGR, benefits from lighter regulations and population inflows; its dealers comfortably retail higher-mileage pickups that would struggle in emissions-strict regions.
Florida captures buyers drawn by tax advantages and year-round tourism employment. Tampa and Orlando show strong demand for sport utility vehicles suited to family travel and towing. North Carolina’s Research Triangle supports late-model sales through tech and pharmaceutical hiring. New York and Illinois lag because of outbound migration and higher tax burdens that limit disposable income.
Pennsylvania and Ohio face Rust Belt constraints, yet Georgia leverages Atlanta’s logistics industry to sustain mid-single-digit growth. Washington State leverages high-tech wages and a favorable tax structure to seed electric vehicle demand. The rest of the United States grows more slowly due to sparse population and limited logistics coverage. Price disparities persist: a three-year-old Honda CR-V commands USD 28,000–30,000 in coastal metros but USD 25,000–27,000 in Texas, reflecting different demand pressures and compliance costs.
Competitive Landscape
Used-vehicle retailing remains fragmented; no firm exceeds 3% of national volume, but consolidation is quickening. Lithia Motors, AutoNation, and Penske each added rooftops in 2024, using scale to bargain for better wholesale pricing and spread technology costs. Regulatory compliance, particularly state right-to-repair legislation in Massachusetts, Maine, and New York, is raising barriers to entry for smaller dealers who lack the capital to invest in diagnostic tools and data-access systems, further concentrating market share among organized vendors.
ACV Auctions’ 1-million-vehicle digital wholesale throughput in 2024 trimmed buy costs and travel time for smaller stores, undercutting traditional auction fees. Technology distinguishes winners: AI pricing, logistics optimization, and remote F&I close rates confer margin gains that independents find hard to match. State right-to-repair mandates raise capital requirements for compliance, nudging smaller dealers toward sale or closure. Private equity continues to finance roll-up strategies, expecting synergies in software, data, and financing.
White-space opportunities exist in rural markets underserved by large dealer groups, in commercial-fleet remarketing where vehicles are sold directly to small businesses, and in subscription-to-resale loops that generate younger inventory with comprehensive service records.
United States Used Car Industry Leaders
CarMax, Inc.
CarBravo
Carvana Co.
AutoNation Inc.
Sonic Automotive Inc.
- *Disclaimer: Major Players sorted in no particular order


Recent Industry Developments
- April 2025: AutoNation acquired Groove Ford and Groove Mazda in Colorado, adding USD 219 million in annual revenue and lifting its state footprint to 22 dealerships.
- March 2025: Carvana purchased a Stellantis franchise, granting direct CPO rights and closed-auction access to diversify inventory pipelines.
- February 2025: ADESA expanded its AI-enhanced wholesale platform, ADESA Clear, offering richer condition reports and adaptive price guidance to dealer clients.


Research Methodology Framework and Report Scope
Market Definitions and Key Coverage
Our study defines the United States used-car market as the yearly transaction value generated when passenger cars with at least one prior registered owner are resold through franchised and independent dealers, rental and lease-return outlets, wholesale auctions, and verified online platforms. Light vans under 3.5 tons are included where they move through the same channels.
Scope exclusion: Salvage write-offs, parts-only sales, and gray-import units are left out.
Segmentation Overview
- By Vendor Type
- Organized
- Unorganized
- By Fuel Type
- Gasoline
- Diesel
- Hybrid
- Battery-Electric
- By Body Type
- Hatchback
- Sedan
- Sport Utility Vehicle (SUV)/Multi-Purpose Vehicle (MPV)
- Pickup and Van
- By Sales Channel
- Offline
- Online
- By State
- California
- Texas
- Florida
- New York
- Illinois
- Pennsylvania
- Ohio
- Georgia
- North Carolina
- Washington
- Rest of United States
Detailed Research Methodology and Data Validation
Primary Research
Structured interviews with dealership principals, auction managers, sub-prime lenders, and digital-platform leads across the Midwest, Sun Belt, and coastal states helped us validate lease-return volumes, reconditioning costs, and online conversion ratios, letting us fine-tune key assumptions.
Desk Research
We began by aligning vehicle stock and turnover using U.S. Bureau of Transportation Statistics fleets, Federal Reserve used-vehicle price indexes, and National Automobile Dealers Association unit registers. Our team then layered in EPA fleet-age data, Customs records of imported pre-owned vehicles, and IRS registration files to refine demand pools. To profile dealer economics, Mordor analysts pulled revenue snapshots from D&B Hoovers and Dow Jones Factiva. These references illustrate the breadth of open data consulted; many additional sources were reviewed to confirm patterns and fill gaps.
Market-Sizing and Forecasting
A top-down build starts with vehicles in operation, expected scrappage, and new-car replacement, which are then paired with median transaction prices to land the 2024 baseline. Select bottom-up checks, dealer roll-ups, auction throughput, and sampled ASP times units test and adjust totals. Core variables modeled include average vehicle age, Manheim price-index shifts, consumer credit cost, lease-expiry cohorts, and online sales penetration. Multivariate regression projects each driver, while scenario analysis frames 2025 to 2030 outcomes.
Data Validation and Update Cycle
Outputs flow through a three-tier analyst review; variance flags trigger rapid re-contact with sources. We refresh every twelve months and push interim updates when major economic or regulatory jolts appear.
Why Mordor's US Used Car Baseline Commands Reliability
Published figures often diverge because firms choose different scopes, price definitions, and refresh rhythms.
According to Mordor Intelligence, our disciplined use of full transaction value, inclusion of light vans, and annual expert touchpoints yields the most decision-ready number. Key gap drivers for other publishers include focus on dealer revenue only, exclusion of gray-market imports, static ASP assumptions, and longer update cycles.
Benchmark comparison
| Market Size | Anonymized source | Primary gap driver |
|---|---|---|
| USD 1.05 trillion, 2025 | Mordor Intelligence | - |
| USD 393.8 billion, 2024 | Global Consultancy A | Dealer revenue only; vans omitted |
| USD 257.4 billion, 2025 | Global Consultancy B | Retail revenue; static ASP |
| USD 2.01 trillion, 2025 (global) | Industry Association C | Global scope, not US-only |
These comparisons show that Mordor's transparent scope, variable mapping, and regular recalibration give decision-makers a balanced, reproducible baseline they can trust.


Key Questions Answered in the Report
What factors are driving rapid growth of battery-electric models?
Price declines, wider charging coverage, and early exposure from rental fleet disposals are propelling used EV demand, even after the federal tax credit repeal.
Why are organized dealer groups gaining share?
Scale enables these groups to deploy AI pricing, nationwide delivery, and omnichannel financing, which improve inventory turns and customer reach.
Which states show the fastest growth trajectories?
Texas, Florida, and North Carolina lead growth due to population inflows, lower fees, and lighter emissions rules.
How are high interest rates affecting the market?
Rates above 16% have raised average monthly payments past USD 500, pushing many shoppers toward certified pre-owned vehicles with longer warranty coverage.
What is the outlook for online used-car sales?
Online channels are rising at a 7.19% CAGR as home delivery, digital paperwork, and virtual financing become standard parts of the shopping journey.
Page last updated on:


