Market Overview
| Study Period | 2020 - 2031 |
|---|---|
| Forecast Data Period | 2026 - 2031 |
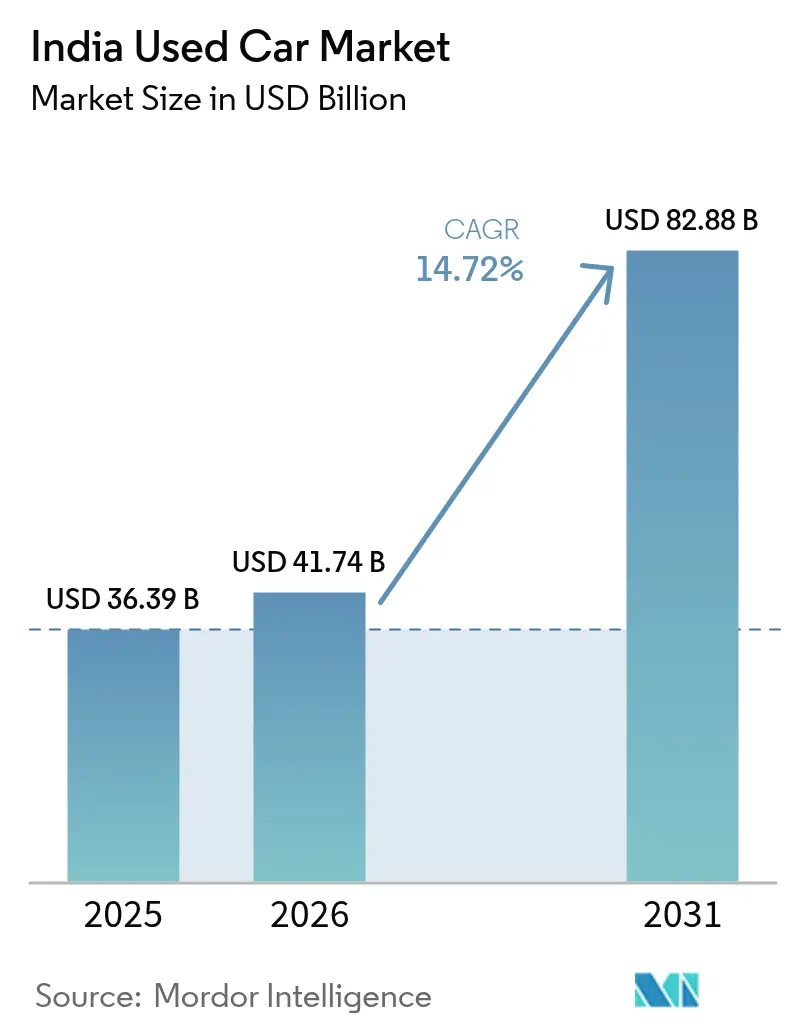
| Base Year Market Size (2025) | USD 36.39 Billion |
| Market Size (2026) | USD 41.74 Billion |
| Market Size (2031) | USD 82.88 Billion |
| Growth Rate (2026 - 2031) | 14.72% CAGR |
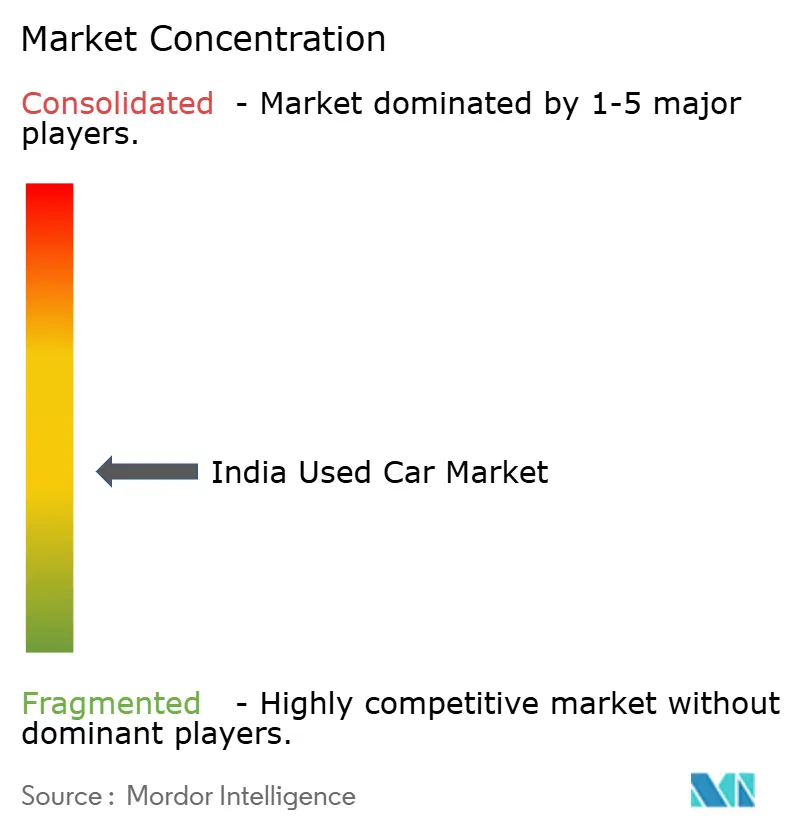
| Market Concentration | Low |
Major Players
*Disclaimer: Major Players sorted in no particular order Image © Mordor Intelligence. Reuse requires attribution under CC BY 4.0. |
|
India Used Car Market Analysis by Mordor Intelligence
The India used car market size was valued at USD 36.39 billion in 2025 and estimated to grow from USD 41.74 billion in 2026 to reach USD 82.88 billion by 2031, at a CAGR of 14.72% during the forecast period (2026-2031). Rapid digitization, higher new-car prices, deeper credit access, and shifting fuel-mix preferences continue to reshape market dynamics. Organized dealers and online platforms are eroding traditional local dominance as transparent pricing, embedded financing, and warranty services raise consumer confidence. Supply constraints, especially in the INR 3-5 lakh band, push annual resale prices up by 8-10%, while the scrappage policy and GST changes accelerate replacement cycles and favor scale players. SUVs, compact crossovers, and battery-electric models add new growth layers by widening the product mix and extending the addressable customer base.
Key Report Takeaways
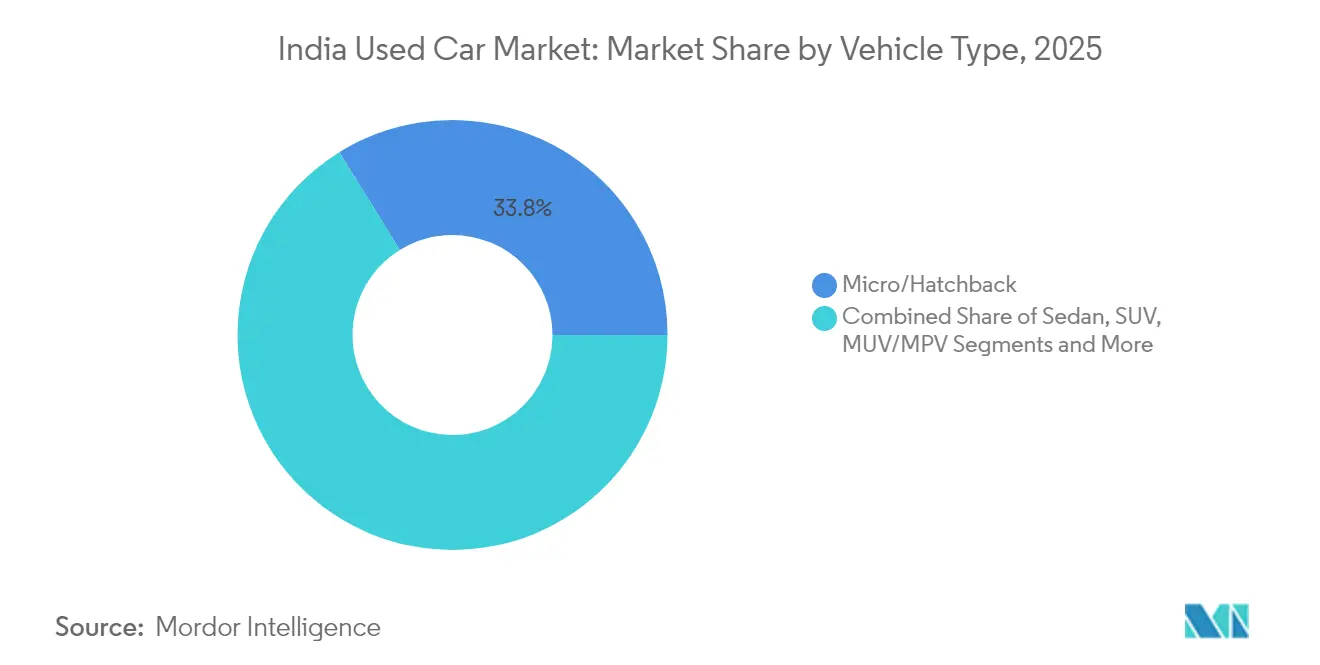
- By vehicle type, micro/hatchbacks led with 33.82% of the India used car market's market share in 2025, while SUVs are on track for a 15.95% CAGR from 2026 to 2031.
- By vendor type, unorganized local dealers held 70.83% of the India used car market share in 2025, whereas online platforms are poised for the fastest 26.85% CAGR through 2031.
- By fuel, petrol variants commanded a 60.77% of the India used car market share in 2025; battery-electric vehicles are forecast to expand at a 34.10% CAGR.
- By vehicle age, cars aged 3-5 years held a 45.94% of the India used car market share in 2025 and remain the liquidity core; units under 3 years will climb at a 18.65% CAGR.
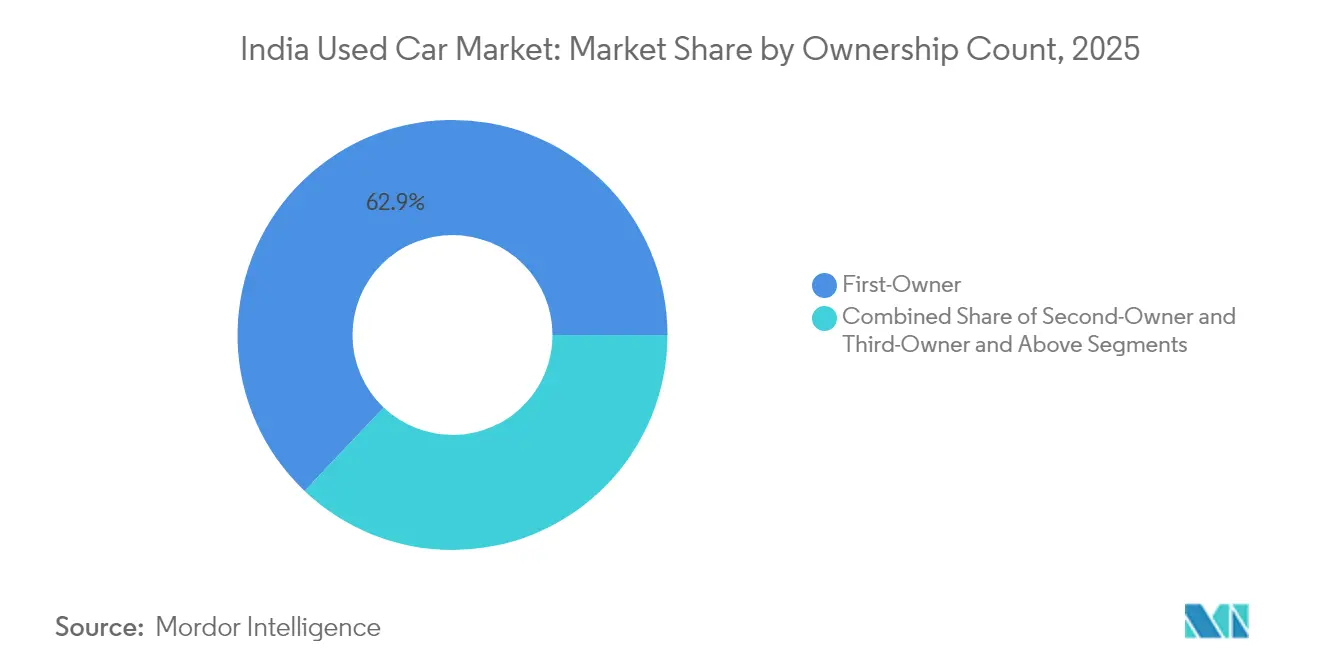
- By ownership count, first-owner vehicles represented 62.92% of the market share in the India used car market in 2025 and are set to rise at a 15.35% CAGR.
- By price band, the INR 3-5 lakh segment made up 42.95% of India's used car market's market share in 2025; the more than INR 12 lakh bracket shows a 15.55% CAGR outlook.
- By transmission, manual cars hold a 68.50% share in the India used car market in 2025, while automatic variants will log a 16.10% CAGR.
- By region, North India accounted for 36.30% of revenue share in the India used car market in 2025; North-East India is projected to register the quickest 18.05% CAGR to 2031.
Note: Market size and forecast figures in this report are generated using Mordor Intelligence’s proprietary estimation framework, updated with the latest available data and insights as of 2026.
India Used Car Market Trends and Insights
Drivers Impact Analysis*
| Driver | (~) % Impact on CAGR Forecast | Geographic Relevance | Impact Timeline |
|---|---|---|---|
| Rise of Organised and Digital Retail Platforms | +3.2% | National, with early gains in Delhi-NCR, Mumbai, Bengaluru | Medium term (2-4 years) |
| High New-Car Prices and Faster Depreciation | +2.8% | National, particularly affecting tier-2 and tier-3 cities | Short term (≤ 2 years) |
| Expanding Credit Availability and Fintech Lending | +2.1% | National, with stronger penetration in urban markets | Medium term (2-4 years) |
| Growing Preference for SUVs in Value-Retention | +1.9% | National, led by North and West India | Long term (≥ 4 years) |
| Vehicle-Scrappage Policy Accelerating Turnover | +1.7% | National, with higher impact in North India | Long term (≥ 4 years) |
| Mobility-Fleet De-Fleeting and Subscription Returns | +1.4% | Metro cities and tier-1 urban centers | Short term (≤ 2 years) |
| Source: Mordor Intelligence | |||
Rise of Organized and Digital Retail Platforms
Digital transformation is creating unprecedented transparency in a traditionally opaque market, with organized retail expected to grow from 30% to 50% market share by 2030. Cars24's INR 5 billion technology investment and hiring of 100+ tech experts demonstrate the capital intensity required to build real-time valuation algorithms and maintenance tracking systems[1]"Cars24 Plots INR 5 Billion Investment, Hire Over 100 Tech Experts Too", Motoring Trends, motoring-trends.com.. CarTrade Tech's achievement of 150 million yearly unique users with 90% organic traffic validates the asset-light digital platform model's scalability. The shift toward digital-first transactions is particularly pronounced among women buyers, who now represent 46% of purchases compared to 35% in Q3 FY2024, with Delhi-NCR leading at 48% female participation. Platform consolidation accelerates as financing integration becomes critical, with 60% of Cars24 transactions now including embedded lending solutions. Technology adoption in tier-2 and tier-3 cities reduces information asymmetry that historically favored local dealers, creating market democratization effects that benefit buyers and sellers through improved price discovery mechanisms.
High New-Car Prices and Faster Depreciation
New vehicle pricing pressures fundamentally reshape consumer purchase decisions in the India Used Car Market, with used car sales reaching 5.17 million units in FY23 and projected to double to 10 million by FY28. The average ownership period has contracted from 6-8 to 4-5 years, creating increased supply velocity that benefits the used car ecosystem. Cars24's average selling price increase to INR 5.5 lakh reflects this premium migration, with 40% of sales concentrated in the INR 4-8 lakh range, where value-conscious buyers seek maximum utility. Supply-demand imbalances generate annual price appreciation of 8-10%, particularly affecting first-time buyers who represent 63% of ownership count but face increasing affordability constraints. The depreciation acceleration is most pronounced in premium segments, where technology obsolescence and feature updates drive faster replacement cycles. Market dynamics suggest that used cars are becoming the primary entry point for vehicle ownership, with new car sales increasingly concentrated among replacement buyers rather than first-time purchasers.
Expanding Credit Availability and Fintech Lending
Financing penetration has increased from 75% to 80% since 2020 in the India Used Car Market, driven by aggressive public sector bank lending that offers rates from 8.15% for electric vehicles to 8.35% for conventional cars. NBFCs are losing market share in new car financing but focusing on used vehicle segments where banks typically avoid lending due to valuation complexities. CarDekho's Rupyy platform plans to enter used commercial vehicle financing in FY25, targeting a 20% market share in an INR 60,000 crore used car financing market. Digital lending platforms are streamlining approval processes that traditionally took weeks into hours, with embedded financing becoming a competitive differentiator for organized players. The used car financing market is projected to grow at a 25% CAGR, significantly outpacing the overall market growth rate. Fintech integration enables real-time credit scoring and risk assessment, reducing documentation requirements and improving customer experience while expanding credit access to previously underserved segments in tier-2 and tier-3 cities.
Growing Preference for SUVs in Value-Retention
SUV demand in the used car segment reflects broader consumer preference shifts, with compact SUVs experiencing 20% growth in Q1 2025, led by the discontinued Ford EcoSport, followed by Tata Nexon and Hyundai Venue. SUVs now account for nearly 40% of used car purchases in non-metropolitan areas, driven by perceived value retention and versatility. The preference for higher ground clearance and robust build quality resonates particularly in tier-2 and tier-3 cities where road infrastructure remains challenging. Value retention characteristics make SUVs attractive to buyers who view vehicles as investment assets rather than depreciating purchases. Maruti Suzuki's upcoming 7-seater Grand Vitara launch in FY26 demonstrates OEM recognition of this trend, positioning to capture both new and eventual used car market demand. The SUV preference is creating segmentation within the used car market, with compact SUVs priced between INR 6-8 lakh showing particularly strong demand in cities like Bengaluru, Hyderabad, and Pune.
Restraints Impact Analysis*
| Restraint | (~) % Impact on CAGR Forecast | Geographic Relevance | Impact Timeline |
|---|---|---|---|
| Quality Opacity and Odometer Fraud | -2.3% | National, particularly affecting unorganized dealer transactions | Medium term (2-4 years) |
| Limited Financing for More Than 8-Year-Old Vehicles | -1.8% | National, with higher impact in rural and semi-urban areas | Long term (≥ 4 years) |
| Stricter Emission and ZEV Norms Devaluing Older ICE Stock | -1.5% | National, with higher impact in metro cities with stringent norms | Medium term (2-4 years) |
| Micro-Mobility and Ride-Hailing Reducing First-Car Demand | -1.2% | Metro cities and tier-1 urban centers | Long term (≥ 4 years) |
| Source: Mordor Intelligence | |||
Quality Opacity and Odometer Fraud
Information asymmetry remains the primary barrier to market expansion, with quality assessment challenges particularly acute in the unorganized segment that controls 70% of the market share. Traditional inspection methods lack standardization, creating consumer distrust that limits market participation and constrains pricing power for legitimate dealers. Digital platforms are investing heavily in standardized inspection protocols, with Cars24 implementing 200-point inspection processes and live auction mechanisms to ensure competitive pricing transparency. Blockchain technology adoption in the Indian automotive industry could address traceability concerns through immutable record-keeping, though implementation remains limited compared to global automotive giants[2]Paritosh Dhondiyal, "Blockchain Use Cases Explorative Study for Indian Automotive Industry", International Journal of Engineering Applied Sciences and Technology, ijeast.com. . The quality opacity problem is most pronounced in vehicles over 8 years old, where mechanical condition assessment requires specialized expertise that many buyers lack. Consumer education and standardized grading systems are emerging as competitive differentiators, with organized players leveraging technology to build trust and justify premium pricing over unorganized alternatives.
Limited Financing for More Than 8-Year-Old Vehicles
Age-based financing restrictions create artificial market segmentation that constrains liquidity in older vehicle categories, with banks typically avoiding loans for vehicles exceeding 8 years due to residual value uncertainties. This financing gap forces cash transactions that limit the buyer pool and depress pricing for older vehicles, creating market inefficiencies that benefit cash-rich buyers at the expense of credit-dependent consumers. NBFCs like Shriram Transport Finance report 97% of loan disbursements in the used vehicle segment, indicating specialized lenders are filling this gap, but at higher interest rates. The financing constraint is particularly acute in rural and semi-urban areas where buyers have limited access to alternative funding sources and rely more heavily on institutional credit. Digital lending platforms are beginning to address this gap through alternative credit scoring models that evaluate vehicle condition and buyer profile rather than relying solely on vehicle age. The restriction creates a two-tier market where newer vehicles enjoy premium valuations due to financing availability, while older vehicles face artificial price compression despite potentially superior mechanical condition.
*Our forecasts treat driver/restraint impacts as directional, not additive. The impact forecasts reflect baseline growth, mix effects, and variable interactions.
Segment Analysis
By Vehicle Type: SUVs Drive Premium Migration
Micro/hatchbacks command 33.82% market share in 2025, reflecting their role as entry-level mobility solutions, while SUVs demonstrate the fastest growth at 15.95% CAGR (2026-2031), driven by value retention perceptions and versatility demands. The Ford EcoSport's continued popularity despite production discontinuation in 2021 illustrates how certain models maintain strong resale demand due to proven reliability and service network availability. Sedans face declining preference as consumers migrate toward SUVs and hatchbacks, with traditional three-box designs losing appeal among younger buyers who prioritize ground clearance and cargo flexibility. MUV/MPV segments serve niche commercial and large family requirements, maintaining steady demand in tier-2 cities where joint family structures remain prevalent.
Luxury and sports car segments benefit from aspirational purchasing in metro cities, with brands like BMW, Audi, and Mercedes-Benz establishing certified pre-owned programs to capture this demand while maintaining brand equity. The segmentation reflects broader automotive trends where SUVs are becoming the dominant body style across price points, supported by improved fuel efficiency and ride quality that address traditional SUV limitations. Consumer preference evolution suggests continued SUV market share expansion, particularly in compact and mid-size categories, where manufacturers are launching new models to capture both new and eventual used car demand.


By Vendor Type: Digital Disruption Accelerates
Unorganized local dealers maintain 70.83% market share in 2025, reflecting the market's fragmented nature and consumers' preference for personal relationships in high-value transactions. Online platforms achieve the fastest growth at 26.85% CAGR (2026-2031), driven by transparency initiatives and financing integration that address traditional pain points in used car transactions. OEM-certified franchise programs leverage brand trust and standardized processes to capture quality-conscious buyers willing to pay premiums for assured vehicle condition and warranty coverage. Large multi-brand offline dealers occupy the middle ground, offering a wider selection than OEM programs while providing physical inspection capabilities that online platforms cannot match.
The vendor landscape is experiencing rapid evolution as digital platforms invest heavily in technology infrastructure and customer acquisition, with Cars24's INR 5 billion investment demonstrating the capital requirements for market leadership. CarTrade Tech's 150 million yearly unique users with 90% organic traffic validate the digital platform model's scalability and customer acquisition efficiency. Market consolidation appears inevitable as organized players gain scale advantages in financing, logistics, and customer service that unorganized dealers cannot match. However, the transition timeline remains uncertain given local dealers' embedded relationships and cost advantages.
By Fuel Type: Electric Transition Creates Complexity
Petrol vehicles dominate with a 60.77% market share in 2025, benefiting from widespread refueling infrastructure and consumer familiarity, while battery-electric vehicles demonstrate an exceptional 34.10% CAGR (2026-2031) despite a current low base. The EV growth trajectory faces headwinds from resale value concerns, with 51% of EV owners considering switching to ICE vehicles due to charging anxiety and maintenance costs. Diesel vehicles face declining preference due to emission norms and higher acquisition costs, though they maintain appeal in commercial applications and long-distance usage scenarios. CNG vehicles occupy a niche position in markets with established infrastructure, particularly in Delhi-NCR, where regulatory support and cost advantages drive adoption.
Hybrid vehicles represent a transitional technology that addresses range anxiety while providing fuel efficiency benefits, though market penetration remains limited due to higher acquisition costs and limited model availability. The fuel type segmentation reflects India's energy transition complexity, where infrastructure limitations and cost considerations create multiple viable powertrain options rather than clear technology winners. Market dynamics suggest continued ICE dominance in the near term, with electric vehicle adoption accelerating as charging infrastructure expands and battery costs decline. However, the transition timeline remains uncertain given the challenges of the current resale value.
By Vehicle Age: Supply Concentration Drives Pricing
Vehicles aged 3-5 years command 45.94% market share in 2025, representing the sweet spot where depreciation has reduced acquisition costs while reliability remains high and financing remains accessible. The less-than-3-years segment achieves 18.65% CAGR (2026-2031), driven by faster ownership turnover as consumers upgrade more frequently due to technology advancement and changing preferences. Vehicles aged 6-8 years face financing constraints that limit the buyer pool and depress pricing, creating opportunities for cash buyers but reducing market liquidity. The more-than-8-years segment encounters severe financing restrictions that force cash transactions and create artificial price compression despite potentially superior mechanical condition.
Age-based market segmentation reflects financing industry practices rather than vehicle utility, creating inefficiencies organized players are beginning to address through alternative credit scoring and specialized lending partnerships. The vehicle scrappage policy creates additional complexity by providing incentives for older vehicle disposal, potentially reducing supply in higher-age categories while generating certificate benefits that can reduce new vehicle acquisition costs. Market evolution suggests continued concentration in the 3-5 year segment as consumers seek an optimal balance between cost, reliability, and financing availability. However, digital platforms may expand financing access to older vehicle categories through improved risk assessment capabilities.
By Ownership Count: First-Owner Premium Persists
First-owner vehicles command 62.92% market share in 2025 and maintain the fastest growth at 15.35% CAGR (2026-2031), reflecting consumer preference for vehicles with known maintenance history and single-owner care. Second-owner vehicles represent the largest growth opportunity as first-time buyers seek affordable alternatives. At the same time, third-owner and above categories face increasing skepticism about maintenance quality and remaining useful life. The ownership count preference reflects information asymmetry concerns where buyers use ownership history as a proxy for vehicle condition without standardized inspection and grading systems.
Digital platforms are working to reduce the first-owner premium through comprehensive inspection protocols and warranty offerings that provide confidence in multi-owner vehicles, potentially expanding market liquidity and improving pricing efficiency. The ownership segmentation also reflects India's developing used car market maturity, where established markets typically show less pronounced ownership count preferences due to better information systems and consumer confidence. Market evolution suggests continued first-owner preference in the near term. However, standardization efforts by organized players may gradually reduce the premium as inspection and warranty systems build consumer trust in multi-owner vehicles.
By Price Band: Middle Market Dominates
The INR 3 to 5 lakh price band commands 42.95% market share in 2025, representing the primary affordability zone for first-time buyers and replacement purchasers seeking reliable transportation without premium features. The above-12-lakh segment achieves 15.55% CAGR (2026-2031), driven by aspirational purchasing and premium vehicle depreciation that brings luxury features within reach of upper-middle-class buyers. The below-3 lakh segment serves ultra-budget buyers but faces quality concerns and limited financing availability that constrain growth potential. The INR 5-8 lakh and INR 8-12 lakh bands represent progression segments where buyers upgrade from entry-level vehicles while remaining cost-conscious.
Price band dynamics reflect India's income distribution and automotive market structure, where the middle class expansion drives demand concentration in affordable segments. In contrast, premium segments benefit from luxury vehicle depreciation and aspirational purchasing. Supply-demand imbalances are creating annual price increases of 8-10% across all segments, with particular pressure in the dominant INR 3-5 lakh band where first-time buyer demand exceeds available supply. Market evolution suggests continued middle-market dominance as economic growth expands the addressable buyer pool. However, premium segments may experience accelerated growth as organized players improve financing access and reduce transaction friction.
By Transmission: Automatic Adoption Accelerates
Manual transmissions maintain 68.50% market share in 2025, reflecting cost considerations and consumer familiarity, while automatic transmissions achieve 16.10% CAGR (2026-2031), driven by urban congestion and convenience preferences. The automatic transmission preference is most pronounced among women buyers, who account for 46% of used car purchases and strongly prefer automatic hatchbacks and compact SUVs. Metro cities demonstrate higher automatic transmission adoption due to traffic conditions that make manual operation burdensome, while tier-2 and tier-3 cities maintain manual preference due to cost sensitivity and service availability concerns.
The transmission segmentation reflects broader automotive market evolution. Automatic transmissions are becoming standard in new vehicles, increasing supply in the used car market as these vehicles age. Technological advancements in CVT and AMT systems are reducing the cost and complexity gap between manual and automatic transmissions, potentially accelerating adoption rates in price-sensitive segments. Market dynamics suggest continued manual dominance in budget segments. At the same time, automatic transmissions gain share in premium and urban-focused categories, with the transition timeline dependent on new vehicle market trends and consumer preference evolution.
Geography Analysis
North India generated 36.30% of 2025 revenue, anchored by Delhi-NCR’s deep dealer networks, high per-capita income, and policy incentives such as scrappage rebates that accelerate replacement cycles. Certificate benefits attached to scrappage certificates reduce effective invoice prices, nudging owners toward newer models. Organized retailers and OEM-certified outlets scale quickly here, leveraging mature credit ecosystems and digital awareness.
West India leverages Mumbai’s financial clout and Gujarat’s manufacturing base to foster an 8% regional growth rate, slightly above the national curve. Higher disposable incomes fuel premium car turnover, boosting the India used car market. Digital platforms gain early traction because urban buyers prioritize verified histories and doorstep delivery. Gujarat’s industrial workforce, dependent on personal mobility for daily commutes, feeds steady hatchback demand.
Though small in absolute terms, North-East India registers an 18.05% CAGR, driven by improved highways, rising tourism, and duty benefits that stimulate vehicle ownership. Organized presence remains nascent, so digital platforms rely on local logistics partners for inspection and delivery. East and Central corridors reveal latent potential tied to upcoming industrial corridors; here, unorganized agents still close most deals, but rising smartphone penetration opens doorways for online models. Regional heterogeneity thus requires tailored go-to-market tactics in inventory mix, payment methods, and after-sales support.
Competitive Landscape
The India used car market remains highly fragmented, with many unorganized dealers. Unorganized brokers dominate volumes yet lack scale economies or technology depth. Cars24, Spinny, and CarTrade collectively hold a noteworthy share, with Cars24 alone handling nearly 200,000 annual units and preparing for public listing. OEM-certified channels such as Maruti True Value and Mahindra First Choice reinforce brand trust, capturing quality-seeking customers who accept 5-7% price premiums.
Strategy divergence is clear. Technology-first platforms prioritize rapid inventory turns, data-driven pricing, and nationwide logistics. OEM programs favor showroom extensions and cross-selling of add-on services. Traditional dealers bank on local relationships, flexible negotiation, and lower overheads. Consolidation is expected as GST-driven compliance and capital needs pressure from small brokers.
Competitive weaponry increasingly pivots on financing alliances, warranty duration, and digital reach. Cars24’s INR 5 billion technology spend funds AI valuation and predictive maintenance engines that raise gross margin per car. CarTrade’s asset-light model monetizes classifieds through advertising and auction fees, boasting 150 million annual unique visitors. Fintech entrants plug gaps in older-vehicle lending, while subscription fleets offer organized players bulk supply at predictable intervals. Though early, blockchain pilots for vehicle history hint at the next trust leap.
India Used Car Industry Leaders
-
Cars24
-
Maruti True Value
-
Mahindra First Choice Wheels
-
Hyundai H Promise
-
Spinny
- *Disclaimer: Major Players sorted in no particular order

Recent Industry Developments
- January 2025: CarTrade Tech reported its third consecutive quarterly profit, with a net profit of INR 45.33 crore in Q3FY25, demonstrating the viability of asset-light digital platform models in the used car market.
- December 2024: The GST Council increased tax rates on used vehicle sales from 12% to 18% for registered dealers, creating potential cost pressures that may accelerate organized player consolidation.
- December 2024: Cars24 announced INR 5 billion investment in technology infrastructure and plans to hire over 100 tech experts to develop real-time car valuation and maintenance tracking capabilities.


India Used Car Market Report Scope
A used car, also known as a pre-owned vehicle or a secondhand car, is one that has previously been owned by one or more retail owners.
India's Used Car Market is segmented into Vehicle Type, Vendor Type, and Fuel Type. By Vehicle Type, the market is segmented into Hatchbacks, Sedans, and Sports Utility Vehicles. By vendor type, the market is segmented into Organized and Unorganized. By Fuel Type, the market is segmented into Petrol and Diesel.
By Vehicle Type
| Micro/Hatchback |
| Sedan |
| Sport Utility Vehicle |
| Multi-Purpose Vehicle |
| Luxury and Sports |
By Vendor Type
| OEM-Certified Franchise |
| Online Platforms |
| Large Multi-brand Offline Dealers |
| Unorganized Local Dealers |
By Fuel Type
| Petrol |
| Diesel |
| CNG |
| Hybrid |
| Battery-Electric |
By Vehicle Age
| Less than 3 Years |
| 3 to 5 Years |
| 6 to 8 Years |
| More than 8 Years |
By Ownership Count
| First-Owner |
| Second-Owner |
| Third-Owner and Above |
By Price Band
| Less than ₹3 lakh |
| ₹3 to ₹5 lakh |
| ₹5 to ₹8 lakh |
| ₹8 to ₹12 lakh |
| More than ₹12 lakh |
By Transmission
| Manual |
| Automatic |
By Region
| North India |
| West India |
| South India |
| East India |
| Central India |
| North-East India |
| By Vehicle Type | Micro/Hatchback |
| Sedan | |
| Sport Utility Vehicle | |
| Multi-Purpose Vehicle | |
| Luxury and Sports | |
| By Vendor Type | OEM-Certified Franchise |
| Online Platforms | |
| Large Multi-brand Offline Dealers | |
| Unorganized Local Dealers | |
| By Fuel Type | Petrol |
| Diesel | |
| CNG | |
| Hybrid | |
| Battery-Electric | |
| By Vehicle Age | Less than 3 Years |
| 3 to 5 Years | |
| 6 to 8 Years | |
| More than 8 Years | |
| By Ownership Count | First-Owner |
| Second-Owner | |
| Third-Owner and Above | |
| By Price Band | Less than ₹3 lakh |
| ₹3 to ₹5 lakh | |
| ₹5 to ₹8 lakh | |
| ₹8 to ₹12 lakh | |
| More than ₹12 lakh | |
| By Transmission | Manual |
| Automatic | |
| By Region | North India |
| West India | |
| South India | |
| East India | |
| Central India | |
| North-East India |


Key Questions Answered in the Report
How large is the India used car market in 2026?
The India used car market stands at USD 41.74 billion in 2026 and is projected to reach USD 82.88 billion by 2031.
Which region leads the market today?
North India holds 36.30% of revenue, supported by dense dealer networks and higher disposable incomes.
What fuel type shows the highest growth potential?
Battery-electric vehicles have a 34.10% CAGR outlook, even though petrol cars still dominate volumes.
How does the scrappage policy influence supply?
Scrappage incentives encourage owners of 15-year-old cars to trade in sooner, injecting younger inventory and stabilizing quality in the organized channel.
Page last updated on:


