Spare Parts Logistics Market Size and Share
Market Overview
| Study Period | 2020 - 2031 |
|---|---|
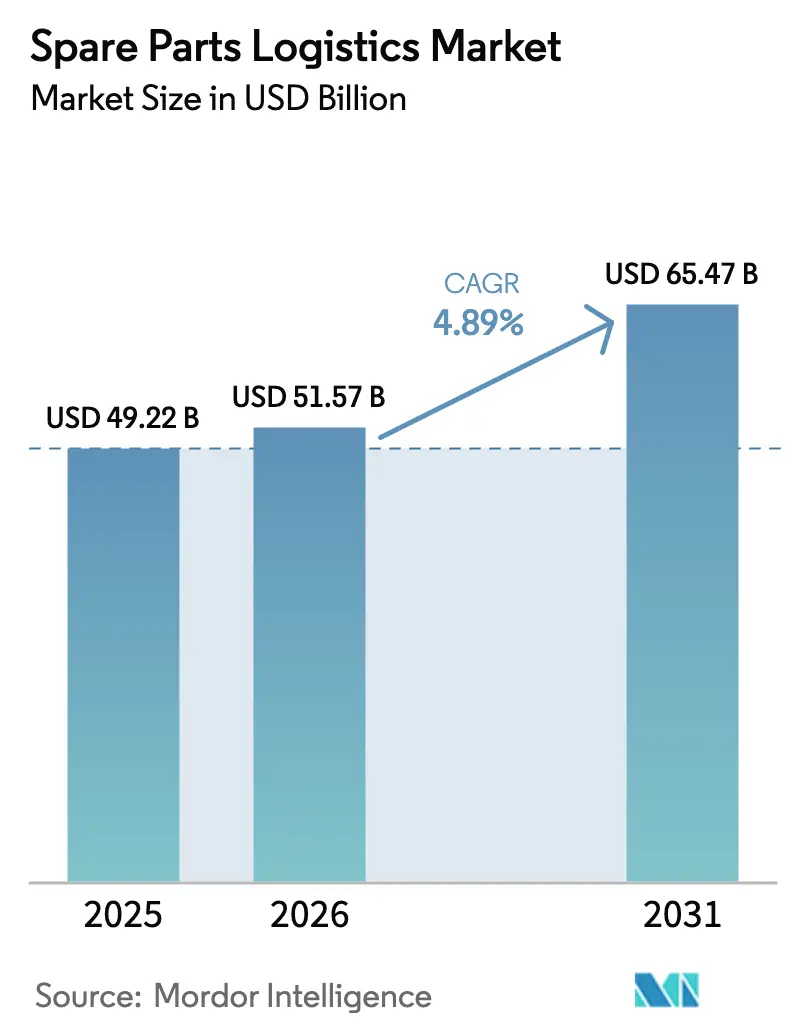
| Market Size (2026) | USD 51.57 Billion |
| Market Size (2031) | USD 65.47 Billion |
| Growth Rate (2026 - 2031) | 4.89% CAGR |
| Fastest Growing Market | Asia Pacific |
| Largest Market | Asia Pacific |
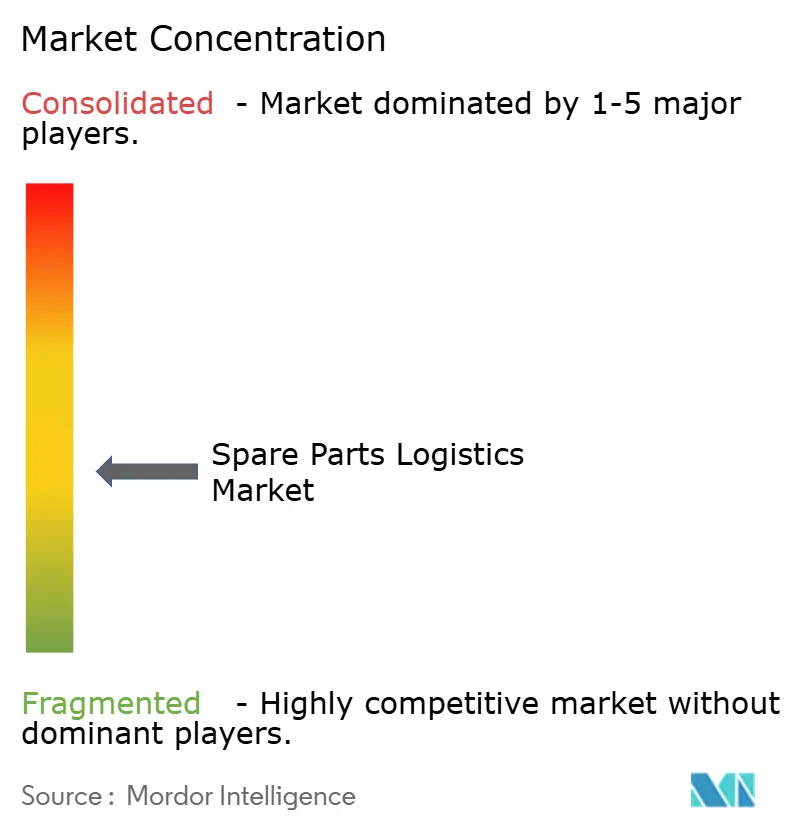
| Market Concentration | Medium |
Major Players *Disclaimer: Major Players sorted in no particular order Image © Mordor Intelligence. Reuse requires attribution under CC BY 4.0. | |
Spare Parts Logistics Market Analysis by Mordor Intelligence
The Spare Parts Logistics Market size is expected to grow from USD 49.22 billion in 2025 to USD 51.57 billion in 2026 and is forecast to reach USD 65.47 billion by 2031 at 4.89% CAGR over 2026-2031.
The spare parts logistics market is evolving toward service-driven and uptime-critical models, where rapid availability of components directly impacts operational continuity across industries. Global integrators are strengthening their position by securing multi-country aftermarket contracts and expanding network capabilities through strategic acquisitions. At the same time, the rise of complex equipment, particularly in automotive electrification and industrial automation, is increasing demand for specialized handling, reverse logistics, and inventory pre-positioning.
In mature markets, aging infrastructure and regulatory requirements continue to support steady demand for spare parts services, while emerging economies are driving volume growth through expanding manufacturing activity. Technology adoption, including predictive maintenance and real-time visibility tools, is further enabling providers to shift from transactional logistics toward outcome-based service models focused on uptime assurance.
Key Report Takeaways
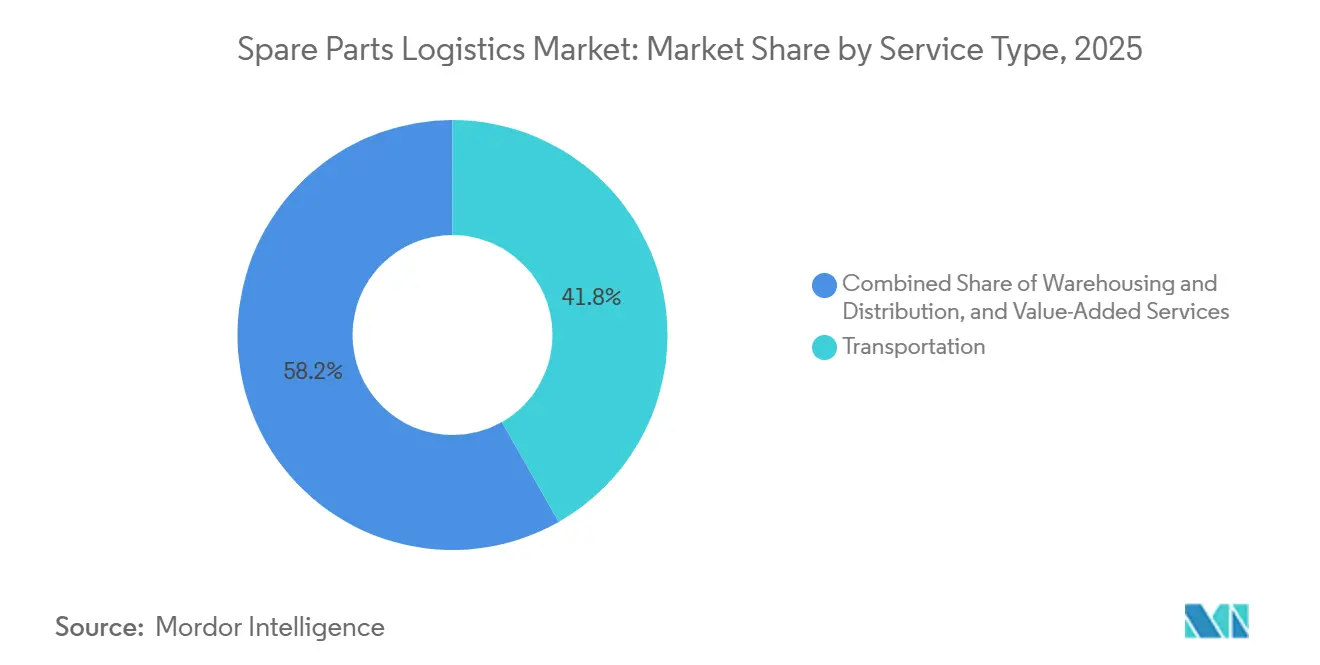
- By service type, transportation services led with 41.78% of the spare parts logistics market share in 2025, while value-added services are forecast to expand at a 6.32% CAGR through 2031.
- By source channel, the OEM channel accounted 52.67% of the spare parts logistics market size in 2025, and the independent aftermarket is projected to grow at 6.81% annually.
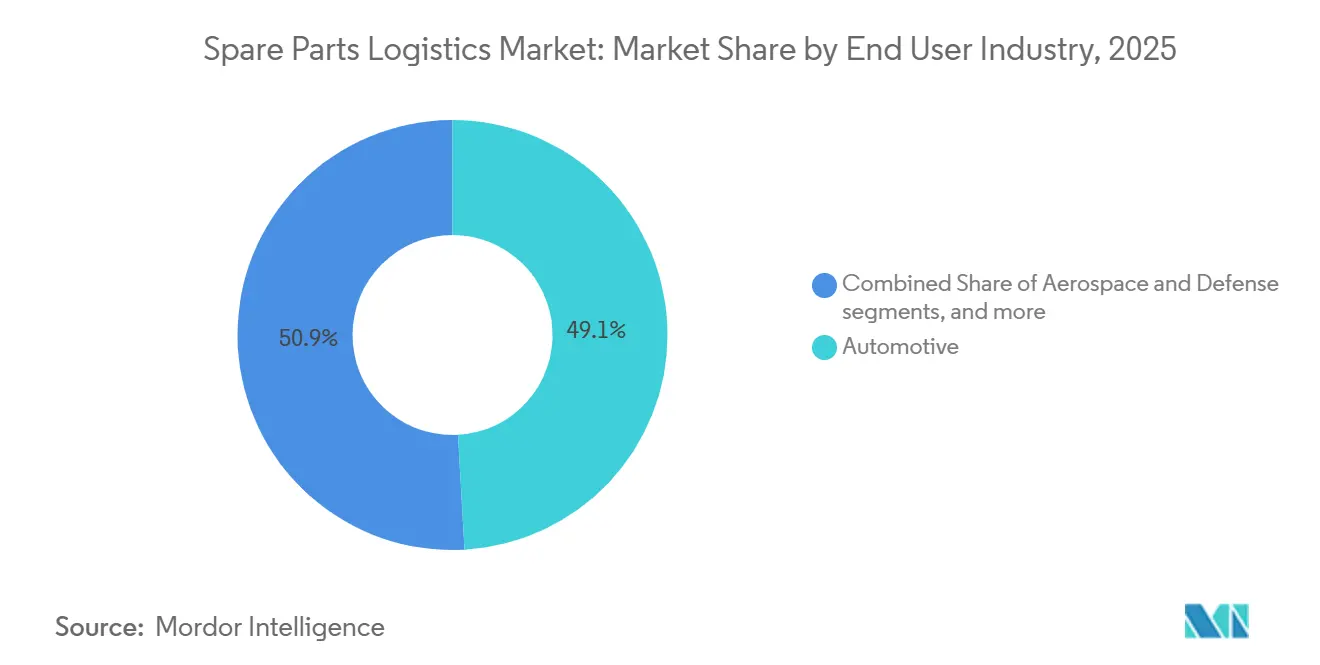
- By end-use industry, automotive accounted for 49.12% of the spare parts logistics market share in 2025, while healthcare equipment logistics is advancing at a 5.87% CAGR.
- By business type, B2B represented 68.97% market share in 2025, and B2C channels are growing at a 5.87% CAGR.
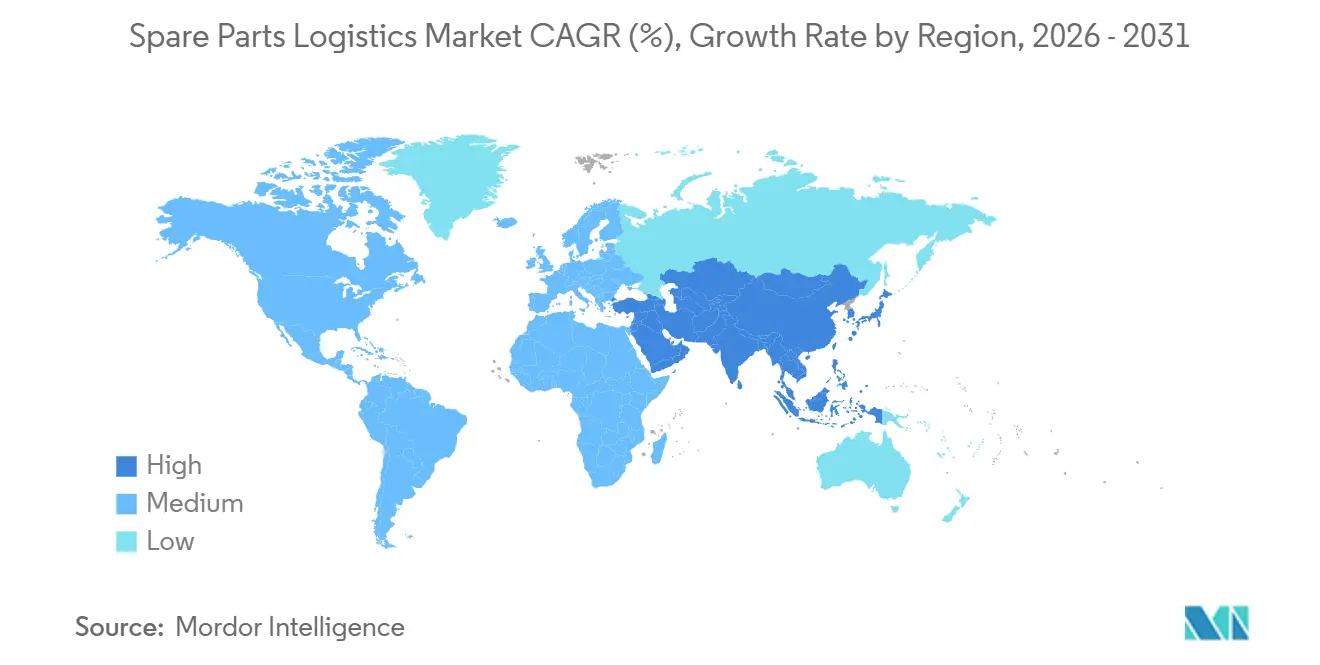
- By geography, Asia-Pacific captured 38.21% of the market size in 2025 and is expected to grow at a 5.21% CAGR to 2031.
Note: Market size and forecast figures in this report are generated using Mordor Intelligence’s proprietary estimation framework, updated with the latest available data and insights as of January 2026.
Global Spare Parts Logistics Market Trends and Insights
Drivers Impact Analysis*
| Driver | (~) % Impact on CAGR Forecast | Geographic Relevance | Impact Timeline |
|---|---|---|---|
| Aging Industrial Equipment Base Requiring Frequent Replacements | + 0.9% | Global, with concentration in North America and Europe | Long term (≥ 4 years) |
| Shift from Product Sales to Service-Based Revenue Models | + 1.2% | Global, led by North America and Europe, expanding to Asia | Medium term (2-4 years) |
| Equipment Downtime Cost Pressures Demanding Faster Delivery | + 1.0% | Global, especially manufacturing-intensive regions in Asia-Pacific and North America | Short term (≤ 2 years) |
| Complex Machinery Adoption in Emerging Manufacturing Hubs | + 0.8% | APAC core (China, India, Indonesia, Vietnam), spill-over to MEA | Long term (≥ 4 years) |
| Growth of Multi-Brand Service Providers | + 0.5% | North America & EU, emerging in Asia-Pacific | Medium term (2-4 years) |
| Increasing Equipment Utilization Rates Accelerating Wear Cycles | + 0.7% | Global, particularly in automotive and industrial manufacturing sectors | Medium term (2-4 years) |
| Source: Mordor Intelligence | |||
Aging Industrial Equipment Base Requiring Frequent Replacements
Equipment owners are extending asset lifetimes, raising the priority on parts availability as breakdown risks increase with age. In this operating environment, a single missing component can stall production and ripple through downstream schedules and labor plans, which pushes buyers to value high fill rates and accurate lead times in the spare parts logistics market. Industrial teams are also deploying predictive maintenance to anticipate failures and shorten repair windows, which rewards providers able to pre-position critical SKUs. Digital twins that mirror installed configurations help forecast failure modes and align just-in-time replenishment with service-level targets, which stabilizes working capital for maintenance portfolios. As deferred capital expenditures persist in mature markets, the spare parts logistics market becomes central to uptime assurance programs adopted by manufacturers.
Shift from Product Sales to Service-Based Revenue Models
Service-based contracts that monetize the installed base are changing procurement decisions and the required capabilities of logistics partners in the spare parts logistics market. Connected equipment and service lifecycle management platforms now enable uptime guarantees, fixed-fee arrangements, and remote diagnostics that depend on predictable parts flows. Outcome-based agreements shift risk to providers that can price and deliver against promised service outcomes, which increases demand for tech-enabled logistics and compliant facilities in regulated categories. Vendors that can unify engineering data, inventory status, and field operations move beyond transactional shipping into integrated partnerships that lock in recurring services. As servitization spreads across regions and sectors, the spare parts logistics market rewards providers who can manage complex parts catalogs with real-time visibility and consistent quality.
Equipment Downtime Cost Pressures Demanding Faster Delivery
Production interruptions carry steep penalties, so manufacturers prioritize partners who can deliver critical items within hours rather than days in the spare parts logistics market. Manufacturing activity in Asia rose sharply in early 2026, signaling tighter capacity and potential bottlenecks that raise the value of assured response for urgent orders. Aerospace customers exemplify these expectations, with CEVA and HAECO establishing a two-year global air-freight partnership to coordinate routine and aircraft-on-ground shipments with around-the-clock operations[1]HAECO Press Office, “HAECO and CEVA Logistics Sign Global Air Freight Partnership,” HAECO, haeco.com . Buyers are also asking for predictable pricing and stronger technology use to avoid failures, which ties contract renewal to measurable service reliability. Providers that consistently achieve high fill rates for critical SKUs and maintain on-time accuracy convert logistics from a cost to a performance advantage in the spare parts logistics market.
Complex Machinery Adoption in Emerging Manufacturing Hubs
New manufacturing capacity in Asia is raising technical complexity and the scope of specialized parts in the spare parts logistics market. China’s auto production remained the world’s largest in 2025, driven by new-energy vehicles that require temperature-managed and safety-compliant logistics for batteries and modules. Precision handling and controlled environments are also essential in aerospace and medical equipment, which increases the demand for certified facilities and customs expertise. Investments in regional production clusters are creating long-term opportunities for logistics partners who combine global procurement with local fulfillment hubs. As local OEMs scale and multinational firms diversify sourcing, the spare parts logistics market grows alongside vertical-specific requirements that favor operators with sector certifications and integrated brokerage.
Restraints Impact Analysis*
| Restraint | (~) % Impact on CAGR Forecast | Geographic Relevance | Impact Timeline |
|---|---|---|---|
| Extreme SKU Proliferation Creating Inventory Management Complexity | - 0.6% | Global, acute in automotive and electronics sectors | Short term (≤ 2 years) |
| Long-Tail Inventory Holding Costs Eroding Profit Margins | - 0.5% | Global, particularly affecting multi-industry distributors | Medium term (2-4 years) |
| Lack of Component Standardization Across Equipment Generations | - 0.4% | Global, especially industrial machinery and aerospace | Long term (≥ 4 years) |
| High Return Rates and Complex Reverse Logistics | - 0.3% | Global, intensified by e-commerce growth | Short term (≤ 2 years) |
| Source: Mordor Intelligence | |||
Extreme SKU Proliferation Creating Inventory Management Complexity
SKU counts expand as equipment variants, materials, and regulatory requirements fragment product lines, which stresses planning systems and warehouse space in the spare parts logistics market. Many MRO parts remain unmoved for long periods, which ties up capital and discourages rationalization due to fear of stockout penalties. Returns add more complexity because e-commerce channels have higher return rates that require buffer stock and specialized processing[2]Institute for Supply Management Editorial Staff, “Optimizing Reverse Logistics and Returns Management,” ISM, ism.ws . Plants that deploy AI-driven demand sensing and autonomous replenishment reduce emergency purchases and inventory costs by segmenting SKUs by criticality and failure risk. Tighter post-market surveillance and device-quality requirements also introduce tracking obligations in healthcare logistics that raise operational overhead for service providers.
Long-Tail Inventory Holding Costs Eroding Profit Margins
A small share of SKUs generates most transactions, while many slow movers accumulate carrying costs that erode margin in the spare parts logistics market. Inventory that sits for long durations consumes rent, insurance, obsolescence allowances, and capital costs, which is especially challenging for mid-tier distributors with thin margins. Better forecasting for end-of-life parts helps right-size last-time-buys and reduces write-offs, as shown by peer-reviewed models that improve demand predictions at the part level. Centralized returns operations recover value through refurbishment and component harvesting, although this requires investment in grading, visibility, and systems integration. Providers who realign capital toward fast movers and secure consignment for critical but intermittent items stabilize service levels while easing working-capital pressure in the spare parts logistics market.
*Our forecasts treat driver/restraint impacts as directional, not additive. The impact forecasts reflect baseline growth, mix effects, and variable interactions.
Segment Analysis
By Service Type: Multi-Modal Integration Captures Complexity Premium
Transportation services secured 41.78% of 2025 revenue, while value-added services are advancing at a 6.32% annual rate that raises the sophistication threshold for the spare parts logistics market. Road networks support dense intra-regional replenishment, air freight handles urgent and high-value shipments, and ocean lanes position scheduled maintenance inventories. Rail adds intercontinental capacity, linking Asian hubs to European demand centers with predictable timetables. High-performance networks rely on asset control, as shown by XPO’s continued North American LTL investments and service-center expansion that enhance network density and service quality[3]XPO Investor Relations, “Investor Presentation Q3 2025,” XPO, xpo.com . In healthcare and aerospace, temperature control, serialization, and compliant storage are table stakes that reward certified facilities aligned with the United States FDA’s Quality Management System Regulation in 2026.
Value-added services, including vendor-managed inventory, kitting, and light assembly, are capturing a complexity premium in the spare parts logistics market. These services consolidate formerly separate steps into integrated workflows that improve speed and reduce touch points. Providers with customs brokerage and bonded facilities shorten cross-border lead times and reduce clearance risk on regulated items. The growing use of digital twins and connected service platforms supports accurate staging of parts at customer sites, which ties logistics outcomes to maintenance windows and uptime guarantees. Partnerships like CEVA and HAECO’s global air-freight collaboration show the vertical depth now expected in aerospace spare parts, from aircraft-on-ground execution to temperature-managed components.


By Source Channel: OEM Control Meets Independent Agility
The OEM channel commanded 52.67% share in 2025, reflecting control over warranties, genuine-part quality, and lifecycle data that influence the spare parts logistics market. OEM networks use direct distribution to enforce pricing discipline and gather service insights that inform product redesign. Channel strategies now pair service contracts with visibility platforms that align stocking with uptime goals, which strengthens renewals and cross-sell potential. Independent operators are expanding at 6.81% per year with value propositions centered on multi-brand coverage, extended hours, and regional proximity for cost-sensitive buyers. This shift broadens customer choice and diminishes the need to maintain multiple OEM relationships for mixed fleets.
Both channels feel pressure from digital marketplaces that aggregate supply and expose pricing and lead times, creating a need for new forms of differentiation in the spare parts logistics market. Operators are testing outcome-based pricing, such as uptime guarantees for B2B and hassle-free returns for B2C. Providers that invest in connectivity, remote diagnostics, and predictive replenishment win share by ensuring parts are in the right place at the right time. Service lifecycle management platforms create a single digital thread that connects engineering, inventory, and field operations, which reduces failure-to-serve risk at customer sites. As customer expectations for reliability, predictability, and total cost optimization rise, the spare parts logistics industry increasingly favors operators who can assume performance risk and deliver consistent outcomes.
By End-Use Industry: Automotive Sector Leads Market Demand
Automotive accounted for 49.12% of end-use demand in 2025, anchored by extended fleet lifecycles and the expansion of electric powertrains that require specialized parts logistics. China produced 34.531 million vehicles in 2025, including 16.626 million new-energy vehicles, and shipped 7.098 million units, triggering complex domestic and cross-border parts replenishment and warranty flows. High-value electronics and semiconductor parts favor air shipments and vendor-managed inventory to synchronize with rapid product cycles. Aerospace and defense demand 24/7 support and dangerous-goods compliance, which elevates the bar for temperature, custody, and traceability standards. In these verticals, the spare parts logistics market size builds on certified handling networks and interoperable systems that connect maintenance schedules to inventory readiness.
Healthcare equipment logistics is a notable growth pocket, advancing at a 5.87% CAGR as hospitals and clinics balance uptime with stringent quality management in the spare parts logistics market. The United States FDA’s May 2024 guidance clarified the line between servicing and remanufacturing, which protects patient access to maintenance when safety and intended use are not altered. In 2026, the FDA’s Quality Management System Regulation further aligned with ISO 13485:2016, reinforcing expectations for storage, installation, and servicing practices that logistics providers must meet. Industrial machinery, energy, and maritime segments demand specialized moves for heavy and oversized components, which reward providers with engineering planning and route expertise. As utilization intensifies in manufacturing, demand tilts toward reliable availability and on-site staging of critical items to avoid costly downtime in the spare parts logistics market.
Geography Analysis
Asia-Pacific captured 38.21% of global revenue in 2025 and is set to grow at a 5.21% CAGR to 2031, supported by automotive, electronics, and aerospace value chains that require fast and compliant spare parts flows in the spare parts logistics market. China’s automotive sector produced 34.531 million vehicles in 2025, including 16.626 million new-energy vehicles, with exports of 7.098 million units that extend warranty and service networks into destination markets. Regional manufacturing conditions tightened in early 2026, signaling busier supply chains and emerging bottlenecks that increase the value of guaranteed response and staging for critical SKUs[4]GEP Team, “GEP Global Supply Chain Volatility Index, February 2026,” PR Newswire, prnewswire.com . Logistics providers with certified temperature control, dangerous-goods compliance, and around-the-clock operations win higher-value aerospace and healthcare contracts. Network expansions also focus on integrated customs brokerage and bonded storage, which reduces clearance risk and stabilizes transit times across the spare parts logistics market.
North America and Europe jointly account for a significant share of activity, with demand anchored in aging industrial assets, electrification, and compliance-heavy medical channels in the spare parts logistics market. DSV’s 2025 acquisition of DB Schenker created a larger platform with operations in more than 90 countries, supported by targeted synergies of DKK 9.0 billion (USD 1.3 billion) by 2028 from facility consolidation and IT integration. XPO continued to invest in its North American less-than-truckload network to expand coverage and improve service levels, which is relevant for time-definite spare parts replenishment across manufacturing corridors. In 2026, the FDA finalized its Quality Management System Regulation that references ISO 13485:2016, which heightens storage and servicing obligations in medical equipment logistics. Buyers in these regions value documented quality systems, audit trails, and robust reverse logistics for repairable components and loaner devices. The spare parts logistics market benefits from reconfigured networks that bring inventory closer to consumption while maintaining cross-border capabilities for specialized items.
South America, the Middle East, and Africa represent the remaining share and show selective growth tied to automotive, energy, and infrastructure programs in the spare parts logistics market. Mining and energy operations in Africa require specialized heavy components with long lead times, which favor pre-positioned consignment stock and predictive maintenance programs for uptime. Gulf economies invest in advanced manufacturing and power projects that generate steady maintenance, repair, and operations flows with tight compliance needs. In South America, operators localize inventories to avoid delays and reduce tariff exposure, which improves service levels for regional automotive and machinery fleets. Providers that secure free-zone licenses and establish regional hubs can shorten lead times and succeed on response commitments that differentiate offers. As these regions scale, the spare parts logistics market rewards partners that blend global procurement reach with local fulfillment and compliant handling for regulated categories.
Note: Segments share of all individual segments available upon report purchase

Competitive Landscape
The spare parts logistics market remains moderately fragmented overall, though high-value and multi-country aftermarket contracts are increasingly consolidating among global integrators. DSV’s April 2025 completion of DB Schenker’s acquisition expanded a platform with about DKK 310 billion (USD 45.0 billion) in revenue and almost 160,000 employees, signaling the capital intensity and network depth needed to support outcome-based service levels. In March 2026, Echo Global Logistics closed its purchase of ITS Logistics, creating one of North America’s largest third-party logistics platforms with about USD 5.2 billion in pro forma 2025 revenue and an emphasis on AI-driven capacity matching and shipment execution. These moves highlight an industry pivot from transactional brokering to integrated, technology-enabled partnerships that tie logistics outcomes to contract renewals.
Differentiation is shifting toward visibility, predictive analytics, and certified handling capabilities in the spare parts logistics market. CEVA and HAECO’s global air-freight agreement illustrates sector-specific specialization for aerospace components that require rapid response, dangerous-goods handling, temperature control, and continuous operations. In medical equipment, the FDA’s Quality Management System Regulation, finalized in 2026, reinforces expectations for documentation and quality controls across storage, installation, and servicing. Integrators and regionals that demonstrate audited compliance can build competitive moats, especially when paired with outcome guarantees.
Healthcare logistics consolidates end-to-end solutions that combine delivery, site preparation, regulatory documentation, and ongoing spare parts replenishment in the spare parts logistics market. Nippon Express Holdings’ 2025 acquisition of Germany’s Simon Hegele built a global healthcare platform focused on large equipment and industrial logistics, aligning installation expertise with international forwarding. In parallel, asset-based and brokerage-led networks continue to invest in network density, quality systems, and AI-enabled planning that reduce emergency purchases and rework. As digital marketplaces make prices and lead times transparent, providers compete on measurable reliability and data-driven inventory placement rather than rate-only strategies in the spare parts logistics market.
Spare Parts Logistics Industry Leaders
DHL Supply Chain & Global Forwarding
Kuehne + Nagel International AG
DSV A/S
Expeditors International of Washington
C.H. Robinson
- *Disclaimer: Major Players sorted in no particular order

Recent Industry Developments
- March 2026: Echo Global Logistics completed its acquisition of ITS Logistics, forming a combined platform with roughly USD 5.2 billion in pro forma 2025 revenue and emphasizing AI-enabled capacity matching, shipment execution, and end-to-end visibility.
- February 2026: CEVA Logistics and HAECO Group signed a two-year global air-freight partnership to manage worldwide aerospace component flows, including routine, urgent, aircraft-on-ground, dangerous goods, temperature-controlled, and oversized shipments, with continuous operations across Hong Kong, Xiamen, and Jinjiang.
- February 2026: The United States FDA implemented the Quality Management System Regulation that references ISO 13485:2016, raising compliance expectations for device storage, installation, and servicing across healthcare spare parts channels.
- December 2025: Nippon Express (Singapore) expanded its Tuas Global Logistics Centre by 9,200 square meters, increasing total space to 40,120 square meters with temperature-controlled facilities for medical, healthcare, and precision equipment.


Global Spare Parts Logistics Market Report Scope
The Spare Parts Logistics Market Report is Segmented by Service Type (Transportation [Road, Air, Sea, Rail], Warehousing & Distribution, Value-Added Services), Source Channel (OEM Channel, Independent Aftermarket [IAM]), End-Use Industry (Automotive, Aerospace & Defense, Electronics & Semiconductors, Industrial Machinery & Heavy Equipment, Energy & Power, Healthcare Equipment, Maritime & Shipbuilding, Others), Business Type (Business to Business [B2B], Business to Consumer [B2C]), and Geography (North America [United States, Canada, Mexico], South America [Brazil, Peru, Chile, Argentina, Rest of South America], Asia-Pacific [India, China, Japan, Australia, South Korea, South East Asia, Rest of Asia-Pacific], Europe [United Kingdom, Germany, France, Spain, Italy, BENELUX, NORDICS, Rest of Europe], Middle East and Africa [United Arab Emirates, Saudi Arabia, South Africa, Nigeria, Rest of Middle East And Africa]). The Market Forecasts are Provided in Terms of Value (USD Billion).
| Transportation | Road |
| Air | |
| Sea | |
| Rail | |
| Warehousing & Distribution | |
| Value-Added Services |
| OEM Channel |
| Independent Aftermarket (IAM) |
| Automotive |
| Aerospace & Defense |
| Electronics & Semiconductors |
| Industrial Machinery & Heavy Equipment |
| Energy & Power |
| Healthcare Equipment |
| Maritime & Shipbuilding |
| Others |
| Business to Business (B2B) |
| Business to Consumer (B2C) |
| North America | United States |
| Canada | |
| Mexico | |
| South America | Brazil |
| Peru | |
| Chile | |
| Argentina | |
| Rest of South America | |
| Asia-Pacific | India |
| China | |
| Japan | |
| Australia | |
| South Korea | |
| South East Asia (Singapore, Malaysia, Thailand, Indonesia, Vietnam, and Philippines) | |
| Rest of Asia-Pacific | |
| Europe | United Kingdom |
| Germany | |
| France | |
| Spain | |
| Italy | |
| BENELUX (Belgium, Netherlands, and Luxembourg) | |
| NORDICS (Denmark, Finland, Iceland, Norway, and Sweden) | |
| Rest of Europe | |
| Middle East and Africa | United Arab of Emirates |
| Saudi Arabia | |
| South Africa | |
| Nigeria | |
| Rest of Middle East And Africa |
| By Service Type | Transportation | Road |
| Air | ||
| Sea | ||
| Rail | ||
| Warehousing & Distribution | ||
| Value-Added Services | ||
| By Source Channel | OEM Channel | |
| Independent Aftermarket (IAM) | ||
| By End-Use Industry | Automotive | |
| Aerospace & Defense | ||
| Electronics & Semiconductors | ||
| Industrial Machinery & Heavy Equipment | ||
| Energy & Power | ||
| Healthcare Equipment | ||
| Maritime & Shipbuilding | ||
| Others | ||
| By Business Type | Business to Business (B2B) | |
| Business to Consumer (B2C) | ||
| By Geography | North America | United States |
| Canada | ||
| Mexico | ||
| South America | Brazil | |
| Peru | ||
| Chile | ||
| Argentina | ||
| Rest of South America | ||
| Asia-Pacific | India | |
| China | ||
| Japan | ||
| Australia | ||
| South Korea | ||
| South East Asia (Singapore, Malaysia, Thailand, Indonesia, Vietnam, and Philippines) | ||
| Rest of Asia-Pacific | ||
| Europe | United Kingdom | |
| Germany | ||
| France | ||
| Spain | ||
| Italy | ||
| BENELUX (Belgium, Netherlands, and Luxembourg) | ||
| NORDICS (Denmark, Finland, Iceland, Norway, and Sweden) | ||
| Rest of Europe | ||
| Middle East and Africa | United Arab of Emirates | |
| Saudi Arabia | ||
| South Africa | ||
| Nigeria | ||
| Rest of Middle East And Africa | ||


Key Questions Answered in the Report
What is the spare parts logistics market size in 2025 and the forecast for 2031?
The spare parts logistics market size was USD 49.22 billion in 2025 and is projected to reach USD 65.47 billion by 2031 at a 4.89% CAGR.
Which region holds the largest share of the spare parts logistics market?
Asia-Pacific led with 38.21% of 2025 revenue and is expected to grow at a 5.21% CAGR, supported by automotive, electronics, and aerospace value chains.
Which end-use vertical is the largest in the spare parts logistics market?
Automotive accounted for 49.12% of demand in 2025, driven by extended fleet lifecycles and the growth of electric powertrains that require specialized logistics.
What capabilities are most important for winning contracts in the spare parts logistics market?
High fill rates, accurate lead times, sector certifications, and integrated visibility platforms are critical, especially where uptime guarantees and regulated handling are required.
How are regulations shaping healthcare equipment flows in the spare parts logistics market?
The United States FDA implemented the Quality Management System Regulation in 2026 that aligns with ISO 13485:2016, raising expectations for storage, installation, and servicing practices across healthcare logistics.
What strategic moves signal consolidation in the spare parts logistics market?
DSV’s acquisition of DB Schenker and Echo Global Logistics’ acquisition of ITS Logistics show how providers are scaling integrated, tech-enabled platforms to support multi-country and multi-modal service commitments.
Page last updated on:


