
Market Overview
| Study Period | 2020 - 2031 |
|---|---|
| Forecast Data Period | 2026 - 2031 |
| Base Year Market Size (2025) | USD 62.37 Billion |
| Market Size (2026) | USD 64.74 Billion |
| Market Size (2031) | USD 78.01 Billion |
| Growth Rate (2026 - 2031) | 3.80 % |
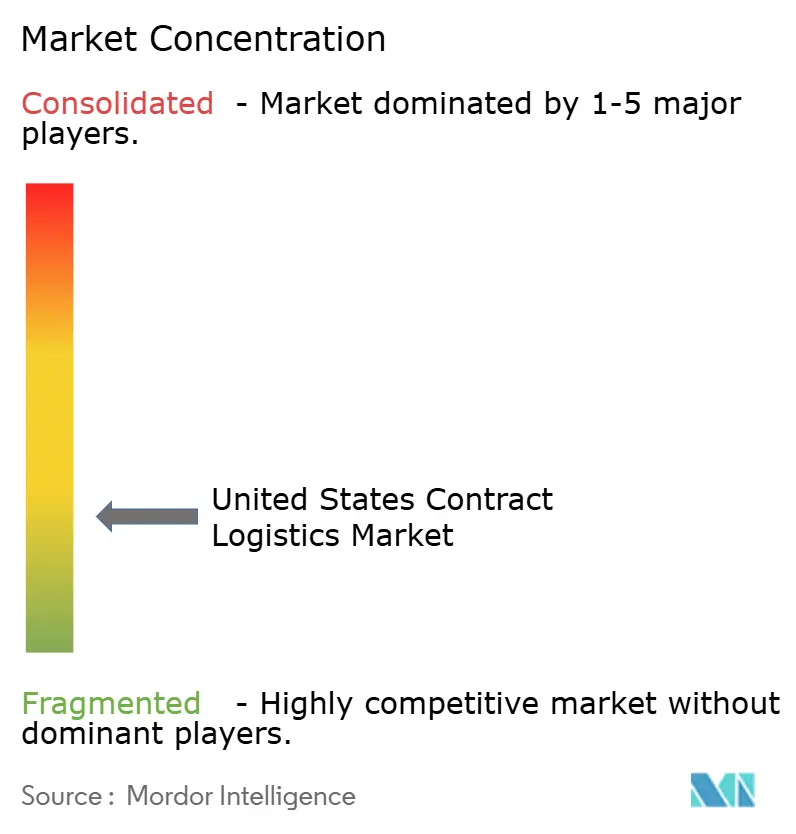
| Market Concentration | Low |
Major Players *Disclaimer: Major Players sorted in no particular order Image © Mordor Intelligence. Reuse requires attribution under CC BY 4.0. | |
United States Contract Logistics Market Analysis by Mordor Intelligence
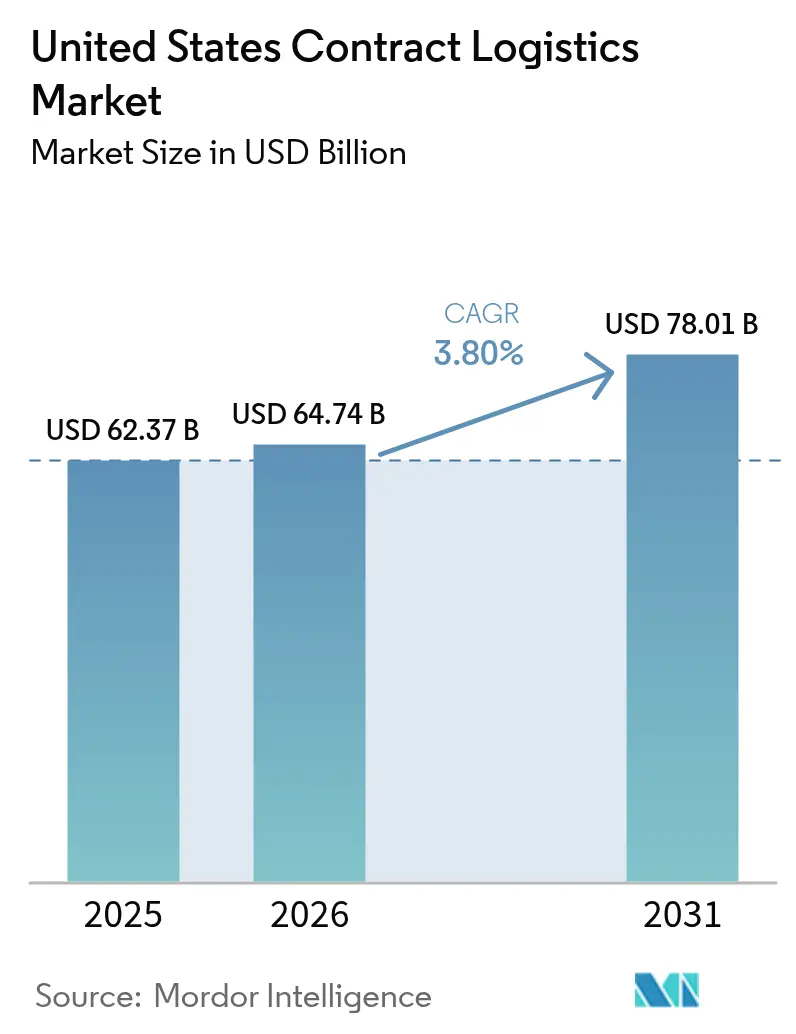
The United States Contract Logistics Market size was valued at USD 62.37 billion in 2025 and estimated to grow from USD 64.74 billion in 2026 to reach USD 78.01 billion by 2031, at a CAGR of 3.80% during the forecast period (2026-2031).
The United States contract logistics market as a maturing arena where profitability hinges more on efficiency than on sheer shipment volume. Ongoing migration from in-house operations to outsourced models accelerates demand, especially as manufacturers adopt Build-to-Order strategies and retailers confront an unrelenting wave of reverse-logistics traffic sparked by e-commerce returns. Near-shoring to Mexico, the largest U.S. trading partner in 2024 with USD 839.9 billion in bilateral flows, reconfigures cross-border networks and underscores the geographic breadth of the United States contract logistics market. Simultaneously, Amazon’s USD 4 billion rural-delivery build-out, slated to triple its delivery-station count by 2026, is redefining last-mile economics in non-urban zones. Automation investments—from warehouse robotics to AI-enabled orchestration—now generate the lion’s share of productivity gains as providers anticipate labor shortages and rising cybersecurity compliance costs.
Key Report Takeaways
- By service type, transportation captured 64.35% of the United States contract logistics market share in 2025. Warehousing & Distribution is projected to advance at a 3.12% CAGR through 2031.
- By contract duration, above-3-year agreements accounted for 54.35% of the United States contract logistics market size in 2025 and are forecast to grow at a 3.63% CAGR through 2031.
- By end user, retail & e-commerce maintained 25.60% revenue share in 2025; healthcare & pharmaceuticals are poised to expand at 4.02% CAGR through 2031.
Note: Market size and forecast figures in this report are generated using Mordor Intelligence’s proprietary estimation framework, updated with the latest available data and insights as of 2026.
United States Contract Logistics Market Trends and Insights
Drivers Impact Analysis*
| Driver | (≈) % Impact on CAGR Forecast | Geographic Relevance | Impact Timeline |
|---|---|---|---|
| Explosive e-commerce fulfillment demand | +1.2% | National; Southeast Golden Triangle | Short term (≤ 2 years) |
| Surge in cold-chain & healthcare logistics | +0.8% | National metros | Medium term (2-4 years) |
| Automation-first warehouses & AI orchestration | +0.6% | National hubs | Long term (≥ 4 years) |
| Near-shoring to Mexico boosting cross-border flows | +0.5% | Southwest border corridor | Medium term (2-4 years) |
| OEM shift to Build-to-Order models | +0.4% | Midwest and Southeast | Medium term (2-4 years) |
| Exploding reverse-logistics volumes | +0.3% | National e-commerce nodes | Short term (≤ 2 years) |
| Source: Mordor Intelligence | |||
Explosive e-commerce fulfillment demand
Persistent online shopping makes inventory velocity a year-round constraint. Amazon delivered more than 9 billion items via same-day and next-day services in 2024, a 30% year-over-year jump[1]. Rural penetration covering 4,000+ small towns reshapes network topology, compelling contractors to craft micro-fulfillment and flexible capacity models. Walmart’s closure of a legacy fulfillment site while opening automated centers that cut 12 process steps to 5 shows how speed trumps footprint. DOT hours-of-service regulations further dictate route planning, forcing compliance-aligned shifts in facility location. The United States contract logistics market continues to funnel capital into real-time visibility and short-haul transport solutions that shrink order-to-delivery windows.
Surge in cold-chain & healthcare logistics
DHL’s USD 1.1 billion North American outlay illustrates how temperature-controlled know-how has evolved into an entry barrier[2]. Acquisitions such as Cryopdp, which handles 600,000 clinical-trial moves yearly, exemplify the push toward white-glove services for cell-and-gene therapies requiring sub-zero maintenance. The FDA Good Distribution Practice mandates now attach steep penalties to temperature excursions, compelling providers to deploy IoT sensors and redundant power. The United States contract logistics market, therefore, prizes GDP-certified space and trained personnel, with cold-chain square footage like Cold Zone’s 170,000-sq-ft Springfield site signaling further expansion.
Automation-first warehouses & AI orchestration
Productivity gains stem from orchestration software that blends people, mobile robots, and fixed automation. Amazon’s Proteus AMRs and Cardinal sorters illustrate multi-class robotics integration. GXO’s partnership with Blue Yonder spans 1,000+ sites and underlines the software’s role in lowering variable cost per unit. Robotics-as-a-Service models open the technology door for mid-tier firms, although technical-integration talent remains scarce. The United States contract logistics market increasingly rewards providers that convert automation data into real-time labor, cube, and routing optimization.
Near-shoring to Mexico boosting cross-border flows
U.S.–Mexico trade volumes underscore structural supply-chain realignment, lifting cross-border trucking and intermodal demand. BMW’s USD 800 million battery plant adjacent to San Luis Potosí assembly lines typifies OEMs co-locating parts and final-assembly sites across the border. The CP-KC rail merger provides a single-line network from Canada to Mexico, further integrating North American freight paths. Compliance with USMCA rules of origin plus Mexican labor standards favors incumbents that already field bilingual brokerage and bonded-warehouse capacity within the United States contract logistics market.
Restraints Impact Analysis*
| Restraint | (≈) % Impact on CAGR Forecast | Geographic Relevance | Impact Timeline |
|---|---|---|---|
| Acute warehouse & driver labor shortages | -0.9% | Midwest and Southeast | Short term (≤ 2 years) |
| Fuel-price and freight-rate volatility | -0.6% | National | Short term (≤ 2 years) |
| Coastal port realignments creating network risk | -0.4% | East and West Coast | Medium term (2-4 years) |
| Rising cybersecurity & data-privacy costs | -0.3% | Major logistics hubs | Long term (≥ 4 years) |
| Source: Mordor Intelligence | |||
Acute warehouse & driver labor shortages
FMCSA English-proficiency rules, effective June 2025, risk sidelining 10% of drivers, lifting tender rejections, and tightening capacity. Transportation and warehousing hiring added 14,000 positions in July 2024, yet 51% driver turnover undermined headcount stability. Wage inflation persists as Amazon’s rural delivery wages far exceed federal minimums. Shortfalls are profound in CDL-A and hazmat-certified positions, directly constraining healthcare and chemical freight lanes within the United States contract logistics market.
Fuel-price and freight-rate volatility
Despite 2024 diesel falling to USD 0.553 per mile, total operating cost hit USD 2.26 per mile as equipment and financing expenses climbed[3]. California diesel could top USD 6.00 per gallon after July 2025 tax hikes, adding regional complexity. Flat tonnage indices curb carriers’ ability to levy surcharges, compressing margins for contract logistics operators locked into fixed-rate agreements scattered across the United States contract logistics market.
*Our forecasts treat driver/restraint impacts as directional, not additive. The impact forecasts reflect baseline growth, mix effects, and variable interactions.
Segment Analysis
By Service Type: Transportation Dominance Faces Automation Pressure
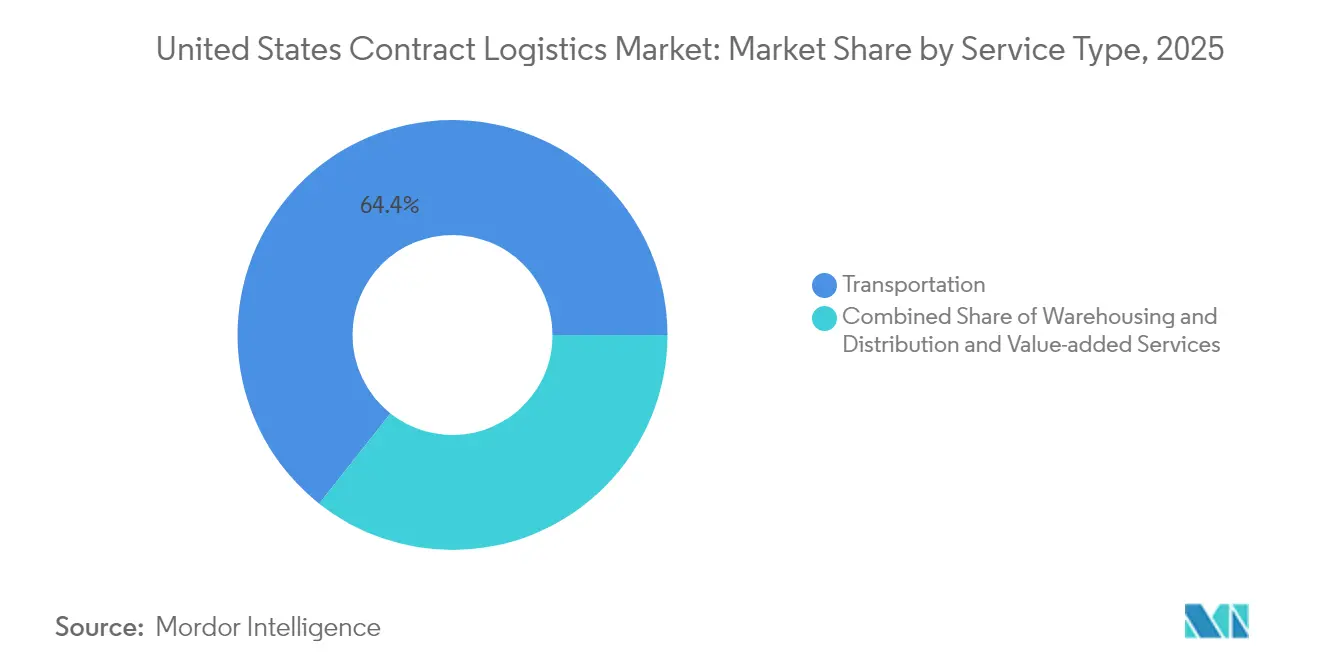
Transportation claims 64.35% of the United States contract logistics market share in 2025, buoyed by road carriers that moved 72.2% of U.S.–Mexico freight. Yet, warehousing & distribution is growing faster at 3.12% CAGR as e-commerce demands distributed inventory that elevates storage-and-pick services. Rail’s single-line Canada-to-Mexico network following the CP-KC merger improves intermodal reliability, although market power concentration may raise rates. Air lifts time-sensitive cargo but remains vulnerable to fuel swings. Sea lanes gain from port upgrades but confront labor-automation gridlock.
Warehouse square footage receives disproportionate capital as automation boosts pick rates and slot-density. Amazon’s shift from March Air Reserve Base to San Bernardino proves network fluidity. Veritiv’s USD 60 million AmeriPac buy points to a strong appetite for value-added kitting, assembly, and postponement processes that lock in customers during seasonal bursts. These services carry higher margins than pure transport and reduce revenue volatility across the United States contract logistics market.

By Contract Duration: Long-term Partnerships Accelerate
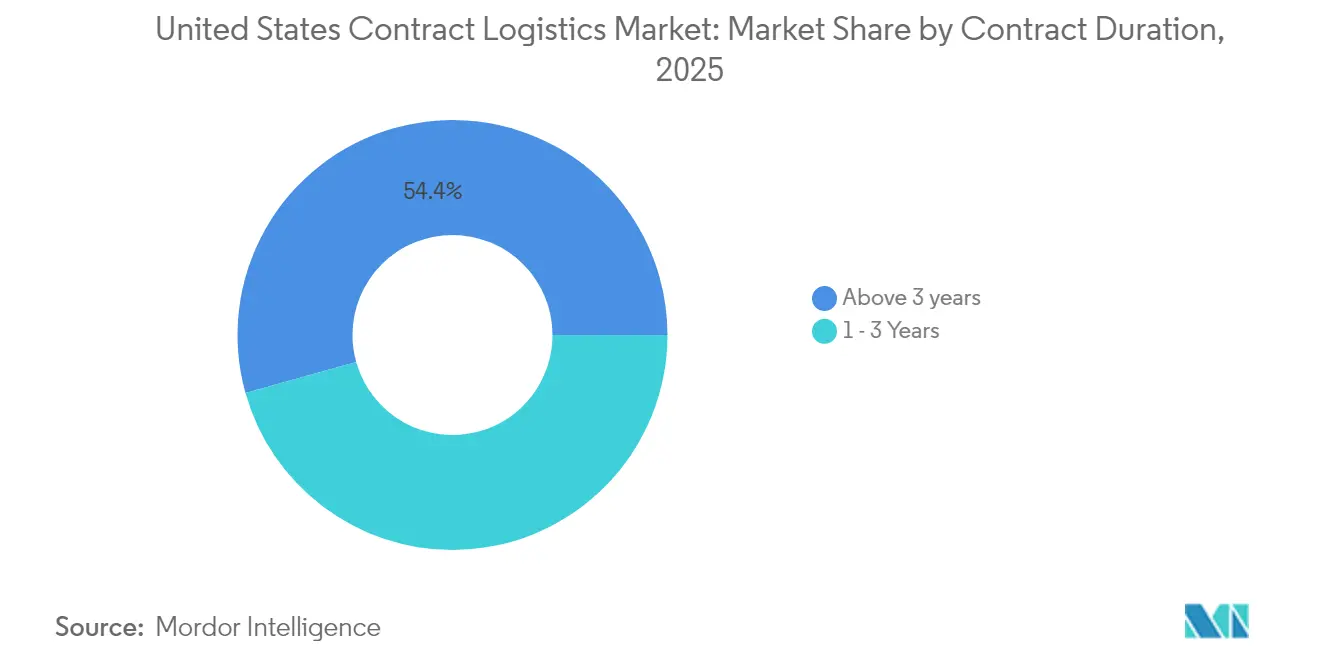
Above-3-year contracts held 54.35% share of the United States contract logistics market size in 2025 and are tracking 3.63% CAGR, demonstrating shippers’ appetite for strategic continuity under supply-chain volatility. DHL’s multi-year Blue Yonder deployment exemplifies long-cycle automation ROI that only extended deals justify. Capital-intensive cold-chain nodes also rely on durable revenue streams.
Contracts of 1-3 years still attract firms piloting new regions or coping with cyclical peaks, yet growth lags as performance risk looms. DoD’s cancellation of its Global Household Goods Contract illustrates the disruption risk in shorter deals. OEM margin pressures push Build-to-Order strategies, needing deep provider collaboration over multiple years. The tilt toward longer commitments effectively raises market entry barriers within the United States contract logistics market.
By End-User Industry: Healthcare Leads Growth Acceleration
Healthcare & pharmaceuticals is the fastest riser at 4.02% CAGR, propelled by biologics and aging demographics that require GDP-certified storage. DHL’s plan to grow healthcare revenue 50% by 2030 through USD 1.1 billion in regional investments validates the sector’s pull. Cryogenic therapies demand constant -150 °C environments, compelling real-time telemetry and specialized packaging.
Retail & e-commerce retains the highest revenue at 25.60%, driven by omni-channel fulfillment complexity. Manufacturing & automotive gains from near-shored component flows, yet compressing OEM margins spur cost-sharing models. Food & beverage benefits from cold-chain densification, such as Coca-Cola’s USD 17 million Waco hub. Chemicals trade bolsters hazmat niches where compliance acumen matters. Together, these trends diversify the United States contract logistics market and cushion sectoral slowdowns.
Geography Analysis
The Southeast “Golden Triangle” dominates the United States contract logistics market, lying within a day’s drive of 70% of the population and over half of the national GDP. Five of seven Class I railroads cross the region, underpinning resilient intermodal options. Favorable labor costs and proliferating manufacturing projects make the corridor a magnet for warehouse construction and automation integrations.
Texas anchors Southwest momentum as the principal gateway for USD 839.9 billion in U.S.–Mexico trade, reinforcing demand for customs-bonded facilities and bilingual brokerage. Load balancing between Laredo and alternative ports of entry strains drayage capacity, triggering Ryder’s expanded yard supporting 250,000 annual border moves.
Regulatory Landscape
US contract logistics providers operate under a multi-agency compliance stack spanning procurement, transportation safety, trade, and modal oversight. For government freight and managed transportation tied to federal contracting, FAR Subpart 47.3 and DFARS Part 247 define transportation requirements and shape how 3PL/4PL roles are contracted and audited, while MARAD Cargo Preference rules extend US-flag vessel usage obligations through subcontracted supply-chain tiers on covered shipments. On the trucking side, FMCSA rules governing hours of service and credentialing directly affect network planning and carrier qualification, with a March 2026 final rule tightening issuance integrity for non-domiciled commercial driver credentials and increasing vetting requirements.
Trade and rail policy introduce additional variability that ripples into cross-border and intermodal contract structures. In February 2026, a time-bound 10% ad valorem import surcharge (150 days) and evolving CBP tariff schedules added new cost-to-serve considerations for shippers and their logistics partners, raising the value of rapid customs, duty, and routing optimization. For rail-linked contract logistics, the Surface Transportation Board in January 2026 advanced an NPRM (Docket No. EP 788) to replace existing intramodal rail competition rules with a more case-by-case approach, increasing uncertainty for long-duration intermodal commitments and reciprocal switching assumptions. Separately, USTRs scheduled July 2026 USMCA review creates a defined policy milestone for North American network design and compliance readiness along the US-Mexico corridor.
Value Chain Analysis
The United States contract logistics value chain begins with shipper procurement and solution design (network engineering, service-level definition, and contracting), then moves into inbound transportation, port/terminal handling, and customs brokerage for import flows, followed by warehousing and distribution (receiving, storage, pick/pack, and cross-dock). Value-added services such as kitting, labeling, postponement, and returns processing connect directly to retail and e-commerce inventory velocity, while sector-specific handling (GDP-oriented healthcare, temperature control, hazmat) increases process depth and compliance touchpoints. Execution is coordinated through TMS/WMS layers and visibility platforms that connect shippers, carriers, and facilities, with performance shaped by labor availability, equipment capacity, and corridor-specific constraints.
Bottlenecks and infrastructure constraints materially influence cost and lead-time along this chain. ATRIs 2026 analysis catalogs 325+ freight chokepoints and reports average peak-hour truck speeds of 33.2 mph (down 2.8% year over year), reinforcing the need for multi-node distribution, resilient routing, and appointment discipline at facilities and terminals.
Competitive Landscape
Market concentration remains moderate, with global integrators and technologically advanced specialists setting the competitive agenda. DHL’s acquisition of Inmar catapults it atop reverse-logistics rankings while its healthcare outlays deepen vertical integration. GXO’s enterprise-wide Blue Yonder rollout showcases software-centric competitiveness, whereas Amazon’s robotics stack demonstrates scale advantages in multi-class automation.
DSV’s EUR 14.3 billion (USD 14.9 billion) purchase of DB Schenker doubles revenue, forging the world’s largest logistics provider and raising competitive benchmarks for integrated services. FedEx’s planned spinoff of its LTL unit indicates a strategic refocus, potentially inviting acquirers to consolidate line-haul capacity. Regional operators, exemplified by Patton Logistics Group, continue bolt-on acquisitions to reach density thresholds that enable dedicated fleets and shared automation.
Strategic whitespace surfaces in cold-chain, hazardous materials, and AI-orchestrated micro-fulfillment. UPS’s MedSpeed buyout augments its healthcare footprint. Penske and Werner expand dedicated automotive and regional facilities to secure OEM contracts. The United States contract logistics market consequently rewards providers that blend compliance readiness, technology acumen, and geographic reach.
United States Contract Logistics Industry Leaders
-
DHL Supply Chain
-
XPO Logistics
-
GXO Logistics
-
Ryder Supply Chain Solutions
-
FedEx Logistics
- *Disclaimer: Major Players sorted in no particular order
Market Opportunities and Future Outlook
Opportunity is concentrated where shippers are actively funding new nodes, automation, and compliance-ready operations rather than simply buying linehaul. Large, purpose-built distribution projects signal demand for contract logistics design-build-operate models: Amazon announced a 1-million-sq-ft distribution center in New Kent, Virginia (June 2026), and McKesson selected Moore, Oklahoma for a 330,000-sq-ft automated regional distribution center to modernize pharmaceutical distribution (June 2026). These moves create whitespace for providers that can stand up facilities quickly, integrate automation with WMS/TMS, and deliver regulated handling (especially in healthcare and pharmaceuticals) alongside returns and value-added services.
Public programs and corridor investments also open addressable needs in network resiliency and productivity. The US Department of Transportation released the 2026 National Freight Strategic Plan (May 2026), and in July 2026 announced USD 1.73 billion in BUILD grants for 127 projects, including USD 62 million specifically for truck parking across five states, reinforcing focus on surface-freight efficiency and safety constraints that affect driver utilization and on-time performance. Port and regional infrastructure modernization, including California's Port and Freight Infrastructure Program award of USD 383 million to the Port of Long Beach, supports throughput and emissions-related upgrades that contract logistics providers can pair with drayage, transload, and near-port warehousing. In parallel, trade-policy complexity in 2026 elevates demand for tariff-aware planning, brokerage, and bonded solutions, particularly for US-Mexico flows already reconfiguring cross-border networks.
Recent Industry Developments
- July 2026: Maersk announced a USD 100 million investment in a 617,000-square-foot fulfillment hub in Hopedale, Massachusetts, scheduled to open in late August 2026. The site expands Northeast delivery capacity and increases competitive pressure on regional warehousing and distribution providers to match throughput, automation readiness, and service levels.
- May 2026: DHL eCommerce entered an exclusive, multi-year last-mile parcel delivery agreement with the United States Postal Service, expanding nationwide residential delivery capacity and strengthening carrier partnerships in end-to-end contract logistics for e-commerce shippers.
- June 2024: Ryder opened a 228,000-sq-ft warehouse and expanded its Nuevo Laredo drayage yard to support about 250,000 annual border moves. The expansion adds capacity along the US-Mexico corridor, where near-shoring and higher cross-border complexity are pushing demand for bonded operations, yard management, and bilingual brokerage-linked services.
Research Methodology Framework and Report Scope
Market Definition and Coverage
This market covers paid contract logistics services delivered by third-party providers in the United States, where a shipper outsources activities like warehousing and distribution, transportation execution, and selected value-added logistics under a contract.
Scope exclusions (for this sizing): In-house logistics run fully by shippers, parcel carrier line-haul revenue, and pure freight forwarding booked as pass-through without contracted logistics execution are not counted.
Segmentation Overview
- By Service Type
- Transportation
- Road
- Rail
- Air
- Sea
- Warehousing & Distribution
- Value-added Services (Assembly, Labelling, Kitting)
- Transportation
- By Contract Duration
- 1 – 3 Years
- Above 3 years
- By End-user Industry
- Manufacturing & Automotive
- Food & Beverage
- Retail & E-commerce
- Healthcare & Pharmaceuticals
- Chemicals
- Other Industries
Data Sources, Market Sizing, and Validation
Desk Research
Desk research starts by building a fact base on U.S. freight activity and warehousing demand, and then mapping it to outsourced service intensity. We relied on public inputs such as the US Census Bureau (trade and business activity releases), Bureau of Transportation Statistics, Bureau of Labor Statistics, US International Trade Commission data, and Federal Maritime Commission materials for port and ocean shipping context.
To make the model more realistic, we also reviewed company filings and investor presentations for service-mix clues, capacity and footprint signals, and pricing commentary, along with trade association publications and reputable logistics press for contract trend checks. In several iterations, subscription databases for company financials and news, import and export shipment-level records, and logistics supply chain and freight rate series were used to cross-check volumes and rate direction. The sources listed here are illustrative, and other public and paid references were also used for data collection, validation, and clarification.
Primary Interviews and Surveys
Primary work focused on interviews and short surveys with logistics service providers, shipper-side logistics leaders, warehouse operations specialists, and transportation procurement teams across the United States. We used these conversations to confirm outsourcing shares, typical contract structures, warehouse rate movement, and how value-added services are attached and priced alongside base warehousing and transport work.
Distribution of primary research fieldwork respondents
| Company type | Respondent position |
|---|---|
| Top tier: 35% | CXOs: 15% |
| Mid tier: 49% | Functional/Unit leaders: 37% |
| Smaller Players: 16% | Managers: 48% |
Market-Sizing & Forecasting
Sizing begins with a top-down build where U.S. freight and warehousing activity is translated into an addressable outsourced spend pool, followed by filters for contract logistics penetration by shipper type and service line. We then corroborate using selective bottom-up checks, including sampled provider revenue ranges by service, sanity checks on warehouse square footage handled under contract, and spot validations of average rate cards tied to throughput.
Inputs used in the model include warehouse capacity and utilization direction, truckload and intermodal activity indicators, import and export container flow signals, labor cost inflation for warehousing roles, and contract mix shifts toward multi-year managed solutions. Since demand can move quickly when inventory cycles change, scenario analysis was used for the forecast, with assumptions refined through what interviewees expected for retail and e-commerce volumes, industrial replenishment, and transportation procurement behavior. Where a bottom-up cross-check had gaps, such as limited visibility on smaller regional providers, we applied conservative coverage factors and then revisited them during validation.
Data Validation & Update Cycle
Validation is done through several passes where model outputs are compared with independent indicators, including freight indices direction, port and trade activity, warehouse employment trends, and public financial commentary about logistics outsourcing. If an outlier shows up by year or by service component, we recheck assumptions, and we place follow-up calls to confirm what actually changed in pricing or volumes.
Before sign-off, another analyst reviews the full chain from inputs to outputs so arithmetic and logic issues are caught early. The report is refreshed annually, and interim updates are made when major events materially change rates, capacity, or demand. Right before delivery, a final quick update pass is completed so clients receive the latest view available at that time.
Mordor Intelligence's United States Contract Logistics Market Sizing Compared With Other Published Estimates
Published market sizes for U.S. contract logistics often vary because the included service basket is not consistent, and because revenue can be counted at different points across the logistics chain. Differences also show up when some studies use gross revenue definitions, different base years, or apply faster price escalators without reconciling them to freight and warehousing activity.
One common gap is that broader estimates fold in most third-party logistics revenue, including large domestic transportation management and international forwarding-linked revenue streams. In Mordor Intelligence, the estimate is kept closer to contracted logistics execution such as warehousing and distribution, transportation tied to those contracts, and value-added logistics, which helps reduce double counting when the same shipment is touched by multiple intermediaries.
Benchmark comparison
| Source | Market Size | Gaps in Research Methodology |
|---|---|---|
| Mordor Intelligence | USD 62.37 B (2025) | |
| Industry Association A | USD 323.40 B (2025) | Uses a broad 3PL or contract logistics gross revenue construct that includes domestic transportation management, international transportation management, and dedicated contract carriage, which expands scope beyond contracted logistics execution revenue counted in this study. |
| Global Consultancy B | USD 139.66 B (2024) | Uses a different base year and a wider inclusion of transportation, fulfillment, and supply chain outsourcing revenue, and may apply generalized pricing uplift assumptions that are not consistently reconciled to U.S. freight and warehousing activity signals. |
The spread in the table is mostly explained by scope and revenue counting choices, not by a single right or wrong number. By tying the estimate to observable warehousing and freight activity, then checking outsourcing penetration and pricing through interviews, we keep the total traceable to clear drivers that can be reviewed and updated.
Key Questions Answered in the Report
What is the current value of the United States contract logistics market?
The sector is valued at USD 64.74 billion in 2026.
How fast is the sector expected to grow through 2031?
A forecast CAGR of 3.80% should lift revenue to USD 78.01 billion by 2031.
Which service type is expanding quickest?
Warehousing & distribution is projected to post the fastest growth at 3.12% CAGR.
Why are longer-term contracts gaining traction?
Shippers seek supply-chain stability and ROI on automation, boosting above-3-year agreements to 54.35% share.
Which end-user vertical shows the strongest momentum?
Healthcare & pharmaceuticals leads with an anticipated 4.02% CAGR, reflecting cold-chain demand.
How is near-shoring influencing U.S. logistics networks?
U.S.–Mexico trade of USD 839.9 billion in 2024 is shifting capacity toward the Southwest corridor.