In-plant Logistics Market Size and Share
Market Overview
| Study Period | 2020 - 2031 |
|---|---|
| Market Size (2026) | USD 21.39 Billion |
| Market Size (2031) | USD 30.35 Billion |
| Growth Rate (2026 - 2031) | 7.24% CAGR |
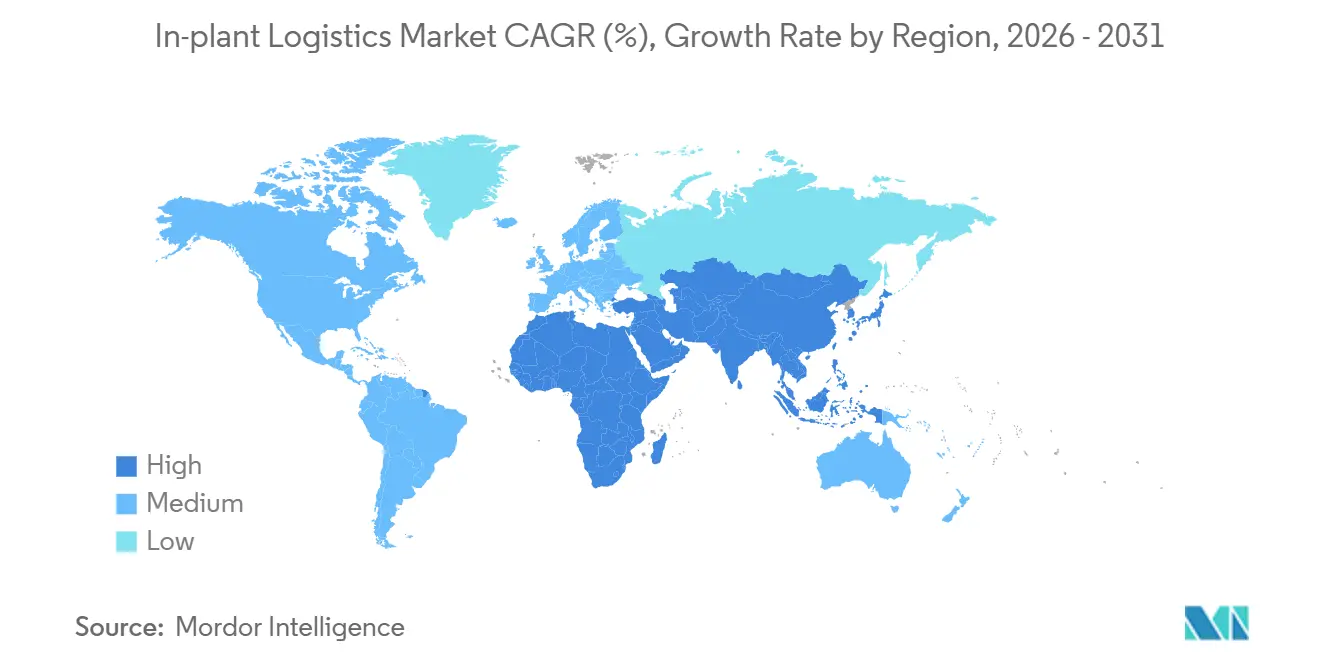
| Fastest Growing Market | Asia Pacific |
| Largest Market | Asia Pacific |
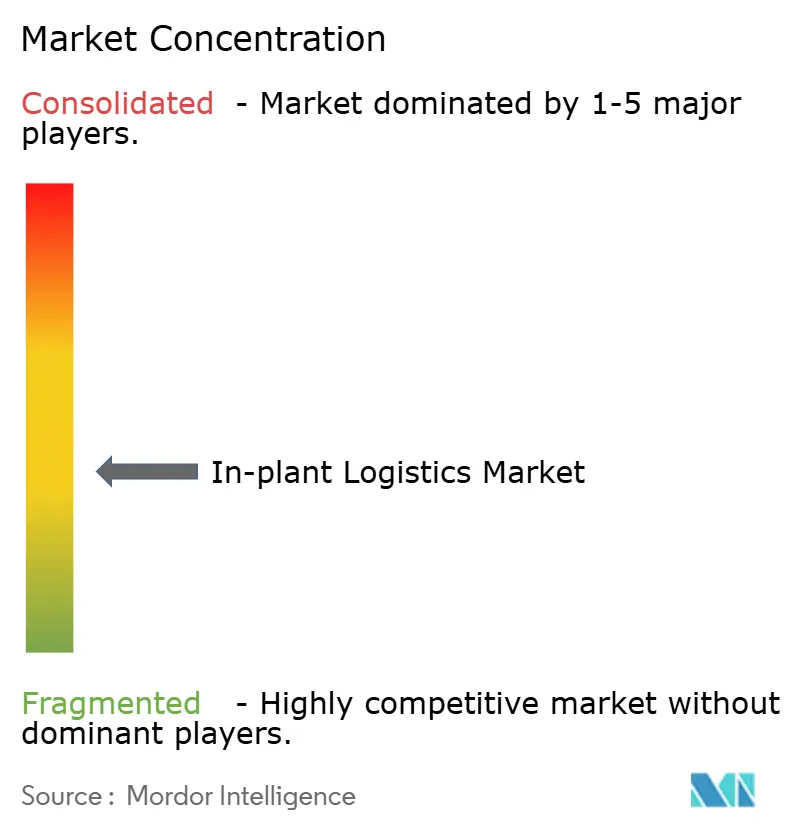
| Market Concentration | Medium |
Major Players
*Disclaimer: Major Players sorted in no particular order Image © Mordor Intelligence. Reuse requires attribution under CC BY 4.0. |
|
In-plant Logistics Market Analysis by Mordor Intelligence
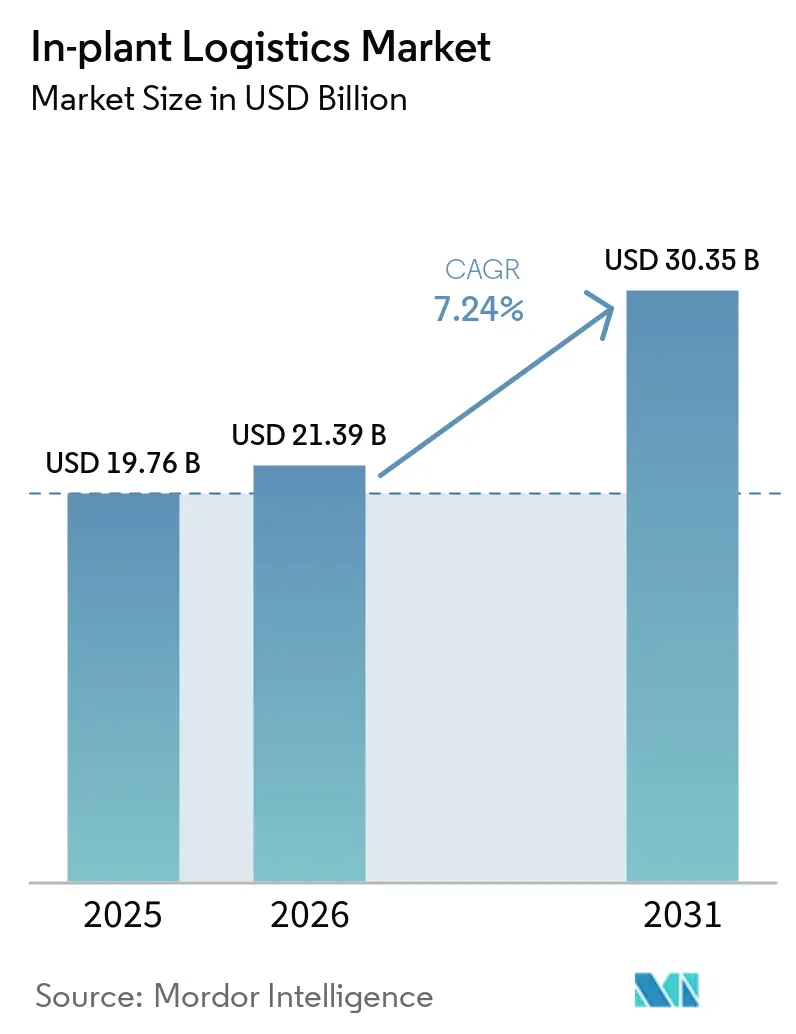
The in-plant logistics market size is projected to expand from USD 19.76 billion in 2025 and USD 21.39 billion in 2026 to USD 30.35 billion by 2031, registering a 7.24% CAGR between 2026 and 2031.
Manufacturers are converging warehouse, manufacturing, and transport execution systems, while brand-owner Scope-3 mandates transform formerly internal cost centers into contract-critical compliance platforms. Robotics-as-a-service converts heavy capital expenditure into variable fees, 5G private networks synchronize fleets in real time, and tokenized green financing lowers borrowing costs for energy-efficient equipment. Asia Pacific leads adoption on the back of 10,000+ factory private-5G rollouts and Indian production-linked incentives; North America and Europe follow, driven by near-shoring and carbon-border adjustments. Competitive intensity is moderate as established operators acquire specialists and robotics entrants expand through pay-per-pick models.
Key Report Takeaways
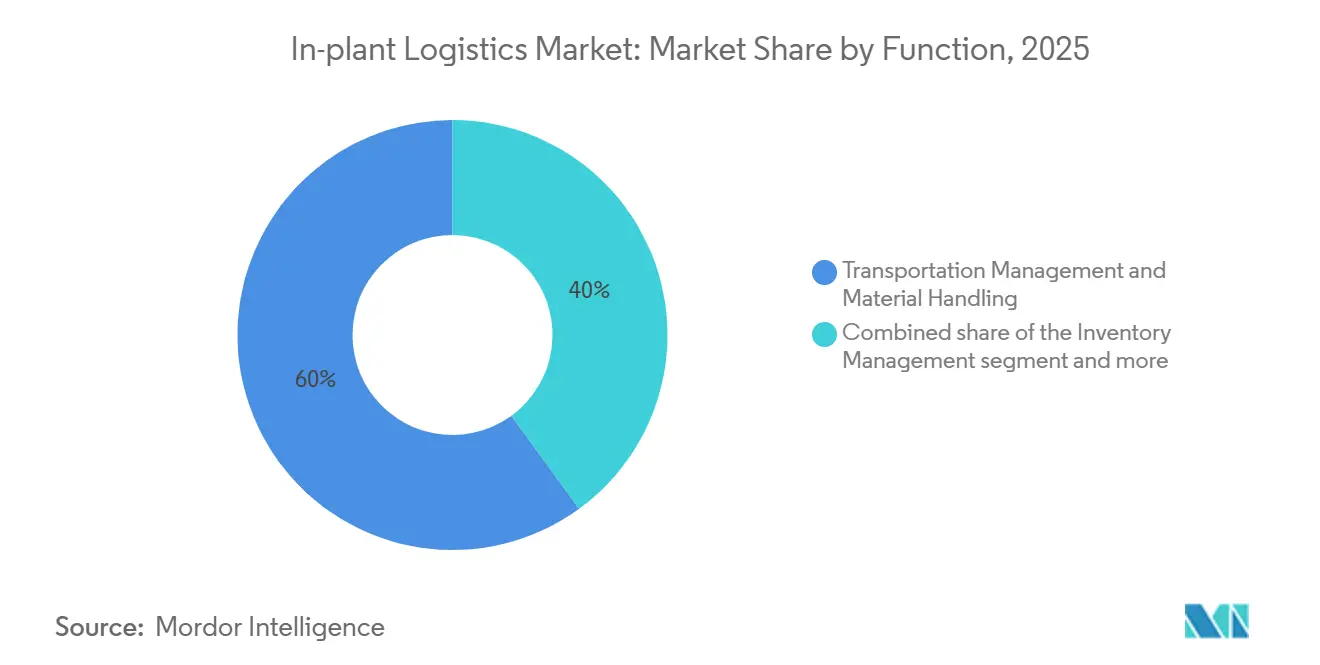
- By function, transportation management and material handling held 60.03% of the in-plant logistics market share in 2025, while value-added services are forecast to accelerate at an 8.77% CAGR through 2031.
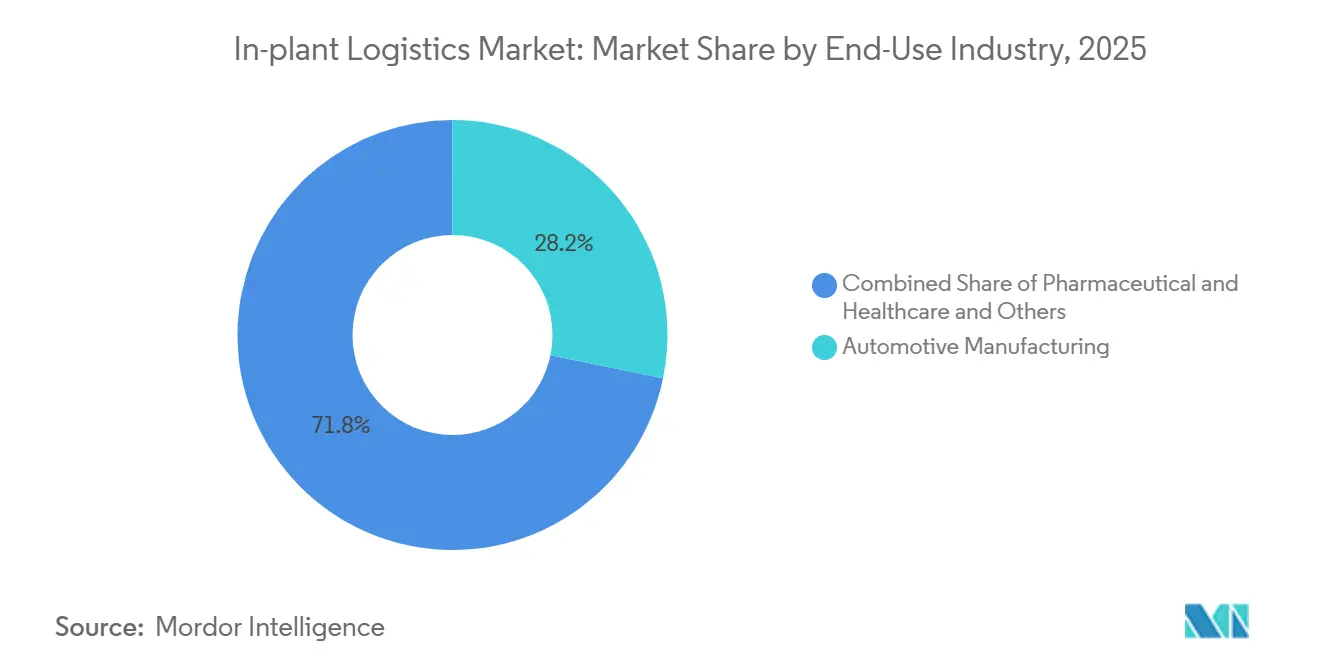
- By end-use, automotive manufacturing commanded 28.23% of the in-plant logistics market share in 2025, whereas pharmaceuticals and healthcare are projected to advance at an 8.22% CAGR to 2031.
- By plant size, large-scale facilities retained a 53.84% share in 2025, yet small-scale facilities are set to expand at a 7.89% CAGR during 2026-2031.
- Asia Pacific captured 36.51% of 2025 revenue and is projected to progress at an 8.41% CAGR, outpacing all other regions.
Note: Market size and forecast figures in this report are generated using Mordor Intelligence’s proprietary estimation framework, updated with the latest available data and insights as of January 2026.
Global In-plant Logistics Market Trends and Insights
Drivers Impact Analysis*
| Driver | (~) % Impact on CAGR Forecast | Geographic Relevance | Impact Timeline |
|---|---|---|---|
| Mandatory Scope-3 traceability demands from brand-owners | +1.6% | Global; EU, North America lead | Medium term (2-4 years) |
| Accelerating payback on goods-to-person robotics | +1.9% | Global; strongest in electronics, pharma | Short term (≤2 years) |
| Global roll-out of 5G private networks | +1.4% | APAC core, spill-over to NA & EU | Medium term (2-4 years) |
| Convergence of WMS, MES & TMS suites | +1.2% | Global; early adopters in digitally mature regions | Long term (≥4 years) |
| Sensor-level energy harvesting for IoT | +0.6% | Global high-throughput sites | Long term (≥4 years) |
| Tokenized ESG-linked financing | +0.5% | EU first movers, NA catching up | Long term (≥4 years) |
| Source: Mordor Intelligence | |||
Mandatory Scope-3 Traceability Demands From Brand-Owners
Corporate sustainability directives taking effect in 2024 are reshaping supply chains by requiring independently verified Scope 3 emissions disclosures. This is pushing suppliers to gain far deeper visibility into their operations, capturing granular data such as energy use, transport distances, and packaging across every in-plant movement. At the same time, regulatory frameworks like pharmaceutical track-and-trace are converging with sustainability goals, encouraging more integrated, transparent execution systems. Together, these shifts signal a broader transition toward data-driven, end-to-end accountability where environmental impact, product integrity, and operational transparency are managed within unified digital ecosystems.
Accelerating Payback on Goods-to-Person Robotics Under High-Mix, Low-Volume Production
Modular cube-storage and mobile-robot systems are rapidly lowering the barrier to warehouse automation, with deployments now measured in weeks rather than months and returns realized in well under two years even for highly complex SKU environments. Solutions like AutoStore dramatically increase storage density while minimizing human movement, while providers such as Geek+ are scaling globally to deliver near-perfect accuracy in demanding sectors like pharmaceuticals. Taken together, these technologies reflect a shift toward flexible, high-precision fulfillment models that prioritize speed, space efficiency, and reliability without requiring massive upfront transformation[1]“AutoStore System Overview”, AutoStore, autostoresystem.com.
Global Roll-Out of 5G Private Networks Enabling Real-Time Fleet Orchestration
Private 5G networks are rapidly becoming a backbone of next-generation industrial operations, enabling ultra-low latency and highly reliable connectivity that supports precise, real-time control of autonomous systems like AGVs. This level of performance allows factories to move toward more deterministic, synchronized workflows where machines, sensors, and software operate seamlessly together. At advanced sites such as Bosch’s Reutlingen plant, large-scale device connectivity is already demonstrating how resilient, high-availability networks can underpin mission-critical manufacturing processes[2]“5G Campus Network for Industry 4.0”, Bosch, bosch.com.
Convergence of WMS, MES & TMS Into Unified Execution Suites
Tighter integration between warehouse management and production systems is helping organizations reduce excess inventory while improving flow across the value chain. Platforms like SAP Extended Warehouse Management enable closer synchronization with manufacturing, allowing companies to shrink buffer stock without compromising service levels. Similarly, Oracle Fusion Cloud SCM brings planning and execution onto a unified data model, making it easier to coordinate inbound materials, production sequencing, and outbound distribution in a more holistic, responsive way. Together, these approaches reflect a shift toward fully connected, end-to-end supply chain orchestration.
Restraints Impact Analysis*
| Restraint | (~) % Impact on CAGR Forecast | Geographic Relevance | Impact Timeline |
|---|---|---|---|
| Shrinking production-floor footprints | -0.9% | Urban plants worldwide | Short term (≤2 years) |
| Firmware obsolescence across multi-vendor fleets | -0.7% | Legacy-automation facilities | Medium term (2-4 years) |
| Volatility in lithium-iron-phosphate prices | -0.6% | Global AGV users | Short term (≤2 years) |
| Scarcity of TÜV-certified cobot trainers | -0.5% | EU, North America | Long term (≥4 years) |
| Source: Mordor Intelligence | |||
Shrinking Production-Floor Footprints Constraining Conveyor Retrofits
Urban manufacturing sites are increasingly constrained by significantly smaller footprints, making traditional straight-line material handling systems like conveyors impractical. This spatial pressure is driving greater adoption of flexible, space-efficient solutions such as autonomous mobile robots and vertical lift modules, which can navigate tighter layouts and maximize vertical storage. As a result, facility design is shifting toward more adaptive, high-density configurations that prioritize maneuverability and vertical optimization over linear flow.
Persistent Firmware Obsolescence Across Multi-Vendor Fleets
Limited support windows of 7-10 years are creating growing challenges in industrial environments, where multiple generations of equipment often coexist. As older systems fall out of support, they become harder to patch and secure, increasing exposure to cyber risks and operational vulnerabilities. This dynamic is forcing companies into premature controller upgrades or full system replacements, driving up the total cost of ownership and complicating long-term maintenance strategies.
*Our forecasts treat driver/restraint impacts as directional, not additive. The impact forecasts reflect baseline growth, mix effects, and variable interactions.
Segment Analysis
By Function: Value-Added Services Redefine Competitive Boundaries
Transportation Management and Material Handling accounted for 60.03% of the in-plant logistics market share in 2025, underpinned by increasingly autonomous fleets and AI route optimization. Yet the Value-Added Services segment covering kitting, postponement, and co-packing is forecast to post an 8.77% CAGR through 2031, outpacing core conveyance tasks as manufacturers push final-product customization closer to order receipt. The segment’s rise mirrors brand strategies that hold semi-finished inventory and configure region-specific SKUs at the last mile, curbing obsolescence and aligning with Scope-3 reduction goals. Pharmaceutical contract packagers now integrate serialization, language labeling, and temperature sensors within the same flow, transforming logistics halls into regulated production extensions and lifting the in-plant logistics market devoted to value-add tasks. Integration with unified execution suites ensures serialized data flows to downstream regulators without manual hand-offs, meeting DSCSA and EU FMD dictates. Investments in right-size packaging algorithms trim corrugate by 15%, evidencing synergy between cost and carbon goals.
Second paragraph continues: WMS-embedded transport orchestration balances energy use with throughput, and RFID-enabled inventory controls deliver sub-second location granularity. Convergence also raises cross-skill demand; technicians must master co-packing robotics alongside AGV fleet software. Providers bundling these services capture stickier contracts, as customers depend on specialized capabilities that would require lengthy internal certifications. Consequently, the in-plant logistics market sees a tilt from asset bulk to process intelligence, redefining competitive moats for the decade ahead.


By End-Use Industry: Pharmaceutical Compliance Drives Technology Adoption
Automotive lines still commanded 28.23% of the in-plant logistics market size in 2025 through entrenched just-in-sequence operations, yet pharmaceuticals and healthcare are on track for the fastest 8.22% CAGR. Serialization rules oblige unit-level identifiers and custody chains from receipt to ship point, propelling adoption of real-time location systems, cold-chain monitors, and audit-ready data lakes. These investments elevate the in-plant logistics market from regulated sectors as CapEx spends flow toward compliance assurance over pure labor savings. Simultaneously, electronics fabs, energized by CHIPS-Act incentives, demand ISO 14644-compliant robotics that minimize particulate risks while handling USD 10,000 wafers. Food and beverage processors add IoT temperature beacons to avert spoilage, and chemical plants retrofit intrinsically safe AGVs for ATEX zones, cumulatively broadening the addressable scope[3]"Drug Supply Chain Security Act", FDA, fda.gov.
Complementary paragraph: The compliance gradient reshapes vendor propositions. Providers boasting GMP-validated software gain entry where generic WMS platforms fall short, and cold-chain certifications open doors to biopharma campaigns. Automotive remains a volume anchor, yet energy-efficiency retrofits and battery-module kitting for electric vehicles refresh its demand profile. Metals and heavy machinery players adopt regenerative cranes and fleet electrification to align with ESG-linked financing covenants, underscoring the shared thread of carbon accountability across dissimilar industries.
By Plant Size: Modularity Democratizes Advanced Automation
Large-scale facilities captured 53.84% of the in-plant logistics market in 2025, but Small-scale Facilities are rising at a 7.89% CAGR as plug-and-play robotics shatter historical volume thresholds. Cube-storage grids furnish 4× capacity within tight city footprints, letting sub-10,000 m² factories reach world-class pick rates without conveyors. This shift expands the in-plant logistics market addressable by vendors previously focused on mega-sites. Medium sites mix owned core assets with subscription robots during seasonal peaks, spreading capital load while maintaining responsiveness.
Large campuses still dominate multi-building orchestration, integrating rail sidings, cross-docks, and outdoor yards. Yet the scale premium narrows as AI scheduling and 5G connectivity let smaller plants coordinate dozens of mobile units with latency once available only to flagship complexes. Financial democratization via sustainability-linked loans further levels the field, as interest reductions close ROI gaps for SMEs adopting green logistics assets.
Geography Analysis
Asia-Pacific combined a 36.51% in-plant logistics market share with an 8.41% CAGR, underpinned by China’s goal of fully automated factories and India’s production-linked incentives that subsidize robotics purchases. Chinese automotive plants are shifting from manual pallet trains to 5G-enabled AGVs that sustain 24/7 assembly without wage escalation. Vietnam and Thailand attract electronics relocations, boosting demand for modular conveyor cells deployable in leased facilities. Regional governments also sponsor workforce reskilling programs so technicians can manage multi-brand robot fleets.
Asia Pacific is propelled by China’s 10,000+ private 5G factories and India’s Industry 4.0-dependent incentives. New Southeast Asian greenfields embed advanced automation from day zero, benefiting from clear-sheet layouts that streamline flows. North America follows with CHIPS-Act and pharma reshoring outlays exceeding USD 200 billion, prioritizing resilient supply chains over pure labor cost arbitrage. Mexico’s near-shore surge demands bi-national TMS links that align United States component feeds with Mexican assembly gates[4]"CHIPS for America", NIST, nist.gov .
Europe’s carbon-border measures and Corporate Sustainability Reporting Directive push firms toward energy-intensive transparency, making unified execution suites a compliance necessity. Germany’s OPC-UA leadership and 5G expansions compress integration costs, the UK rebuilds aerospace and life-science capacity under divergent regulations, and Southern Europe leverages specialty goods where handling precision overrides volume.

Competitive Landscape
Competition is moderate. Global integrators such as Kuehne+Nagel augmented their footprint by acquiring IMC Logistics for USD 800 million, widening drayage penetration. Asset-light disruptors offer robotics-as-a-service, charging per pick and flattening capital barriers. Software now eclipses square footage as the prime differentiator; unified execution suites forge customer lock-in through data continuity. Mid-market pharma and electronics firms become the hottest battleground, where regulatory traceability outstrips legacy warehouse capabilities.
Edge-enabled 5G networks provide fresh performance lanes, forcing incumbents to retrofit Wi-Fi estates or concede latency advantages. ESG-linked financing introduces a parallel front, rewarding demonstrable kilowatt-hour savings with cheaper debt, favoring providers that bake energy dashboards into proposals.
White-space opportunities persist in small and medium factories where modular robotics delivers sub-two-year paybacks. Incumbents that blend physical assets with cloud orchestration and sustainability metrics are positioned to capture this long-tail, while pure-play freight brokers lacking in-plant depth risk marginalization.
In-plant Logistics Industry Leaders
-
Daifuku Co., Ltd.
-
SSI Schaefer Group
-
Vanderlande Industries
-
Honeywell Intelligrated
-
KION Group
- *Disclaimer: Major Players sorted in no particular order

Recent Industry Developments
- January 2026: AutoStore announced expansion of automation capacity with Arvato in the UK, increasing cube storage capacity by over 30 % within three months to support greater fulfillment demand.
- October 2025: AutoStore partnered with Veloq on a new Vienna fulfillment center automation project, scaling real time, flexible grid automation for grocery operations.
- March 2025: KION expanded this collaboration by demonstrating physical AI integration at CeMAT Shanghai 2025, highlighting real time AI optimization across automated forklifts, robots, and digital twin workflows.
- February 2025: DACHSER rolled out a blockchain track-and-trace network for GDP-compliant European pharma lanes.


Global In-plant Logistics Market Report Scope
| Transportation Management and Material Handling |
| Inventory Management |
| Packaging and Labeling Operations |
| Valud-Added Services |
| Automotive Manufacturing |
| Electronics and Semiconductor |
| Pharmaceuticals and Healthcare |
| Food and Beverage |
| Chemical and Petrochemical |
| Metals and Heavy Machinery |
| Others (Aerospace, Consumer Goods, etc.) |
| Small-scale Facilities |
| Medium Facilities |
| Large Scale Facilities |
| North America | United States |
| Canada | |
| Mexico | |
| South America | Brazil |
| Peru | |
| Chile | |
| Argentina | |
| Rest of South America | |
| Asia-Pacific | India |
| China | |
| Japan | |
| Australia | |
| South Korea | |
| Southeast Asia (Singapore, Malaysia, Thailand, Indonesia, Vietnam, and Philippines) | |
| Rest of Asia-Pacific | |
| Europe | United Kingdom |
| Germany | |
| France | |
| Spain | |
| Italy | |
| BENELUX (Belgium, Netherlands, and Luxembourg) | |
| NORDICS (Denmark, Finland, Iceland, Norway, and Sweden) | |
| Rest of Europe | |
| Middle East and Africa | United Arab Emirates |
| Saudi Arabia | |
| South Africa | |
| Nigeria | |
| Rest of Middle East and Africa |
| By Function | Transportation Management and Material Handling | |
| Inventory Management | ||
| Packaging and Labeling Operations | ||
| Valud-Added Services | ||
| By End-use Industry | Automotive Manufacturing | |
| Electronics and Semiconductor | ||
| Pharmaceuticals and Healthcare | ||
| Food and Beverage | ||
| Chemical and Petrochemical | ||
| Metals and Heavy Machinery | ||
| Others (Aerospace, Consumer Goods, etc.) | ||
| By Plant/Facility Size | Small-scale Facilities | |
| Medium Facilities | ||
| Large Scale Facilities | ||
| By Geography | North America | United States |
| Canada | ||
| Mexico | ||
| South America | Brazil | |
| Peru | ||
| Chile | ||
| Argentina | ||
| Rest of South America | ||
| Asia-Pacific | India | |
| China | ||
| Japan | ||
| Australia | ||
| South Korea | ||
| Southeast Asia (Singapore, Malaysia, Thailand, Indonesia, Vietnam, and Philippines) | ||
| Rest of Asia-Pacific | ||
| Europe | United Kingdom | |
| Germany | ||
| France | ||
| Spain | ||
| Italy | ||
| BENELUX (Belgium, Netherlands, and Luxembourg) | ||
| NORDICS (Denmark, Finland, Iceland, Norway, and Sweden) | ||
| Rest of Europe | ||
| Middle East and Africa | United Arab Emirates | |
| Saudi Arabia | ||
| South Africa | ||
| Nigeria | ||
| Rest of Middle East and Africa | ||


Key Questions Answered in the Report
How fast is the in-plant logistics market expected to grow between 2026 and 2031?
It is projected to advance at a 7.24% CAGR, rising from USD 21.39 billion in 2026 to USD 30.35 billion by 2031.
Which functional segment is expanding the quickest?
Value-Added Services, covering kitting and co-packing, are forecast at an 8.77% CAGR, outpacing traditional material handling.
Why are value-added services outpacing material handling?
Manufacturers want integrated orchestration, including kitting, labeling, and compliance documentation, to gain end-to-end visibility and reduce vendor hand-offs.
Why are pharmaceuticals a high-growth end-use segment?
Unit-level serialization and cold-chain mandates require real-time traceability and environmental control, driving rapid logistics system upgrades.
What role does 5G play in factory logistics?
Private 5G networks supply sub-10 ms latency that coordinates hundreds of autonomous vehicles, boosting throughput and reliability.
How are small factories affording advanced automation?
Robotics-as-a-service and sustainability-linked loans convert large capital outlays into manageable operating expenses with interest rebates tied to energy savings.
Page last updated on:


