Transportation Management System Market Size and Share
Market Overview
| Study Period | 2020 - 2031 |
|---|---|
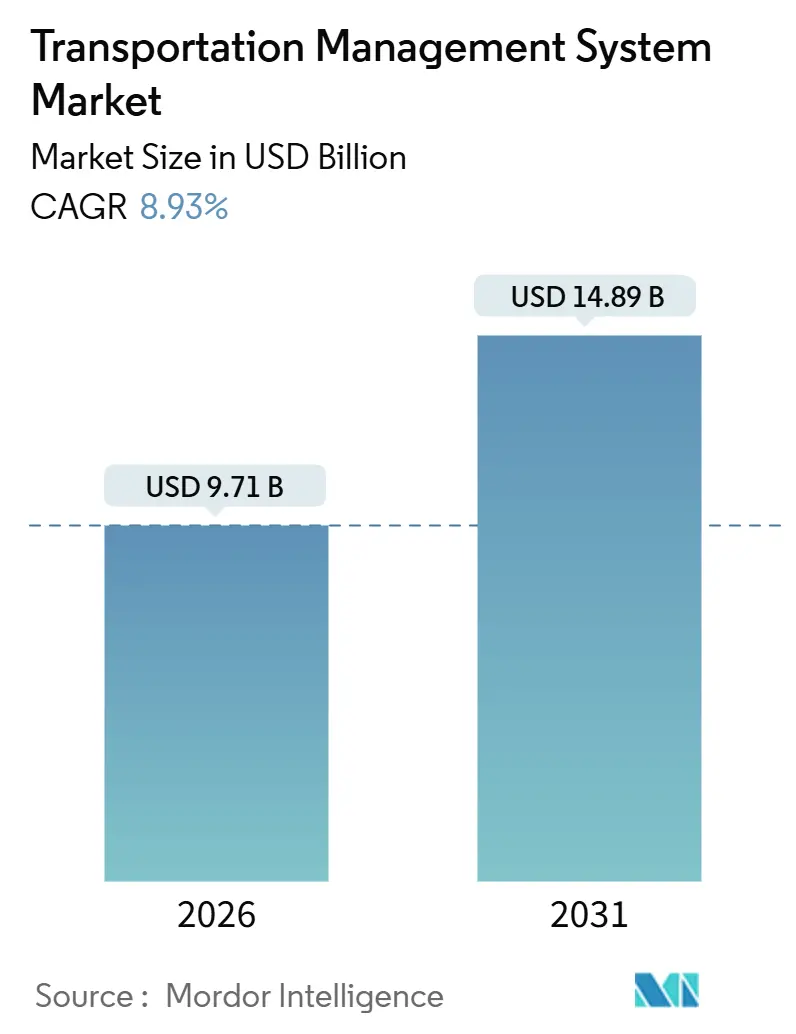
| Market Size (2026) | USD 9.71 Billion |
| Market Size (2031) | USD 14.89 Billion |
| Growth Rate (2026 - 2031) | 8.93% CAGR |
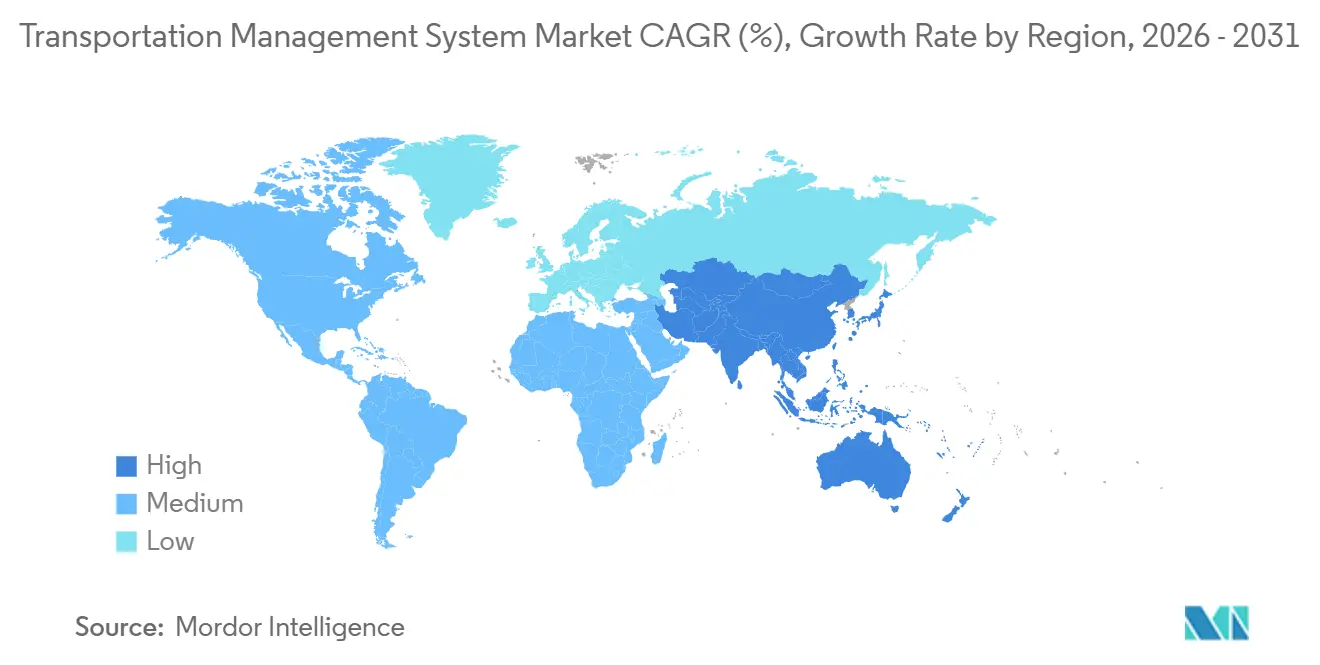
| Fastest Growing Market | Asia Pacific |
| Largest Market | North America |
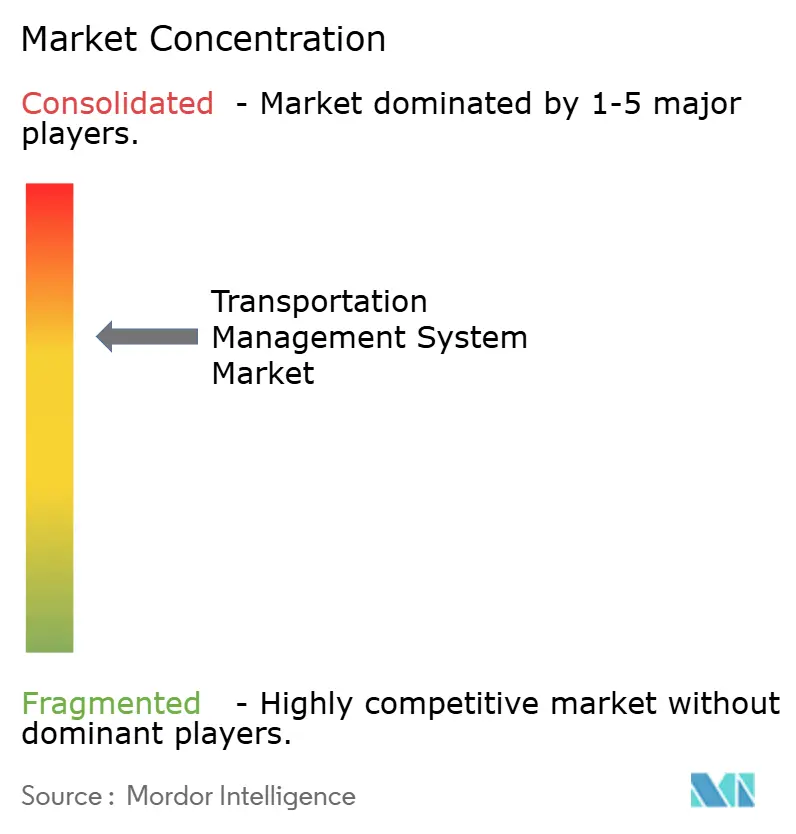
| Market Concentration | Medium |
Major Players *Disclaimer: Major Players sorted in no particular order Image © Mordor Intelligence. Reuse requires attribution under CC BY 4.0. | |
Transportation Management System Market Analysis by Mordor Intelligence
The Transportation Management System market size is USD 9.71 billion in 2026 and is projected to reach USD 14.89 billion by 2031, advancing at an 8.93% CAGR. This expansion reflects the structural move from asset-heavy coordination to cloud-native orchestration that embeds artificial intelligence, predictive routing, and real-time exception management. Cloud deployment is scaling quickly because subscription billing aligns software expense with shipment volume and because multi-tenant platforms shorten integration cycles with freight marketplaces. Real-time visibility is becoming a must-have capability as shippers seek to cut detention fees and comply with greenhouse gas disclosure rules. Regulatory mandates such as the United States electronic logging device framework and the European Union Fit for 55 package continue to push the Transportation Management System market toward comprehensive telemetry capture and shipment-level carbon reporting. Competitive intensity is rising as enterprise-resource-planning incumbents defend installed bases while modular specialists exploit faster release cadences and usage-based pricing.
Key Report Takeaways
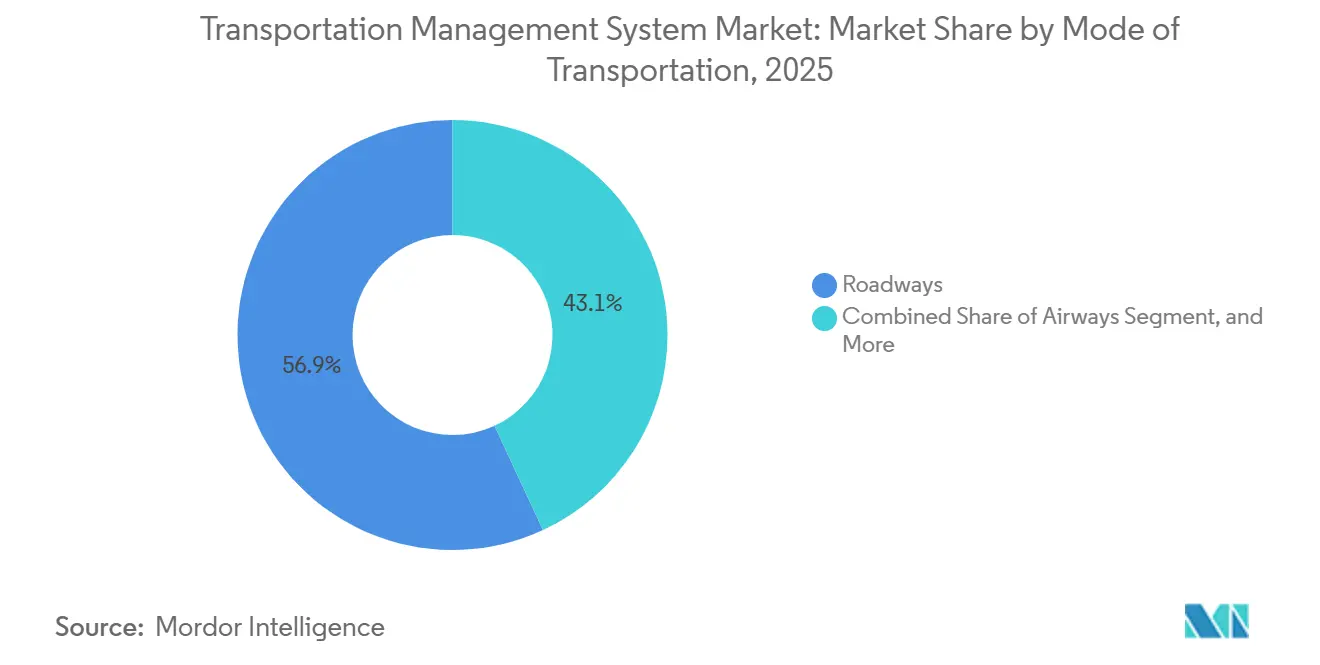
- By mode of transportation, roadways led with 56.91% revenue share in 2025, while airways are forecast to grow at a 9.83% CAGR to 2031.
- By deployment, the cloud segment held 61.23% of the Transportation Management System market share in 2025 and is expected to expand at a 9.61% CAGR through 2031.
- By enterprise size, large enterprises accounted for 66.74% of the Transportation Management System market share in 2025, whereas small and medium enterprises are advancing at a 9.67% CAGR.
- By end-user, retail and e-commerce captured 28.77% of the market in 2025, with healthcare and pharmaceuticals expected to post a 10.22% CAGR through 2031.
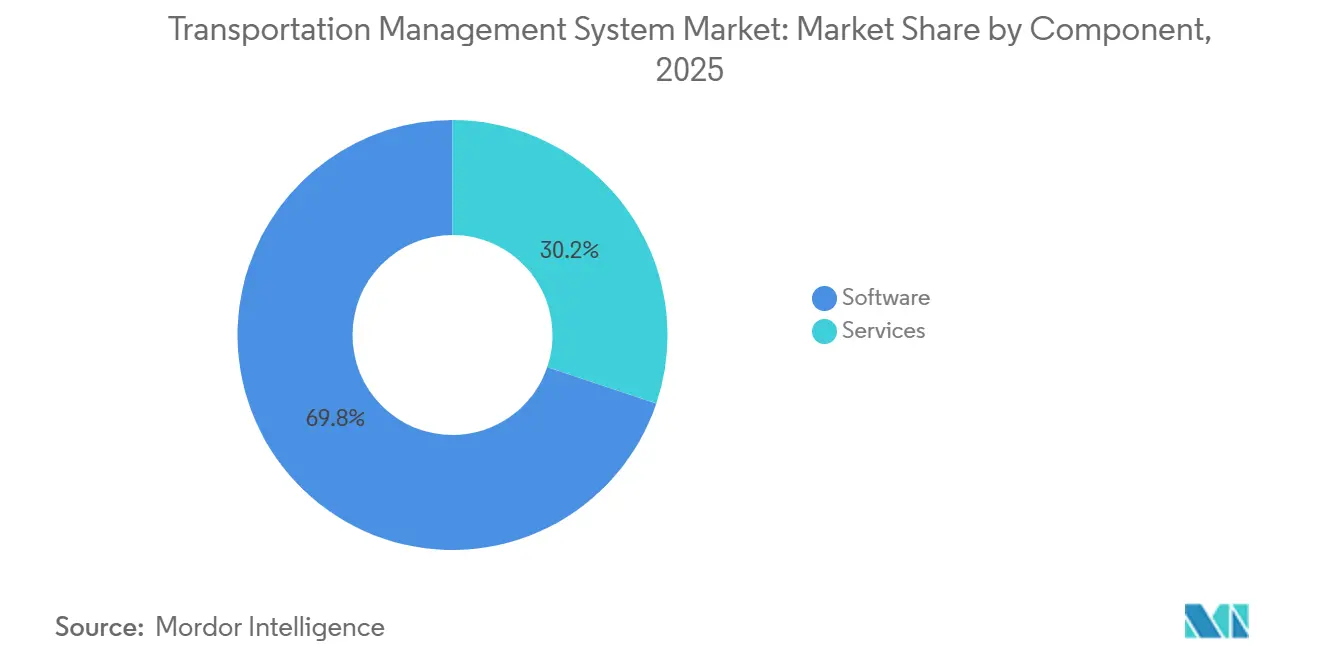
- By component, software generated 69.83% of the Transportation Management System market share in 2025, yet services are set to grow at a 9.37% CAGR.
- By application, order management led with a 27.93% share in 2025, and real-time visibility and tracking is projected to log a 9.96% CAGR through 2031.
- By geography, North America commanded a 42.67% share in 2025, while the Asia-Pacific is on track for a 9.91% CAGR during the forecast horizon.
Note: Market size and forecast figures in this report are generated using Mordor Intelligence’s proprietary estimation framework, updated with the latest available data and insights as of January 2026.
Global Transportation Management System Market Trends and Insights
Drivers Impact Analysis*
| Driver | (~) % Impact on CAGR Forecast | Geographic Relevance | Impact Timeline |
|---|---|---|---|
| Cloud-Based TMS Adoption Accelerates Cost-to-Serve Savings | +1.8% | Global, early penetration in North America and Europe | Medium term (2-4 years) |
| E-Commerce and Omnichannel Retail Demand Real-Time, Last-Mile Optimization | +1.5% | Global, urban centers in North America, Europe, Asia-Pacific | Short term (≤ 2 years) |
| AI-Driven Predictive ETA Tools Cut Detention/SLA Penalties | +1.4% | Global, high-volume lanes in North America, Europe, China | Short term (≤ 2 years) |
| Regulatory Push for ELD and Greenhouse Gas Reporting Digitalises Freight | +1.3% | North America, Europe, emerging in Asia-Pacific | Medium term (2-4 years) |
| Freight-Marketplace Convergence Enables Dynamic Capacity Procurement | +1.2% | North America and Europe core, expanding to Asia-Pacific | Medium term (2-4 years) |
| Open-Source Telemetry APIs and Microservices Unlock Modular TMS for SMEs | +1.1% | Global, accelerating in Asia-Pacific and emerging markets | Long term (≥ 4 years) |
| Source: Mordor Intelligence | |||
Cloud-Based TMS Adoption Accelerates Cost-to-Serve Savings
Multi-tenant cloud platforms deliver 15-25% freight-cost reductions by pooling shipper demand, automating carrier selection through real-time rate shopping, and scaling compute elastically during peak seasons.[1]Oracle Corporation, “Oracle Fusion Cloud Transportation Management,” oracle.com The Transportation Management System market benefits from subscription pricing, which eliminates capital expenditure and aligns vendor incentives with on-time, cost-efficient execution. Oracle and SAP migrated their routing engines to in-memory architectures in 2024, cutting plan-to-execute latency from minutes to seconds, while Blue Yonder fused demand sensing with routing decisions to proactively shift inventory, reducing stockout risk. The ability to launch new features monthly rather than annually keeps functionality current as regulations evolve. Enterprises also avoid hardware refresh cycles, channeling savings toward data-science talent and continuous improvement programs.
E-Commerce and Omnichannel Retail Demand Real-Time, Last-Mile Optimisation
Same-day delivery promises shorten planning windows from days to hours, forcing retailers to embed advanced route-resequencing logic into their Transportation Management System workflows. Amazon’s expansion of its Delivery Service Partner network to 4,500 contractors in 2024 heightened demand for light mobile interfaces that sync with consumer-facing tracking pages.[2]Amazon.com Inc., “Amazon Air Fleet Expansion,” amazon.com Route-density algorithms trimmed per-package urban delivery cost by 30-40% for high-volume shippers, a saving impossible without cloud elasticity and granular telemetry. Crowdsourced delivery models require dynamic capacity matching and real-time bidding, capabilities that legacy on-premise platforms cannot meet. Micro-fulfillment centers, typically placed within 16 km of dense population clusters, amplify the need for systems that co-optimize inventory positioning and dispatch decisions every 15-30 minutes.
AI-Driven Predictive ETA Tools Cut Detention/SLA Penalties
Detention penalties cost the United States trucking sector USD 1.2-1.8 billion annually, so shippers willingly pay for predictive ETA algorithms that alert warehouses before late arrivals.[3]Project44, “Movement Platform Carrier Integration,” project44.com Machine-learning models ingest telematics, electronic logging device data, and weather feeds to achieve 95% arrival-time accuracy. In the Transportation Management System market, these tools reduce dock congestion, improve driver utilization, and support automated appointment scheduling. Vendors differentiate on the depth of carrier integrations. Project44 connected 180 telematics providers by 2025, while Descartes built SmartWay emission calculators directly into freight-audit workflows. Predictive analytics also enable proactive re-routing, preserving service-level agreements without manual dispatcher intervention.
Regulatory Push for ELD and Greenhouse Gas Reporting Digitalises Freight
The Federal Motor Carrier Safety Administration’s electronic logging device rule created a continuous stream of driver-hours data that TMS vendors now ingest automatically. In Europe, Fit for 55 obliges fleets with more than 500 vehicles to report Scope 3 emissions, accelerating the adoption of carbon-tracking modules. China’s emerging carbon-trading pilots similarly compel carriers to instrument shipments end-to-end. Manual spreadsheets cannot meet auditor expectations for shipment-level evidence, so regulatory deadlines pull laggards into the Transportation Management System market. Vendors earn recurring fees for compliance dashboards that produce auditor-ready reports and automatically archive data for statutory periods.
Restraints Impact Analysis*
| Restraint | (~) % Impact on CAGR Forecast | Geographic Relevance | Impact Timeline |
|---|---|---|---|
| High Integration Cost with Legacy ERP/WMS Stacks | -1.2% | Global, most acute in enterprises with on-premise SAP or Oracle systems | Medium term (2-4 years) |
| Data-Security and Privacy Concerns for Cloud Deployments | -0.8% | Europe, North America, emerging in Asia-Pacific | Short term (≤ 2 years) |
| Shortage of In-House Data-Science Talent to Exploit Analytics Modules | -0.6% | Global, talent hubs in North America and select Asia-Pacific cities | Long term (≥ 4 years) |
| Fragmented Carrier-Telematics Standards Hinder Multimodal Visibility | -0.7% | Global, especially cross-border shipments | Medium term (2-4 years) |
| Source: Mordor Intelligence | |||
High Integration Cost with Legacy ERP/WMS Stacks
Enterprises running SAP ECC or Oracle E-Business Suite incur integration bills of USD 500,000 to USD 3 million when layering a cloud TMS, as legacy systems lack modern APIs. Each additional ERP instance increases complexity, as customer, product, and location master data must be bidirectionally mapped. Manhattan Associates reported an 18% year-over-year increase in professional services revenue from integration projects in 2024, underscoring this friction. Some manufacturers postpone adoption of the Transportation Management System market until broader digital transformations are complete, stretching deployment timelines by several years. The burden falls hardest on capital-intensive verticals, leaving digitally native retailers free to implement a cloud TMS in weeks.
Data-Security and Privacy Concerns for Cloud Deployments
Shippers handling pharmaceuticals, defense items, or payment data must satisfy stringent internal reviews before moving freight data off-premise. The European Union General Data Protection Regulation threatens fines of up to 4% of global turnover for violations, prompting demands for data residency and control over encryption keys. Cloud providers have earned ISO 27001 and SOC 2 certifications, but internal security teams still run penetration tests and require detailed incident-response playbooks. Perceived breach risk slows decision cycles, despite evidence that mature vendors invest more in security than most individual enterprises can afford. The Transportation Management System industry, therefore, navigates a trust gap that lengthens sales cycles but rarely results in lost deals once due diligence concludes.
*Our forecasts treat driver/restraint impacts as directional, not additive. The impact forecasts reflect baseline growth, mix effects, and variable interactions.
Segment Analysis
By Mode of Transportation: Airways Gains Momentum in a Pharma-Centric Landscape
Road freight dominated in 2025, with a 56.91% share of the Transportation Management System market, underscoring the continued primacy of truckload and less-than-truckload services for domestic distribution. Air freight, however, is recording the fastest 9.83% CAGR because pharmaceutical manufacturers have pivoted high-value biologics onto flights that cut door-to-door transit to below 48 hours, thereby curbing temperature-excursion risk. The Transportation Management System market size for air-centric workflows is expanding further as the International Air Transport Association ONE Record standard enables airlines and forwarders to expose booking and status APIs in real time. Intermodal modules that synchronize container transfers between rail and truck help sustain rail competitiveness on 1,600 km lanes, yet growth lags air because schedule rigidity limits rapid response to demand spikes. Ocean freight users rely on specialized container-tracking extensions that map vessel schedules, port congestion, and drayage appointments within a single control tower.
Air-freight technology adoption accelerated when Amazon Air grew its fleet to 110 aircraft in 2025, prompting retailers to demand minute-level status feeds for cross-border e-commerce packages. Berlin-based marketplace Cargo.one integrated with 100 airlines to create a one-click booking portal linked directly to leading TMS vendors, collapsing the traditional three-day quote cycle to seconds. Regulatory pressure intensifies uptake: the International Civil Aviation Organization CORSIA framework obliges airlines to allocate carbon emissions to shipments, so TMS modules that present emissions data alongside costs now influence carrier selection. As small shippers access instant spot capacity, network density rises, improving load factors and further enhancing the Transportation Management System market value proposition.


By Deployment: Cloud Dominates Through Elastic Scalability
Cloud solutions captured 61.23% revenue in 2025 and are outpacing alternatives at a 9.61% CAGR because pay-as-you-go billing scales with shipment counts, a decisive factor for seasonally volatile retailers. TMS customers also value monthly feature releases that deliver rapid regulatory updates and AI upgrades without downtime, a flexibility unavailable in legacy on-premise architectures. Hybrid models retain master data locally but process execution in the cloud, appealing to regulated industries that must prove data residency, yet overall growth remains slower. Vendors have begun sunsetting on-premise roadmaps; Oracle issued its final major on-premise feature pack in 2025, redirecting engineering capacity to its SaaS edition.
Blue Yonder rebuilt its Luminate suite on Microsoft Azure in 2024, stating that customers cut planning cycles by 40% and improved load consolidation by 12% within six months. Microenterprises are now viable buyers because freemium offerings from Kuebix and 3Gtms unlock entry-level functionality, with premium analytics sold à la carte. AI and machine-learning workloads leverage GPU-accelerated clusters in cloud data centers, enabling shipment-type-specific models that predict lead-time variability and carbon footprint. Security concerns continue to diminish as cloud providers pass stringent audits and as breach headlines increasingly implicate poorly patched on-premise servers. Consequently, the Transportation Management System market is tilting irreversibly toward SaaS.
By Enterprise Size: SMEs Embrace Modular SaaS for Rapid Payback
Large enterprises generated 66.74% of 2025 revenue, leveraging scale to secure volume discounts and fund global rollouts. Yet SMEs are advancing at a 9.67% CAGR, the fastest pace among size cohorts, because open-source telemetry standards published by the Open Logistics Foundation eliminate proprietary middleware costs. Microservices allow SMEs to license only what they need, route optimization today, and freight audit tomorrow, lowering total ownership to below EUR 50,000 (USD 56,000). Government vouchers, such as the European Union Digital Europe program, reimburse up to 50% of cloud software costs, accelerating uptake among small exporters.
Venture capitalists poured USD 1.8 billion into logistics technology for SMEs in 2024, affirming the segment's upside. SMEs benefit from marketplace integrations because they lack leverage to negotiate contract rates and therefore appreciate instant spot tenders that surface hidden capacity. Vendors respond by embedding guided workflows and pre-built dashboards that surface actionable insights without dedicated analysts. While the Transportation Management System market size from large enterprises remains greater, revenue diversification shields suppliers from cyclical shocks in any single vertical. Micro enterprises, those moving fewer than 1,000 loads annually, are now targetable thanks to usage-based billing that charges pennies per transaction and eliminates sticker shock.

By End-User Industry: Healthcare Leads Growth on Serialization Mandates
Retail and e-commerce accounted for 28.77% in 2025, as omnichannel fulfillment models rely on continuous route resequencing and last-mile density optimization. Healthcare and pharmaceuticals, however, are registering a 10.22% CAGR through 2031, the fastest across verticals, propelled by Drug Supply Chain Security Act serialization and temperature-controlled freight requirements. Cold-chain shipments can account for 10% of drug costs, so even small routing gains deliver meaningful margin protection. McKesson invested USD 120 million in transportation management and track-and-trace systems in 2024 to comply with audit-trail requirements and reduce recall exposure. Food and beverage shippers adopt blockchain interfaces to meet consumer demand for transparency into provenance, whereas automotive manufacturers embed control-tower apps to mitigate semiconductor shortages.
Third-party logistics providers exploit configurable TMS platforms to orchestrate multi-client networks, adding customs and freight-audit modules as value-added services. Manufacturers with just-in-time production models rely on predictive arrival alerts to prevent assembly-line stoppages, embedding risk buffers into routing logic. The Transportation Management System market, therefore, diversifies across verticals, but healthcare maintains outsized momentum because liability for temperature excursions or counterfeit drugs is substantial, creating non-negotiable compliance budgets.
By Component: Services Grow on Integration Complexity
Software generated 69.83% of revenue in 2025, yet services are expanding at a 9.37% CAGR as enterprises demand consulting and integration to mesh cloud TMS with warehouse management, customs, and trade compliance systems. Implementation engagements can equal initial license value, especially when global network rollouts require data harmonization across dozens of countries. Descartes disclosed a 22% jump in professional services bookings during fiscal 2024 as customers sought expertise in carbon calculation and customs filing. Subscription models shift vendor income from upfront license fees to recurring support, creating durable annuity streams.
Support services include continuous configuration tuning, API monitoring, and user enablement workshops. AI-infused modules drive new consulting work because training prediction models demands historical shipment data cleansing and parameter optimization. Vendors are bundling managed analytics into tiered support plans, effectively offering data-science as a service. Consequently, the Transportation Management System industry is evolving toward a hybrid value proposition where software and services intertwine to sustain long-term customer success.
By Application: Visibility Surges as Shippers Monetize Detention Savings
Order management led with a 27.93% share in 2025, digitizing tendering and carrier acceptance. Real-time visibility and tracking, however, is growing at a 9.96% CAGR as shippers monetize detention avoidance and customer-experience gains. Project44’s Movement hub polls truck GPS every 15 minutes and predicts arrival within two-hour windows for 90% of loads, enabling precise dock scheduling. Route optimization holds a sizable slice because volatile diesel prices and driver shortages force carriers to eliminate empty miles. Freight audit modules detect duplicate charges and unauthorized accessorials, recovering millions for high-volume shippers.
Warehouse-integration use cases rise as control-tower concepts mature. Trimble’s integration between its TMS and leading warehouse-management suites automatically triggers replenishment orders when inventory levels drop, reducing safety stock levels. ESG reporting adds momentum; regulators now expect shipment-level carbon footprints, so visibility dashboards overlay emissions and cost to guide mode decisions. As a result, the Transportation Management System market size allocated to analytics and reporting continues to climb.
Geography Analysis
North America held the largest regional share in 2025 at 42.67% of the Transportation Management System market, thanks to mature e-commerce penetration, stringent enforcement of electronic logging devices, and a fragmented carrier base that intensifies orchestration complexity. Growth steadies as adoption reaches saturation, yet revenue expands from premium AI features, autonomous-vehicle integrations, and carbon-optimization modules. Asia-Pacific advances at a 9.91% CAGR through 2031, led by China’s mandate to trim logistics costs by 10% and India’s e-way bill system that compels digital freight paperwork. Provincial subsidies in China reimburse up to 30% of software costs for carriers adopting certified TMS, while India’s fragmented fleet of 12 million small truckers finds value in marketplace integrations that lower empty-mile ratios from 40% to 25%.
Europe holds a substantial slice, with Germany, France, and the United Kingdom embracing TMS to address cross-border customs complexity and the Fit for 55 carbon-reporting mandates. Vendors with native multilingual interfaces and VAT-compliant invoicing gain an edge. The Middle East and Africa region, particularly the United Arab Emirates and Saudi Arabia, invests in customs-clearance automation to diversify economies; DP World’s 2024 rollout of Oracle Transportation Management across global terminals cut container dwell times by 18%. South America confronts integration cost headwinds and currency volatility, yet Brazilian and Argentine carriers adopt lightweight route-optimization apps to offset diesel inflation. Japan’s aging driver workforce is pushing fleets toward AI-assisted dispatching to reduce overtime, reinforcing local demand.
Venture capital inflows add fuel: Asia-Pacific logistics-tech startups raised USD 4.2 billion in 2024, ensuring a pipeline of localized innovations. Government blueprints, such as Malaysia’s National Logistics Plan and Australia’s Freight and Supply Chain Strategy, layer grants and tax deductions on top of venture backing, accelerating small-enterprise adoption.

Competitive Landscape
The Transportation Management System market remains moderately fragmented, with the top 10 vendors accounting for roughly 57% of 2025 revenue, leaving significant room for regional and vertical specialists. ERP incumbents SAP and Oracle protect their installed bases by bundling TMS modules with finance and procurement suites, while best-of-breed vendors such as Blue Yonder, Descartes, and Manhattan Associates differentiate through faster release cycles and modular architectures that do not require full ERP upgrades. Freight-marketplace platforms, including Uber Freight and Project44, are embedding execution and visibility tools natively, forcing traditional suppliers to publish open APIs that let shippers source spot capacity without leaving the planning screen.
Strategic activity has intensified since 2024. Oracle added real-time data feeds from more than 200 ocean, air, and rail carriers to its Fusion Cloud Transportation Management platform in September 2025, improving predictive arrival accuracy to two-hour windows for 90% of loads. Descartes expanded into the freight-broker segment by acquiring AscendTMS for USD 85 million in August 2025, gaining 12,000 new customers and cross-selling customs and trade-compliance modules. Blue Yonder partnered with Microsoft in December 2025 to embed Azure OpenAI conversational search into its Luminate Control Tower, reducing manual monitoring effort by an estimated 40% for early adopters.
Smaller challengers target price-sensitive microenterprises with freemium tiers and usage-based billing that lower entry costs to near zero, while niche providers like CargoSmart focus on ocean-specific workflows and customs compliance. Patent activity has shifted toward AI-driven route optimization, blockchain traceability, and autonomous-vehicle integrations, signaling the next phase of product differentiation. Vendors that integrate ISO 28000 supply-chain security and ISO 14001 environmental reporting directly into dashboards gain an edge as shippers seek turnkey compliance. Overall, competition balances scale efficiencies of global suites against agility and specialization, creating a dynamic environment in which partnerships and acquisitions reshape the leaderboard annually.
Transportation Management System Industry Leaders
SAP SE
Oracle Corporation
Blue Yonder Group, Inc.
Descartes Systems Group
Manhattan Associates
- *Disclaimer: Major Players sorted in no particular order

Recent Industry Developments
- December 2025: Blue Yonder partnered with Microsoft to embed Azure OpenAI chat functions into Luminate, enabling conversational shipment queries that cut manual monitoring 40%.
- September 2025: Oracle expanded Fusion Cloud Transportation Management with predictive multi-modal visibility covering 200 carriers.
- August 2025: Descartes acquired AscendTMS for USD 85 million, adding 12,000 North American broker customers.
- June 2025: SAP released S/4HANA Transportation Management 2025 featuring AI-driven load-building that improved cube utilization 8-12% among early adopters.


Research Methodology Framework and Report Scope
Market Definitions and Key Coverage
Our study defines the transportation management system (TMS) market as cloud-based and on-premises software that helps shippers, carriers, and logistics partners plan, execute, and optimize the physical movement of goods while providing visibility, payment, and audit functions. We, the Mordor Intelligence team, measure revenues that flow from license, subscription, and managed-platform fees generated by vendors that own and maintain the core TMS codebase.
Scope exclusion: Fleet telematics hardware, pure freight-brokerage revenue, and standalone route-planning apps fall outside this scope.
Segmentation Overview
- By Mode of Transportation
- Roadways
- Railways
- Airways
- Maritime
- By Deployment
- On-Premise
- Cloud
- Hybrid
- By Enterprise Size
- Large Enterprises
- Small and Medium Enterprises
- Micro Enterprises
- By End-User Industry
- Manufacturing
- Retail and E-Commerce
- Food and Beverage
- Healthcare and Pharmaceuticals
- Automotive
- 3PL and Logistics Service Providers
- By Component
- Software
- Services
- Consulting
- Integration and Implementation
- Support and Maintenance
- By Application
- Order Management
- Route Planning and Optimization
- Freight Audit and Payment
- Real-Time Visibility and Tracking
- Inventory and Warehouse Integration
- By Geography
- North America
- United States
- Canada
- Mexico
- Europe
- Germany
- United Kingdom
- France
- Russia
- Rest of Europe
- Asia-Pacific
- China
- Japan
- India
- South Korea
- Australia
- Rest of Asia-Pacific
- Middle East and Africa
- Middle East
- Saudi Arabia
- United Arab Emirates
- Rest of Middle East
- Africa
- South Africa
- Egypt
- Rest of Africa
- Middle East
- South America
- Brazil
- Argentina
- Rest of South America
- North America
Detailed Research Methodology and Data Validation
Primary Research
We interviewed software product managers, third-party logistics users, and independent freight auditors across North America, Europe, and fast-growing Asia Pacific. Their insights clarified typical seat counts, integration pain points, and the pace at which legacy on-premise systems are being switched to multi-tenant SaaS, allowing us to tighten penetration curves and future growth limits.
Desk Research
Mordor analysts began with public macro sources such as the World Bank logistics indicators, UN Comtrade shipment flows, and national transport statistics bureaus to size freight volumes that ultimately drive TMS adoption. Trade association white papers from bodies such as the Council of Supply Chain Management Professionals and the American Trucking Associations provided cost benchmarks and digitization ratios, while patent analytics from Questel and targeted news retrieval through Dow Jones Factiva highlighted innovation hotspots and vendor activity. Company 10-Ks, investor decks, and SEC filings then helped us anchor average selling prices and deployment mix. This list is illustrative, not exhaustive; many additional secondary inputs were reviewed to refine assumptions and cross-check figures.
Market-Sizing & Forecasting
A top-down "freight-spend pool x digitization rate" model establishes the 2024 baseline, which is then corroborated with selective bottom-up checks such as sampled vendor revenue roll-ups and regional channel feedback. Key variables include global freight expenditure, cross-border e-commerce volume, average subscription price per shipment, SaaS migration share, regulatory e-logging mandates, and supply-chain resilience investments, all forecast through 2030.
For projections, multivariate regression combining freight-spend growth with SaaS penetration and price-elasticity factors produced a base CAGR that our primary experts validated. Where bottom-up revenue tallies diverged, gaps were reconciled by adjusting regional take-up rates instead of altering total spend pools.
Data Validation & Update Cycle
Model outputs pass variance checks against historical vendor disclosures; anomalies trigger senior analyst reviews before sign-off. The dataset refreshes annually, with interim updates whenever material events, such as major M&A, regulatory shifts, or macro shocks, alter market dynamics.
Why Mordor's Transportation Management System Baseline Commands Confidence
Published estimates seldom align because firms choose different revenue buckets, discounting rules, and refresh cadences. According to our analysis, the largest gaps arise when other publishers bundle brokerage margin, include telematics devices, or extrapolate aged adoption ratios without verifying recent SaaS pricing trends.
Benchmark comparison
| Market Size | Anonymized source | Primary gap driver |
|---|---|---|
| USD 12.94 B (2024) | Mordor Intelligence | - |
| USD 13.50 B (2023) | Global Consultancy A | Includes brokerage and visibility-only tools; older price deck used |
| USD 10.45 B (2023) | Trade Journal B | Excludes mid-market SaaS vendors; limited Asia Pacific sampling |
These comparisons show that Mordor's disciplined scope, dual-layer modeling, and annual refresh give decision-makers a balanced, transparent baseline that is traceable to clear variables and repeatable steps.


Key Questions Answered in the Report
What is the forecast value of the Transportation Management System market by 2031?
The Transportation Management System market is forecast to reach USD 14.89 billion by 2031, reflecting an 8.93% CAGR over the period.
Which deployment model is expanding fastest?
Cloud deployments are advancing at a 9.61% CAGR as pay-as-you-go billing, elastic compute, and rapid feature releases outcompete on-premise alternatives.
Why is healthcare the fastest-growing vertical for TMS adoption?
Serialization, cold-chain temperature controls, and stringent audit requirements drive healthcare and pharmaceutical shippers to invest in real-time tracking and compliance modules, supporting a 10.22% CAGR.
How are SMEs benefiting from Transportation Management Systems?
SMEs leverage modular SaaS pricing, open-source telemetry APIs, and government vouchers to cut integration costs, leading to a 9.67% CAGR in this segment.
Which region shows the highest growth rate in the forecast period?
Asia-Pacific is the fastest-growing region, projected at a 9.91% CAGR as policy incentives in China and India accelerate digital freight adoption.
What feature set underpins the surge in real-time visibility adoption?
Minute-level GPS polling, predictive ETA algorithms, and detention-cost dashboards help shippers cut fees and improve customer experience, fueling a 9.96% CAGR for visibility modules.
Page last updated on:


