Connected Ship Market Size and Share
Market Overview
| Study Period | 2020 - 2031 |
|---|---|
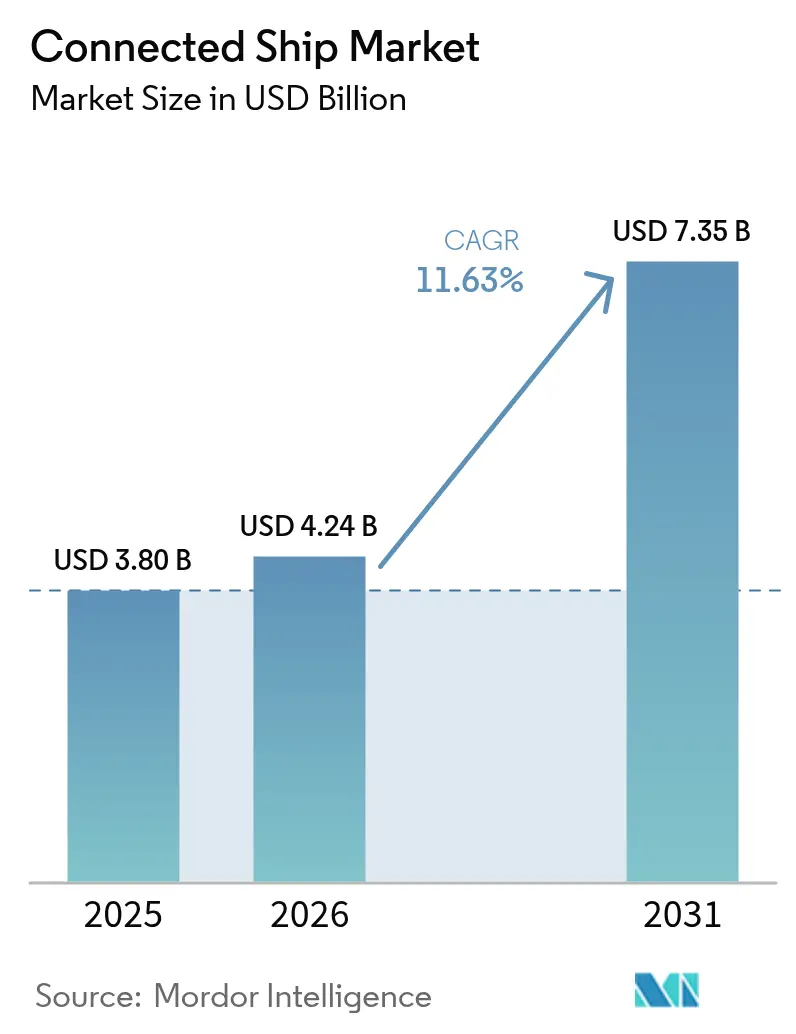
| Market Size (2026) | USD 4.24 Billion |
| Market Size (2031) | USD 7.35 Billion |
| Growth Rate (2026 - 2031) | 11.63% CAGR |
| Fastest Growing Market | Asia Pacific |
| Largest Market | Asia Pacific |
| Market Concentration | Medium |
Major Players *Disclaimer: Major Players sorted in no particular order Image © Mordor Intelligence. Reuse requires attribution under CC BY 4.0. | |
Connected Ship Market Analysis by Mordor Intelligence
Connected Ship market size in 2026 is estimated at USD 4.24 billion, growing from 2025 value of USD 3.80 billion with 2031 projections showing USD 7.35 billion, growing at 11.63% CAGR over 2026-2031.
Rising enforcement of International Maritime Organization requirements for e-navigation and carbon intensity reporting has moved data connectivity from an optional add-on to an operational prerequisite. Commercial fleet owners are digitizing operations to trim fuel use, cut emissions, and maintain compliance, while defense agencies accelerate adoption for situational awareness and crew welfare. Satellite innovations, especially Low Earth Orbit constellations, have slashed bandwidth costs, widening access for small operators. Supply-chain shocks in 2024 exposed hardware vulnerabilities and prompted manufacturers to seek near-shore production, yet regulatory certainty and maturing technology continue to reinforce demand across all vessel classes.[1]International Maritime Organization, “Maritime Single Window comes into force,” imo.org
Key Report Takeaways
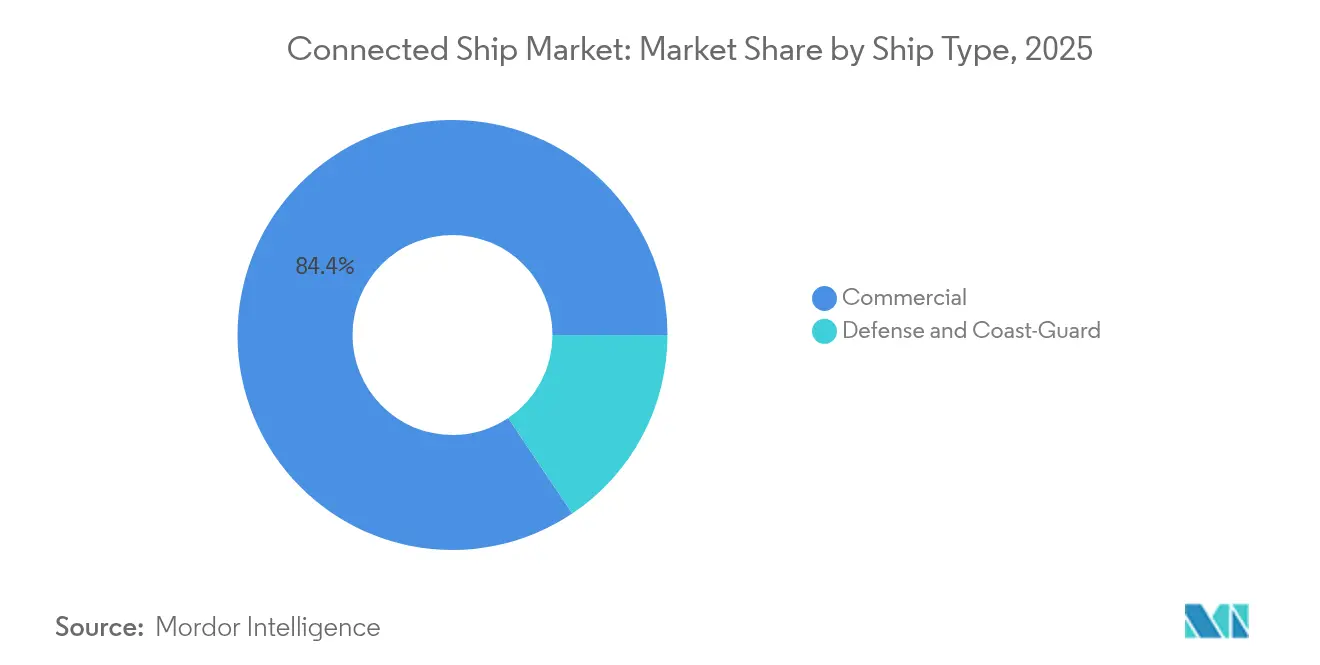
- By ship type, commercial vessels held 84.40% revenue share of the connected ship market in 2025; defense applications are growing fastest at a 12.96% CAGR through 2031.
- By application, fleet operations commanded 41.30% of the connected ship market share in 2025, while fleet health monitoring is set to rise at a 13.86% CAGR to 2031.
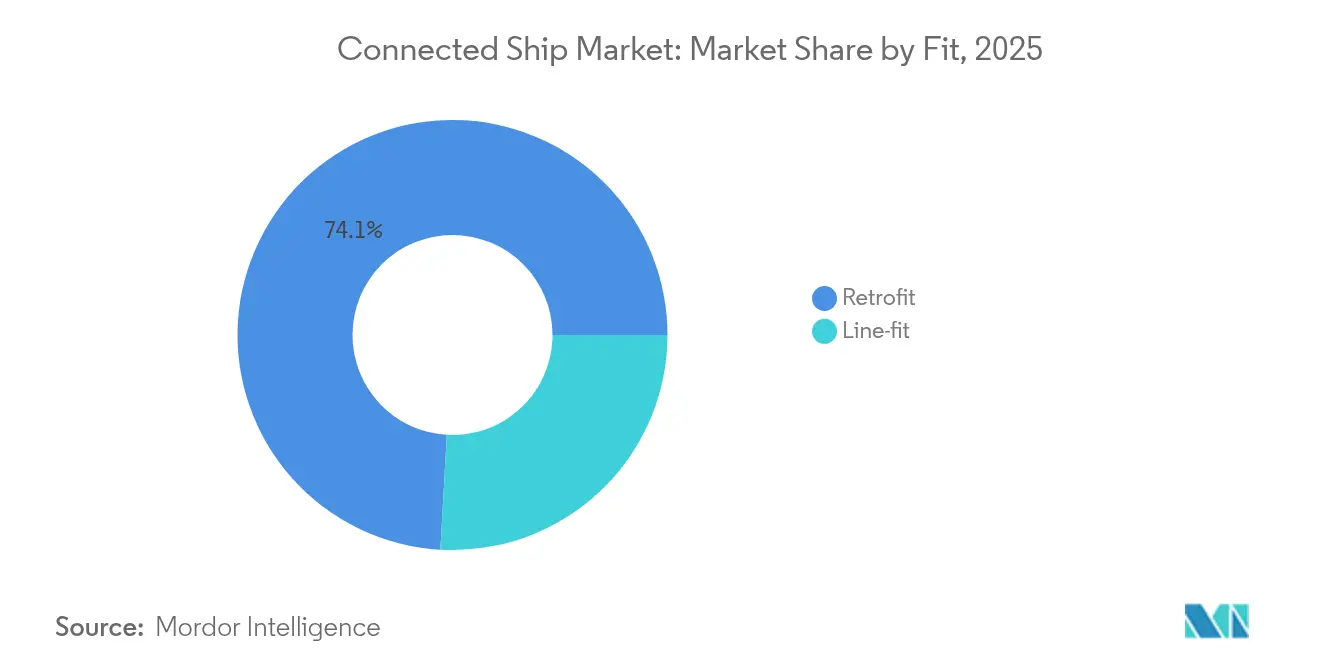
- By fit, retrofit installations accounted for a 74.10% share of the connected ship market size in 2025, whereas line-fit solutions are projected to climb at a 16.92% CAGR over 2026-2031.
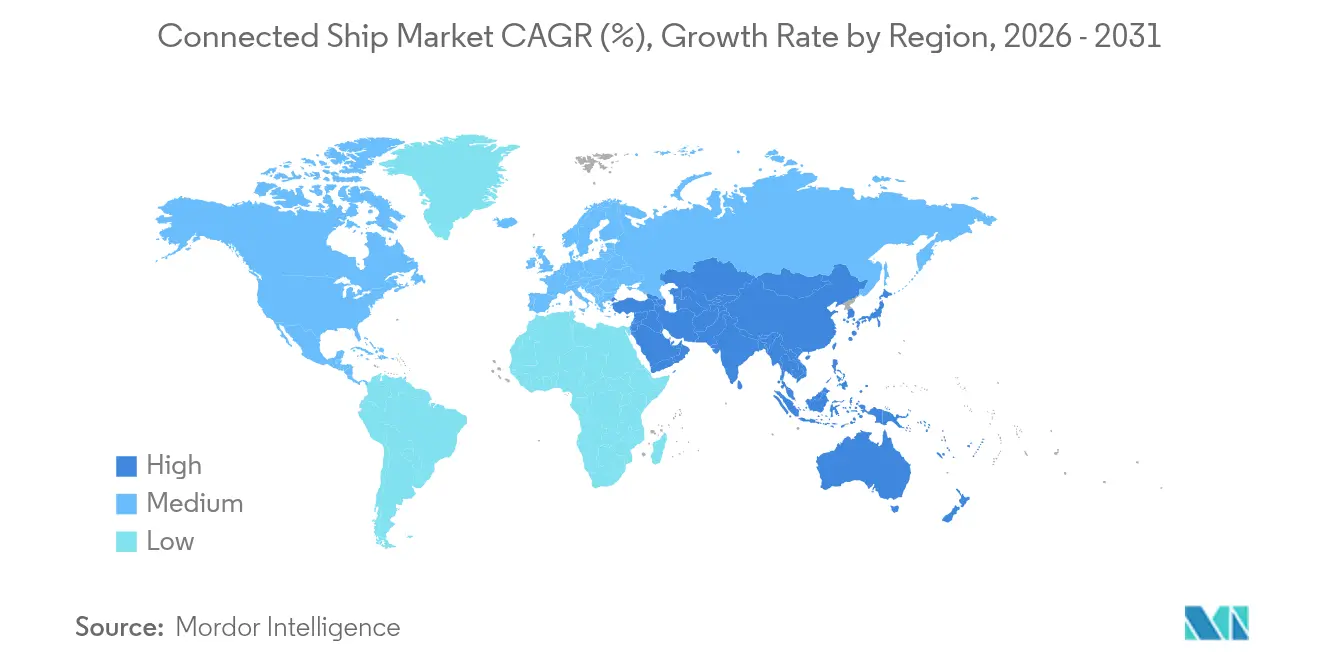
- By geography, Asia Pacific dominated with 34.60% connected ship market share in 2025, and the region is forecast to expand at a 20.95% CAGR to 2031.
Note: Market size and forecast figures in this report are generated using Mordor Intelligence’s proprietary estimation framework, updated with the latest available data and insights as of 2026.
Global Connected Ship Market Trends and Insights
Drivers Impact Analysis*
| Driver | (~) % Impact on CAGR Forecast | Geographic Relevance | Impact Timeline |
|---|---|---|---|
| IMO e-navigation & CII mandates | +3.10% | Global with stricter enforcement in EU waters | Short term (≤ 2 years) |
| Growing incorporation of ICT and IoT on-board | +2.80% | Europe and North America lead early adoption | Medium term (2-4 years) |
| Rapid roll-out of LEO constellations | +2.40% | Major shipping lanes worldwide | Short term (≤ 2 years) |
| Carbon-intensity targets | +1.90% | Global with accelerated adoption in EU | Medium term (2-4 years) |
| Source: Mordor Intelligence | |||
IMO e-navigation and CII mandates
Continuous data reporting now replaces periodic logs, forcing vessels to integrate real-time connectivity that links bridge, engine room, and shore offices. The Maritime Single Window, live since January 2024, obliges ports to accept standardized electronic submissions, which raises baseline connectivity requirements worldwide. New S-100 hydrographic standards, operational from 2025, add granular bathymetric layers that feed digital twins used for autonomous navigation. The revised International Maritime Organization strategy targets a 40% cut in CO₂ intensity by 2030, so ship owners equip sensors that validate progress and avoid penalties.[2]The Maritime Executive, “IMO adopts revised GHG strategy,” maritime-executive.com Electronic certificates for seafarers, adopted in 2025, further digitize crew management and reduce administrative lags.
Growing incorporation of ICT and IoT on board
Fleet managers now deploy thousands of low-power sensors that feed predictive analytics engines, allowing maintenance teams to fix components before failure. Maersk’s collaboration with Onomondo connects containers through global cellular and satellite links, showing how large carriers exploit IoT to raise schedule reliability. [3]IoT Tech News, “Maersk expands Onomondo partnership,” iottechnews.com NB-IoT and BLE Mesh devices track humidity, vibration, and shock inside boxes, creating continuous end-to-end cargo visibility. Edge computing modules process data locally to lower satellite bandwidth use and preserve latency-sensitive functions. Port operators in South Korea and Japan support ship-to-shore 5 G networks that backhaul the data once vessels berth, closing the information loop.
Rapid roll-out of LEO constellations
Low Earth Orbit services have cut latency below 70 ms and dropped price per megabit by more than half compared with legacy geostationary links. Starlink equipment is now active on about 75,000 ships, and its entry spurred established operators to bundle LEO and GEO coverage in hybrid plans. Iridium’s acceptance into 3GPP Release 19 clears a path to global 5 G NB-IoT satellite links by late 2025, which will offer direct-to-device messaging without proprietary terminals. National fleets such as the Japan Coast Guard endorse LEO systems to improve crew morale, since streaming and real-time video calls are now affordable. Competitive pricing and service resilience accelerate adoption among small coastal craft that previously relied on voice-only L-band terminals.
Carbon-intensity targets driving data-driven voyage optimization
Voyage planning tools now model fuel, weather, and charter constraints alongside real-time carbon pricing to minimize total cost. The European Union’s FuelEU Maritime rule, live in 2025, forces ships in EU waters to curb emissions by 2% each year, which pushes owners toward software-based route adjustments. Studies show optimization algorithms can lift fleet profit by 4.38% while satisfying the Carbon Intensity Indicator, illustrating a direct financial upside to compliance. Alternative measures, such as shipboard carbon capture, cost EUR 115 per ton of CO₂, so operators first exploit digital efficiency before capital-heavy retrofits. Lifecycle service contracts that tie engine performance to verified emission gains further embed connectivity in daily operations.
Restraints Impact Analysis*
| Restraint | (~) % Impact on CAGR Forecast | Geographic Relevance | Impact Timeline |
|---|---|---|---|
| High CAPEX / OPEX of broadband connectivity | -1.80% | Global with sharper effect in developing fleets | Medium term (2-4 years) |
| Escalating cyber-risk & insurance premiums | -1.40% | United States and European Union | Short term (≤ 2 years) |
| Source: Mordor Intelligence | |||
High CAPEX / OPEX of broadband connectivity
Hardware, installation, airtime, and crew training together stretch shipowner budgets, especially for smaller tramp operators. The United States Coast Guard cyber rules add USD 138.7 million per year in compliance costs, raising the hurdle for digital upgrades. Semiconductor scarcity lifted electronics pricing throughout 2024, and tariffs on Chinese components added a further 25% to production costs. Many owners delay line-fit projects until vessels dry-dock to minimize downtime, yet this approach prolongs payback periods. Leasing models and bandwidth-as-a-service plans are emerging to ease capital strain, though adoption remains cautious.
Escalating cyber-risk and insurance premiums
Every additional entry point—from bridge displays to cargo sensors—creates a potential attack vector. The International Association of Classification Societies now demands cybersecurity controls for critical onboard systems, making non-compliance a safety deficiency. Underwriters have responded with double-digit hikes in cyber cover, linking premiums to evidence of layered defenses and crew awareness programs. Research shows machine-learning-based anomaly detection outperforms signature approaches in maritime networks, yet false positives still burden operators. A lack of uniform standards across flag states complicates risk assessments and leaves fleets exposed to regulatory patchwork. The resulting uncertainty slows some investment decisions and caps short-term growth.
*Our forecasts treat driver/restraint impacts as directional, not additive. The impact forecasts reflect baseline growth, mix effects, and variable interactions.
Segment Analysis
By Ship Type: Commercial Vessels Maintain Commanding Lead
The commercial segment generated 84.40% of the connected ship market revenue in 2025, reflecting the sheer number of merchant hulls and rising regulatory compliance costs. The connected ship market size for commercial vessels is projected to grow at an 11.21% CAGR, underpinning investments in fuel optimisation, cargo visibility, and crew connectivity. Defense applications are expanding at 12.96% CAGR as navies pursue autonomous patrol craft, secure communications, and integrated battlespace awareness. Growing geopolitical tensions and joint exercises in the Indo-Pacific further drive defense demand, yet budget cycles introduce procurement delays that temper near-term volumes. Commercial carriers look to defense innovations—such as mesh networking and hardened cybersecurity—for cost-effective civilian spin-offs.
Fleet digitization in the commercial arena anchors financial return on investment through lower fuel burn and port call efficiency. Meanwhile, defense buyers value redundant satcom links and electromagnetic resilience over bandwidth price, a distinction that shapes vendor roadmaps. As software-defined radios shrink in size and cost, cross-segment platforms emerge that serve merchants, coast guard, and naval customers with minimal hardware variance. The convergence shortens development cycles and spreads R&D cost across a wider volume base, reinforcing incumbent yet open niches for specialized cybersecurity vendors.


By Application: Fleet Health Monitoring Takes Growth Spotlight
Fleet operations solutions retained 41.30% connected ship market share in 2025, supported by widespread use of electronic chart systems, route optimization, and cargo tracking. In contrast, fleet health monitoring advances at 13.86% CAGR thanks to falling sensor prices and cloud analytics that predict machinery failure with high accuracy. The connected ship market size for fleet health monitoring is forecast to more than double by 2031, aided by classification societies that now accept condition-based survey data in lieu of calendar inspections. Ship managers deploy digital twins that integrate propulsion, hull, and auxiliaries, allowing simulations that cut maintenance planning time and dockyard overruns.
Artificial intelligence elevates voyage planning tools from passive dashboards to prescriptive advisors that balance cost, safety, and emissions. Vessel traffic management growth moderates as mandatory systems reach saturation in busy waterways; however, advanced collision-avoidance algorithms add incremental revenue through software upgrades rather than new hardware. Integrated application suits merge operational and maintenance planning, so operators no longer juggle multiple vendors and user interfaces. The shift rewards platforms that expose open APIs and support cybersecurity standards suitable for insurance audits.
By Fit: Line-fit Momentum Signals Design Paradigm Shift
Retrofit projects accounted for 74.10% of the connected ship market in 2025, since the global fleet averages 12 years of age and must meet near-term digital mandates. Yet line-fit installs are climbing at 16.92% CAGR as yards embed antenna cabling, server racks, and sensor wiring during construction, slashing lifecycle cost. Newbuild designers now allocate deck, mast, and bridge real estate for phased-array terminals, making bandwidth upgrades a firmware exercise rather than a cutting-steel modification. The connected ship market share for line-fit solutions is set to reach 38.70% by 2031 as owners specify digital-ready hulls to protect asset value.
Shipyards in South Korea and China advertise “smart factory” outputs that pre-configure vessels with cyber-secure networks and edge servers. Owners lock in multi-year airtime packages at delivery, smoothing cash flow and ensuring compliance from day one. Retrofit demand persists, however, as emission regulations require even decade-old tonnage to install data logging and satellite links. Class societies streamline approvals for drop-in terminals and power over Ethernet sensors, shortening retrofit yard stays. Vendors that support both fit types achieve scale benefits, whereas one-product specialists face margin compression.
Geography Analysis
Asia Pacific leads global adoption with 34.60% connected ship market share in 2025 and a 20.95% growth trajectory to 2031. China’s green shipbuilding action plan, targeting 50% share in zero-carbon vessels by 2025, pushes yards to integrate digital systems that monitor fuel cells, batteries, and alternative fuels. Japan’s Society 5.0 program funds research on ship-to-shore data exchange and maritime autonomous surface ships, reinforcing domestic demand. South Korea’s export credit support encourages fleets to specify high-bandwidth satcom during newbuild tenders, ensuring early migration to LEO-enabled hybrid networks.
North America ranks second by revenue, driven by strict cybersecurity regulations and high labor costs that make predictive maintenance attractive. The United States Coast Guard mandate, effective July 2025, accelerates cyber-secure retrofits on Jones Act fleets, while offshore energy operators view connected drilling vessels as essential for safety and uptime. Canadian operators leverage connectivity to comply with Arctic voyage reporting and to enable remote technical assistance amid sparse shore infrastructure.
Europe commands mature adoption levels but remains growth-relevant due to environmental legislation. FuelEU Maritime and inclusion of shipping in the EU Emissions Trading System demand granular data reporting that only connected platforms can deliver. Ports across Scandinavia, the Netherlands, and Spain now offer reduced harbour dues for digitally verified carbon reductions, reinforcing the business case. Intra-EU short-sea operators invest in low-power terminals paired with cellular backhaul to maintain constant data flow even within coastal zones. Together, these factors underpin steady European fleet conversions through 2030.

Competitive Landscape
The connected ship market hosts a mixture of legacy marine equipment makers, satellite operators, and software specialists. Kongsberg, Wärtsilä, and Thales leverage decades of voyage, power, and defense know-how, bundling sensors, analytics, and support into multi-year service agreements. Space-economy entrants such as Starlink and OneWeb compete primarily on bandwidth cost and latency, forcing incumbents to adopt hybrid GEO-MEO-LEO architectures. Software-first firms, including Orca AI and Nautilus Labs, differentiate through machine-learning algorithms that boost fuel and safety outcomes without proprietary hardware.
Strategic alliances dominate investment patterns. CMA CGM links with Google to fuse ocean freight data with cloud AI, and Maersk partners with Onomondo for container telematics at scale. Patent filings reveal heavy activity around maritime 5 G, holographic beamforming, and quantum-safe encryption, signaling long-term bets on leapfrog connectivity. Vendors race to deliver platforms that expose open APIs, easing integration with port community systems and classification society portals.
Market exits and consolidations illustrate intensifying rivalry. VSAT suppliers merge to achieve scale, while equipment makers divest non-core units to fund digital capabilities, seen in Cargotec’s sale of MacGregor for EUR 480 million. Cybersecurity startups attract strong funding as charterers and insurers prefer audited defenses. Larger groups absorb niche players to seal portfolio gaps, yet fragmentation persists around specialized AI, edge computing, and autonomous navigation.
Connected Ship Industry Leaders
Northrop Grumman Corporation
Wärtsilä Corporation
Kongsberg Gruppen AS
Marlink AS
General Electric Co.
- *Disclaimer: Major Players sorted in no particular order

Recent Industry Developments
- May 2025: Saildrone raised USD 60 million to expand unmanned surface vehicles for ocean research and commercial services .
- May 2025: Orca AI secured USD 72.5 million in Series B funding to scale AI-powered navigation safety solutions
- April 2025: DSV acquired DB Schenker for EUR 14.3 billion (USD 15.2 billion) to deepen integrated logistics and digital capacity.
- April 2025: Blue Water Autonomy closed a USD 14 million seed round for naval unmanned surface vehicle development.


Global Connected Ship Market Report Scope
The connected ship technology is installed in commercial and defense cargo ships and is traditionally used for transferring the cargo to the seagoing ships that are situated either underway or stationary.
The connected ship market is segmented by Ship Type (Commercial, Defense), by Application Type (Vessel Traffic Management, Fleet Operations, Fleet Health Monitoring), by Fit (Line Fit, Retrofit), and Geography.
| Commercial |
| Defence and Coast-Guard |
| Vessel Traffic Management |
| Fleet Operations |
| Fleet Health Monitoring |
| Retrofit |
| Line-fit |
| North America | United States |
| Canada | |
| Europe | United Kingdom |
| Germany | |
| France | |
| Rest of Europe | |
| Asia-Pacific | China |
| Japan | |
| India | |
| South Korea | |
| Rest of Asia-Pacific | |
| Middle East and Africa | |
| South America |
| By Ship Type | Commercial | |
| Defence and Coast-Guard | ||
| By Application | Vessel Traffic Management | |
| Fleet Operations | ||
| Fleet Health Monitoring | ||
| By Fit | Retrofit | |
| Line-fit | ||
| By Geography | North America | United States |
| Canada | ||
| Europe | United Kingdom | |
| Germany | ||
| France | ||
| Rest of Europe | ||
| Asia-Pacific | China | |
| Japan | ||
| India | ||
| South Korea | ||
| Rest of Asia-Pacific | ||
| Middle East and Africa | ||
| South America | ||


Key Questions Answered in the Report
What is the current size of the connected ship market?
The connected ship market is valued at USD 4.24 billion in 2026 and is projected to hit USD 7.35 billion by 2031.
Which ship type leads the adoption of connected technologies?
Commercial vessels dominate with 84.40% revenue share in 2025, reflecting regulatory pressure on merchant fleets and higher operational ROI.
Which application segment is growing fastest?
Fleet health monitoring is expanding at a 13.86% CAGR for 2026-2031 because predictive maintenance lowers downtime and repair expense.
Why is Asia Pacific the largest regional market?
Policy mandates, extensive shipbuilding capacity, and government funding for digital initiatives give Asia Pacific 34.60% market share and the highest growth rate at 20.95% CAGR.
How are Low Earth Orbit satellites affecting maritime connectivity costs?
LEO constellations cut latency and bandwidth pricing, enabling small operators to adopt broadband services that were previously unaffordable.
What are the main barriers to faster market growth?
High capital expenditure, escalating cyber-risk compliance costs, semiconductor shortages, and geopolitical transit disruptions each reduce forecast CAGR by roughly 1%-2%.
Page last updated on:


