Market Overview
| Study Period | 2019 - 2030 |
|---|---|
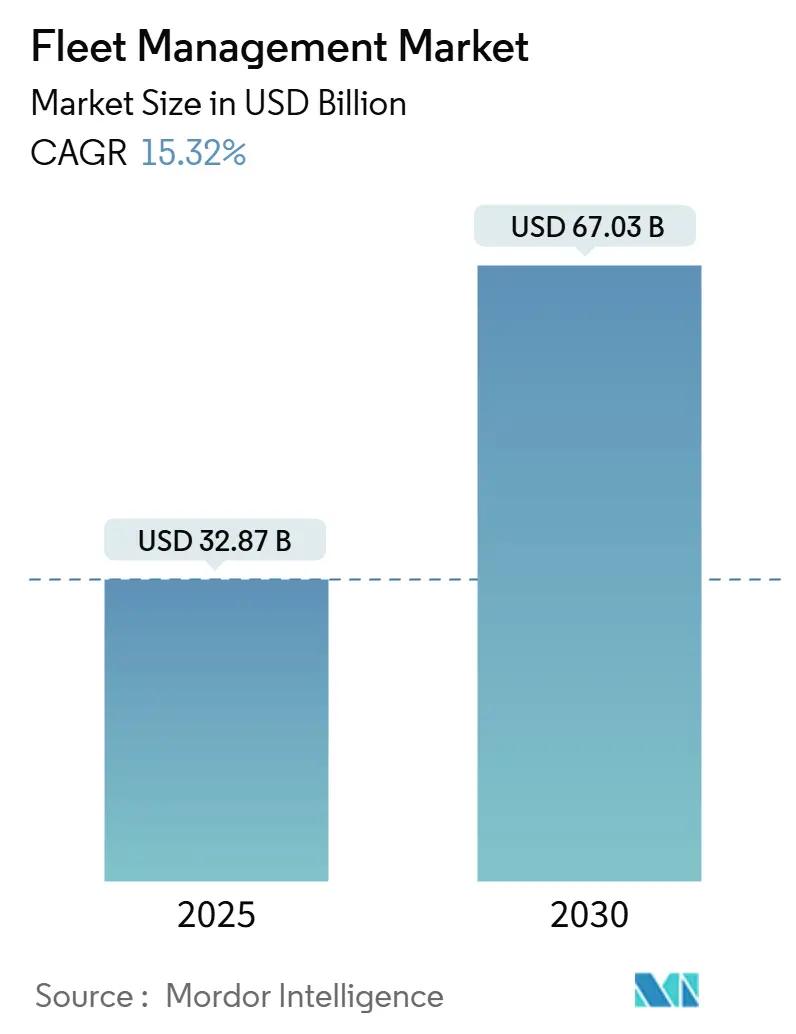
| Market Size (2025) | USD 32.87 Billion |
| Market Size (2030) | USD 67.03 Billion |
| Growth Rate (2025 - 2030) | 15.32% CAGR |
| Fastest Growing Market | Asia Pacific |
| Largest Market | North America |
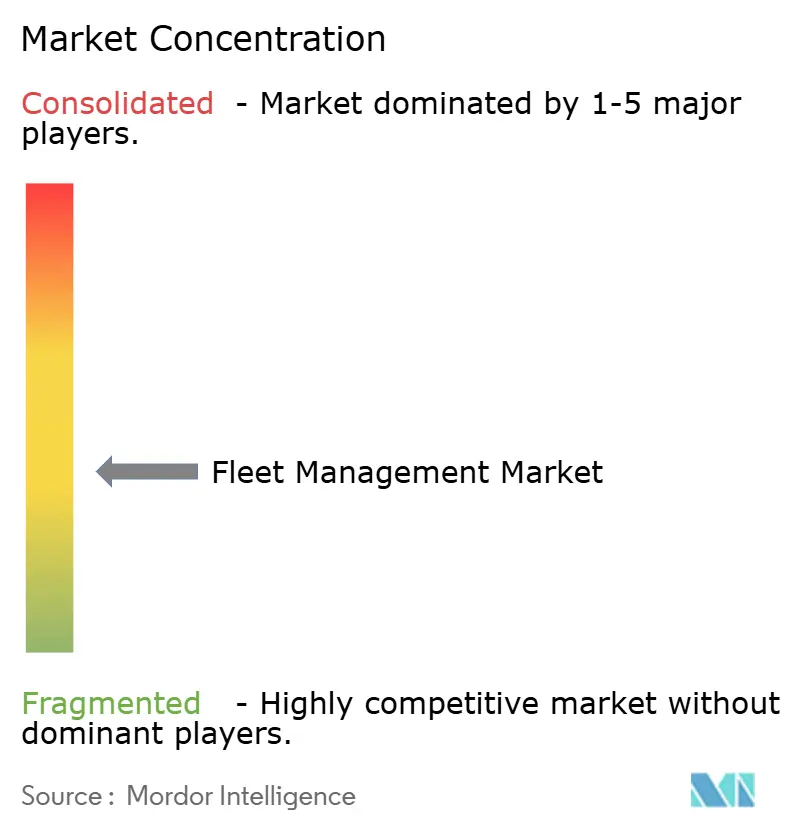
| Market Concentration | Medium |
Major Players *Disclaimer: Major Players sorted in no particular order Image © Mordor Intelligence. Reuse requires attribution under CC BY 4.0. | |
Fleet Management Market Analysis by Mordor Intelligence
The fleet management market generated USD 32.87 billion in 2025 and is forecast to climb to USD 67.03 billion by 2030, advancing at a robust 15.32% CAGR. This performance reflects tightening CO₂ and electronic logging mandates, the spread of OEM-embedded telematics, and the arrival of 5G that supports sub-10 millisecond latency for real-time coordination. Margins improve when fleets optimize routes, fuel consumption, and preventive maintenance, so investment in connected platforms has become a board-level priority. Vendors that combine edge AI with secure cloud services are widening the gap because they permit predictive analytics without compromising data sovereignty. The fleet management market also benefits from usage-based insurance partnerships that translate safer driving into premium reductions, creating a self-reinforcing adoption cycle. Semiconductor shortages and evolving privacy rules temper the growth outlook but primarily disadvantage newcomers that lack diversified supply chains and compliance expertise.
Key Report Takeaways
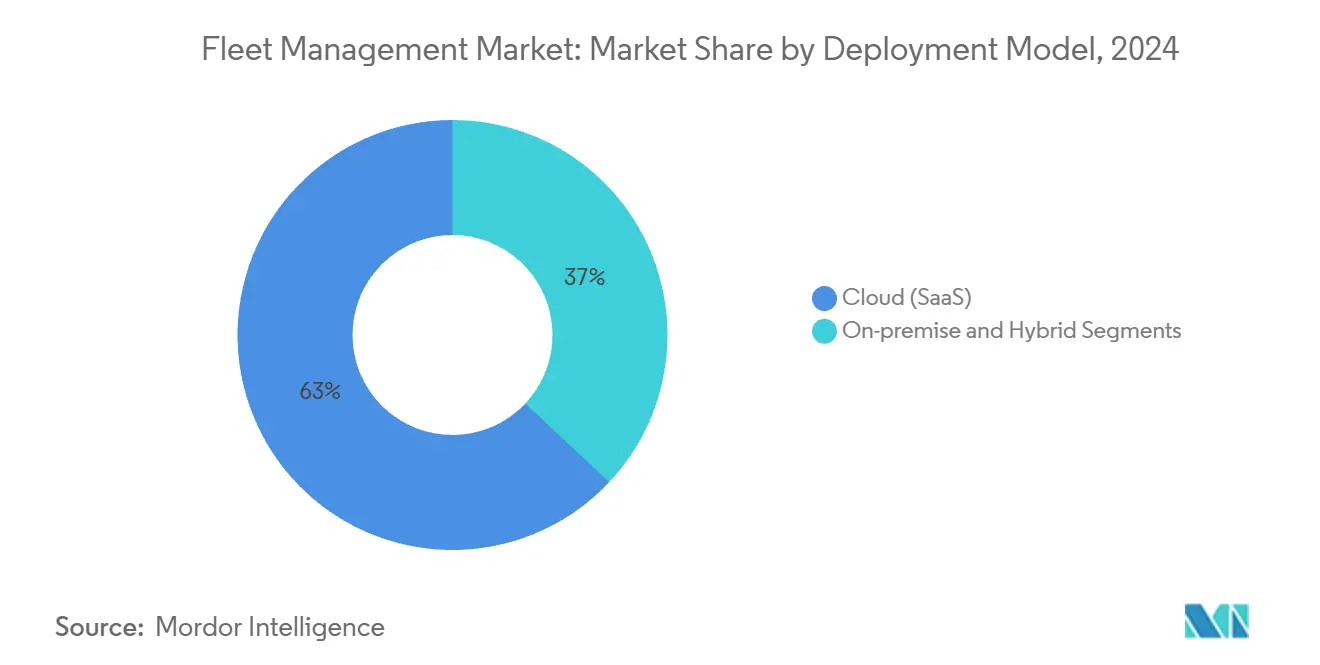
- By deployment model, cloud-based Software-as-a-Service led with 63% revenue share in 2024, while hybrid solutions are projected to rise at a 20.4% CAGR to 2030.
- By software type, vehicle and asset tracking captured 27.5% of the fleet management market share in 2024; analytics and reporting are set to expand at an 18.1% CAGR through 2030.
- By vehicle type, light commercial vehicles held 46.2% of the fleet management market size in 2024; off-highway equipment is poised for 17.3% CAGR growth to 2030.
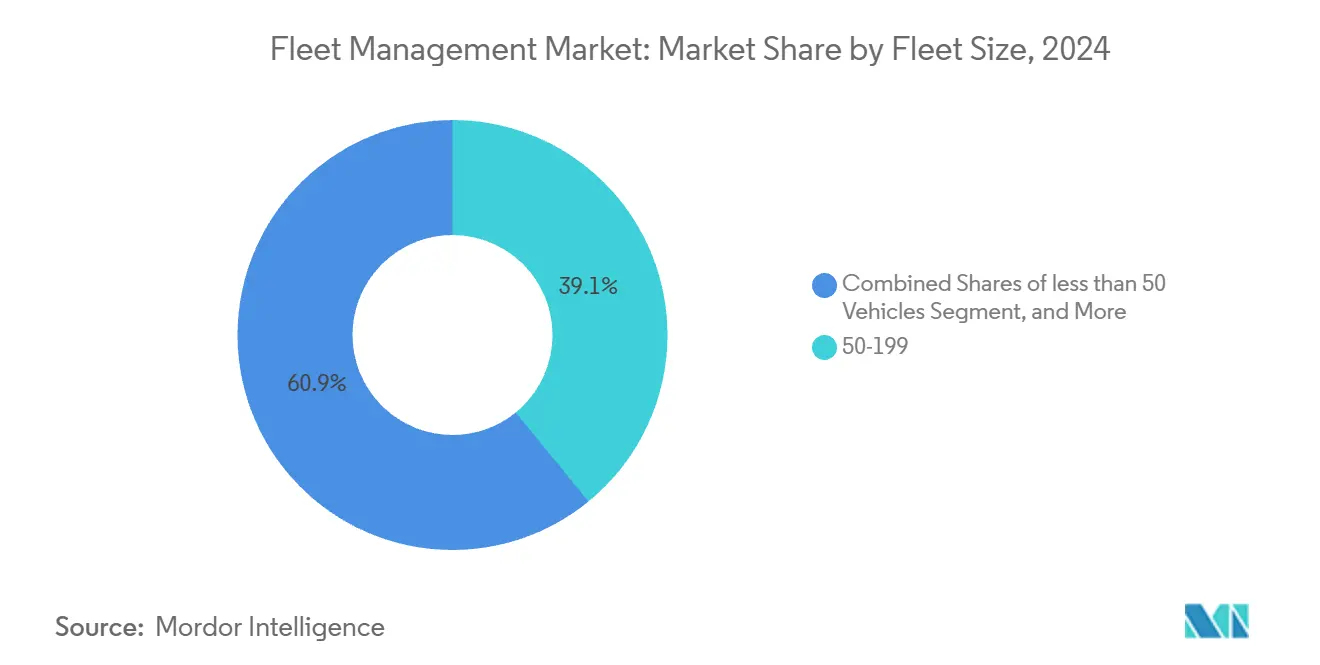
- By fleet size, mid-sized operations with 50-199 units accounted for a 39.1% share in 2024, whereas enterprise fleets above 1,000 vehicles are forecast to grow 15.5% annually.
- By end-user industry, transportation and logistics represented 42% of 2024 demand; construction and mining are the fastest risers at 16% CAGR through 2030.
- By geography, North America dominated with a 36% share in 2024, but Asia Pacific is the frontrunner in growth at 15.4% CAGR to 2030
Global Fleet Management Market Trends and Insights
Drivers Impact Analysis*
| Driver | (~) % Impact on CAGR Forecast | Geographic Relevance | Impact Timeline |
|---|---|---|---|
| Rapid rise in OEM-embedded telematics | +3.2% | Global, North America and Europe focus | Medium term (2–4 years) |
| 5G and NB-IoT rollout lowering latency | +2.8% | APAC core, spill-over to North America and Europe | Short term (≤ 2 years) |
| Usage-based insurance partnerships | +2.1% | North America and EU, expanding to APAC | Medium term (2–4 years) |
| Stricter CO₂ / ELD mandates | +2.9% | EU first, North America next, selective APAC adoption | Long term (≥ 4 years) |
| Edge-AI enabling predictive maintenance | +1.8% | Global, with early adoption in developed markets | Long term (≥ 4 years) |
| Commercial drone fleets creating adjacency | +1.1% | North America and EU, emerging in APAC | Long term (≥ 4 years) |
| Source: Mordor Intelligence | |||
Rapid rise in OEM-embedded telematics
More than three-quarters of new light vehicles shipped with native connectivity in 2023, giving operators direct access to engine diagnostics, battery health, and over-the-air software updates. Blending multiple OEM data feeds, however, demands powerful normalization engines and open APIs. Providers that already integrate across 150-plus makes are gaining wallet share because they spare customers the cost of aftermarket hardware while unlocking richer predictive maintenance models.[1]Geotab Media Center, “Global OEM Integration Expansion,” geotab.com
5G and NB-IoT rollout lowering latency
Sub-10 millisecond links allow dispatchers to update routes in dense urban corridors before congestion materializes, trimming fuel use by 15-20%. Edge computing modules on the vehicle now run AI vision that flags hard-braking or lane-departure events locally, sending only exceptions to the cloud, which lowers bandwidth charges and speeds driver coaching. Utility fleets illustrate the benefit: smart meters using 5G relay fault data in real time, accelerating outage restoration.[2]Honeywell Smart Energy, “Verizon 5G Partnership Announcement,” honeywell.com
Usage-based insurance partnerships
Carriers embed IoT modules in policy packages, converting safety gains into discounted premiums and accelerating payback for technology upgrades. Underwriters also tap anonymized telematics data to refine actuarial models, improving risk selection while rewarding fleets that maintain coaching programs. The model levels the playing field for small operators that lacked capital for traditional loss-control tools.
Stricter CO₂ / ELD mandates
The European Union now targets a 90% cut in heavy-duty CO₂ by 2040, while North American regulators expand electronic logging to older trucks. Tax-linked fuel surcharges in Germany and distance-based tolling tied to emission classes make compliance and fuel optimization inseparable.
Restraints Impact Analysis*
| Restraint | (~) % Impact on CAGR Forecast | Geographic Relevance | Impact Timeline |
|---|---|---|---|
| Cyber-ransomware risk on connected fleets | −1.9% | Global, higher in developed markets | Short term (≤ 2 years) |
| Fragmented regulatory data-sharing rules | −1.4% | EU complexity, North America and APAC follow | Medium term (2–4 years) |
| Driver privacy backlash | -0.8% | EU and North America primarily, emerging in APAC | Medium term (2-4 years) |
| Silicon carbide power electronics supply bottlenecks | -1.2% | Global, with acute impact in APAC manufacturing | Long term (≥ 4 years) |
| Source: Mordor Intelligence | |||
Cyber-ransomware risk on connected fleets
Attacks against transport networks quadrupled between 2017 and 2022, exposing real-time asset locations and immobilizing vehicles until ransoms are paid. Mid-sized carriers often run outdated maintenance software that lacks multifactor authentication, widening the threat surface. Industry associations now recommend zero-trust architectures and endpoint detection on every telematics gateway.
Fragmented regulatory data-sharing rules
GDPR in Europe diverges from North American disclosure frameworks, and several ASEAN members require local data storage. Providers must therefore maintain region-specific data lakes, a costly proposition that can limit advanced analytics because cross-border datasets remain siloed. The Federal Transit Administration is drafting interoperability standards, yet adoption is uneven, delaying seamless multimodal optimization.
*Our forecasts treat driver/restraint impacts as directional, not additive. The impact forecasts reflect baseline growth, mix effects, and variable interactions.
Segment Analysis
By Deployment Model: Hybrid solutions bridge infrastructure gaps
Hybrid architectures are rising at 20.4% CAGR because they keep sensitive operations data on-premises while tapping elastic cloud analytics during peak demand. The fleet management market size for cloud deployments reached 63% share in 2024, but compliance-driven buyers such as defense agencies still require on-site servers. Suppliers bundle edge gateways that sync only exception events, cutting roaming charges and supporting operations in low-bandwidth geographies. Case studies in government electric vehicle programs confirm that hybrid stacks reduce latency for emergency response while meeting data residency statutes.
Adoption momentum stems from lessons learned in pure-cloud rollouts where connection drops led to gaps in ELD logs. Vendors now pre-load critical rulesets on edge devices, letting drivers stay compliant even if coverage falls to 2G. Once connectivity resumes, cached records synchronize automatically. This pattern is redefining architectures, the cloud remains the analytics brain, the edge becomes the compliance guard, and on-premises appliances assure sovereignty.


By Software Type: Analytics drive operational intelligence
Vehicle tracking remains the revenue anchor at 27.5% share, but demand is shifting toward analytics and reporting that grow 18.1% a year. Dashboards now rank drivers by safety score and project brake-pad life using machine learning. The fleet management market generates higher margins from add-on modules such as automated coaching, fuel tax reconciliation, and AI-based cargo monitoring. Providers that package these insights with open APIs convert single-product sales into multi-year platform contracts.
Specialization is intensifying. Some vendors focus on low-bridge avoidance for urban freight, others on brake-performance monitoring for European operators. This vertical depth is displacing generic “dots-on-a-map” platforms. Early adopters report 35% cuts in safety incidents after rolling out connected driver training that translates telematics data into micro-learning videos.[3]Samsara, “Connected Training Case Study,” samsara.com
By Vehicle Type: Off-highway equipment digitization accelerates
Light commercial vehicles hold the largest installed base because parcel, utilities, and municipal fleets dominate urban roads. However, the highest upside resides in construction and mining machinery where digital penetration is under 25%. Off-highway telematics deliver paybacks by curbing idle hours and predicting hydraulic failures, explaining the 17.3% CAGR outlook. When OEM dashboards detect anomalies, remote engineers can disable engines to deter theft or trigger mobile service before a breakdown occurs.
For heavy trucks, ELD expansion keeps hardware demand buoyant, yet incremental revenue increasingly comes from over-the-air reefer temperature compliance and trailer-door sensors that ensure cargo integrity. Fleet managers replace clipboards with digital inspections that upload videos, shrinking roadside-repair costs and warranty disputes. The sector’s trajectory shows that hardware attachment paves the way, but analytics sustains value creation.
By Fleet Size: Enterprise adoption drives technology integration
Operators with 50-199 assets form the adoption core because complexity matches ROI sweet spots. Enterprise fleets above 1,000 vehicles are next in line, swelling 15.5% per year as multinationals standardize global safety policies and capture carbon data for ESG reporting. In contrast, small businesses hesitate until subscription pricing aligns with cash flow. Pay-as-you-go models and bundled insurance incentives are gradually removing that hurdle.
Large carriers increasingly demand platform breadth over point solutions. One vendor added 2,500 enterprise accounts that each spend more than USD 100,000 annually on telematics, signaling appetite for integrated maintenance authorization, dispatch, and compliance suites. Mid-market buyers emulate these playbooks as they expand geographically, suggesting a cascading effect on software penetration.
By End-User Industry: Construction and mining lead digital transformation
Freight transport still dominates volumes at 42%, but resource extraction sectors are closing the gap because safety compliance and equipment utilization directly impact profitability. Telematics that cut under-loading and prevent overspeeding in haul roads improve cycle time and fuel burn. Operators report 30% drops in unscheduled downtime and half-million-dollar annual savings after integrating inspection apps with OEM diagnostics feeds.
Energy utilities adopt fleet platforms to coordinate outage crews and log carbon intensity of service trips. Public agencies pivot to electric patrol cars managed over a single pane of glass, logging energy consumption and battery health in real time. The breadth of use cases indicates the fleet management market is evolving from a logistics tool into a cross-industry operational backbone.
Geography Analysis
North America retains 36% share of the fleet management market, bolstered by enforced electronic logs and mature cellular networks. Carriers face stiffer penalties for hours-of-service violations, so telematics is non-negotiable. Insurers reward safe-driving records captured via video AI, and cross-border operations between the United States, Canada, and Mexico elevate demand for unified compliance dashboards. The region also sees higher ransomware exposure, motivating investments in endpoint security modules.
Asia Pacific exhibits the highest growth at 15.4% CAGR. China’s smart-city pilots embed telematics feeds into traffic command centers, enabling green-wave signals that favor electric delivery vans. In India, e-commerce boomers deploy route optimizers to tame congestion and shrink delivery windows. Australia and New Zealand now require electronic work diaries for heavy vehicles, lifting total installed units to an expected 2.7 million by 2028. Fragmented telecom coverage in parts of Southeast Asia pushes hybrid edge-cloud models that buffer data when 4G is unavailable.
Europe records steady demand behind the EU’s 2040 CO₂ targets. Distance-based tolling tied to emission classes forces fleets to measure and report real-time fuel intensity, putting analytics at the heart of dispatch. GDPR elevates privacy-by-design architectures, rewarding vendors that encrypt at rest and in transit. A UK logistics firm trimmed 50,000 tonnes of CO₂ by using AI to blend telematics trip data with load factors, underscoring how sustainability mandates intersect with profitability. Adoption challenges persist in Eastern Europe where cellular tariffs remain high, but shared-services models are emerging.
Mordor Intelligence provides coverage of the fleet management market across other key regional markets, including Europe, each with their regulatory frameworks and demand patterns.
Competitive Landscape
The sector remains moderately fragmented, yet consolidation is accelerating as suppliers seek scale for AI training, global support, and hardware sourcing. Recent examples include a USD 200 million purchase that added 2.6 million subscribers to one platform, pushing combined revenue past USD 400 million. Another acquirer folded a global telematics division into its open OS, gaining OEM integrations and a direct route to Tier-1 carriers.
Differentiation shifts from GPS accuracy to data science depth. Patents filed in 2024–2025 center on trajectory optimization, sensor fusion for driver monitoring, and predictive brake-wear algorithms. Qualcomm secured IP on camera-radar fusion that raises distraction detection sensitivity by 25%.[4]Qualcomm Technologies, “Sensor Fusion Patent Application,” qualcomm.comEdge AI chips now deliver 30 TOPS at sub-5-watt budgets, enabling in-vehicle inferencing without cloud round-trip. Vendors with chip partnerships enjoy cost advantages amid silicon carbide shortages.
Vertical specialization is another battleground. One provider dominates waste-management fleets with route sequencing tied to bin-lift sensors, while another leads in public safety through automated license-plate recognition. Customer stickiness grows when vendors bundle domain expertise, compliance templates, and local language support. The imperative for robust cybersecurity and multi-OEM compatibility favors incumbents with long tenures and diversified supplier bases.
Fleet Management Industry Leaders
Cisco Systems Inc.
AT&T Inc.
Ctrack (Inseego Corp.)
Geotab Inc.
Samsara Inc.
- *Disclaimer: Major Players sorted in no particular order

Recent Industry Developments
- March 2025: Fleetio raised USD 450 million in Series D and bought Auto Integrate to create an end-to-end maintenance authorization network spanning 110,000 repair shops across North America.
- March 2025: Bobcat Company released Remote Engine Disable/Enable via Machine IQ, delivering two-way control for security and service.
- February 2025: Platform Science finalized the acquisition of Trimble’s transportation telematics units, integrating them into its Virtual Vehicle ecosystem.
- January 2025: Geotab expanded mixed-fleet support to 157 OEMs covering almost 15,000 models through enhanced data access agreements.


Global Fleet Management Market Report Scope
The scope of the study focuses on the global market analysis of fleet management. The study also tracks the key market parameters, underlying growth influencers, and major vendors operating in the industry, which supports the market estimations and growth rates over the forecast period. The scope of the report encompasses market sizing and forecast for segmentation by deployment, by solution, by end-user industry, and by geography. The study further examines the impact of COVID-19 on the ecosystem.
The fleet management market is segmented by deployment model (on-premise, cloud (SaaS), hybrid), software type (asset / vehicle tracking, driver management and safety, operations and dispatch, fuel and route optimization, compliance and risk, analytics and reporting), by vehicle type (light commercial vehicles (less than 3.5 t), heavy trucks (above 3.5 t), buses and coaches, trailers / semi-trailers, off-highway and construction equipment), by fleet size (less than 50 vehicles, 50-199 vehicles, 200-999 vehicles, above or equal to 1,000 vehicles), by end-user industry (transportation and logistics, energy and utilities, construction and mining, manufacturing and retail distribution, government and public safety, other end-user industry's (rental, waste mgmt.)), and by geography (North America (United States, Canada, and Mexico), South America (Brazil, Argentina, rest of South America), Europe (United Kingdom, Germany, France, Spain, Italy, Russia, and rest of Europe), Asia Pacific (China, Japan, India, South Korea, Australia and New Zealand, and rest of Asia-Pacific), Middle East (United Arab Emirates, Saudi Arabia, Turkey), and Africa (South Africa, Nigeria, Egypt)). The market sizes and forecasts are provided in terms of value (USD) for all the above segments.
By Deployment Model
| On-Premise |
| Cloud (SaaS) |
| Hybrid |
By Solution Type
| Asset / Vehicle Tracking |
| Driver Management and Safety |
| Operations and Dispatch |
| Fuel and Route Optimization |
| Compliance and Risk |
| Analytics and Reporting |
By Vehicle Type
| Light Commercial Vehicles (less than 3.5 t) |
| Heavy Trucks (above 3.5 t) |
| Buses and Coaches |
| Trailers / Semi-trailers |
| Off-highway and Construction Equipment |
By Fleet Size
| less than 50 Vehicles |
| 50-199 Vehicles |
| 200-999 Vehicles |
| above or equal to 1,000 Vehicles |
By End-User Industry
| Transportation and Logistics |
| Energy and Utilities |
| Construction and Mining |
| Manufacturing and Retail Distribution |
| Government and Public Safety |
| Other End-User Industry's (Rental, Waste Mgmt.) |
By Geography
| North America | United States | |
| Canada | ||
| Mexico | ||
| South America | Brazil | |
| Argentina | ||
| Rest of South America | ||
| Europe | Germany | |
| United Kingdom | ||
| France | ||
| Spain | ||
| Italy | ||
| Russia | ||
| Rest of Europe | ||
| Asia Pacific | China | |
| India | ||
| Japan | ||
| South Korea | ||
| Australia and New Zealand | ||
| Rest of Asia Pacific | ||
| Middle East and Africa | Middle East | Saudi Arabia |
| United Arab Emirates | ||
| Turkey | ||
| Africa | South Africa | |
| Nigeria | ||
| Egypt | ||
| By Deployment Model | On-Premise | ||
| Cloud (SaaS) | |||
| Hybrid | |||
| By Solution Type | Asset / Vehicle Tracking | ||
| Driver Management and Safety | |||
| Operations and Dispatch | |||
| Fuel and Route Optimization | |||
| Compliance and Risk | |||
| Analytics and Reporting | |||
| By Vehicle Type | Light Commercial Vehicles (less than 3.5 t) | ||
| Heavy Trucks (above 3.5 t) | |||
| Buses and Coaches | |||
| Trailers / Semi-trailers | |||
| Off-highway and Construction Equipment | |||
| By Fleet Size | less than 50 Vehicles | ||
| 50-199 Vehicles | |||
| 200-999 Vehicles | |||
| above or equal to 1,000 Vehicles | |||
| By End-User Industry | Transportation and Logistics | ||
| Energy and Utilities | |||
| Construction and Mining | |||
| Manufacturing and Retail Distribution | |||
| Government and Public Safety | |||
| Other End-User Industry's (Rental, Waste Mgmt.) | |||
| By Geography | North America | United States | |
| Canada | |||
| Mexico | |||
| South America | Brazil | ||
| Argentina | |||
| Rest of South America | |||
| Europe | Germany | ||
| United Kingdom | |||
| France | |||
| Spain | |||
| Italy | |||
| Russia | |||
| Rest of Europe | |||
| Asia Pacific | China | ||
| India | |||
| Japan | |||
| South Korea | |||
| Australia and New Zealand | |||
| Rest of Asia Pacific | |||
| Middle East and Africa | Middle East | Saudi Arabia | |
| United Arab Emirates | |||
| Turkey | |||
| Africa | South Africa | ||
| Nigeria | |||
| Egypt | |||


Key Questions Answered in the Report
What is the current size of the fleet management market?
The fleet management market generated USD 32.87 billion in 2025 and is on track to reach USD 67.03 billion by 2030.
Which deployment model is growing the fastest?
Hybrid architectures are rising at a 20.4% CAGR because they balance data sovereignty with scalable cloud analytics.
How will 5G impact fleet management?
5G enables sub-10 millisecond latency, supporting real-time route updates, in-vehicle edge AI, and up to 20% fuel savings for urban delivery fleets.
Which region offers the highest growth potential?
Asia Pacific shows the strongest outlook with a 15.4% CAGR, driven by smart-city projects, e-commerce expansion, and regulatory pushes for connected vehicles.
What are the main cybersecurity concerns for connected fleets?
Ransomware and data theft are rising, especially among operators running outdated software; industry bodies now recommend zero-trust architectures and endpoint monitoring on every telematics gateway.
How are usage-based insurance models influencing adoption?
Insurers tie premiums to driving behavior captured through telematics, so safer fleets enjoy lower rates, accelerating technology investment even among small carriers.
Page last updated on:


